Copyright
©The Author(s) 2024.
World J Diabetes. Mar 15, 2024; 15(3): 403-417
Published online Mar 15, 2024. doi: 10.4239/wjd.v15.i3.403
Published online Mar 15, 2024. doi: 10.4239/wjd.v15.i3.403
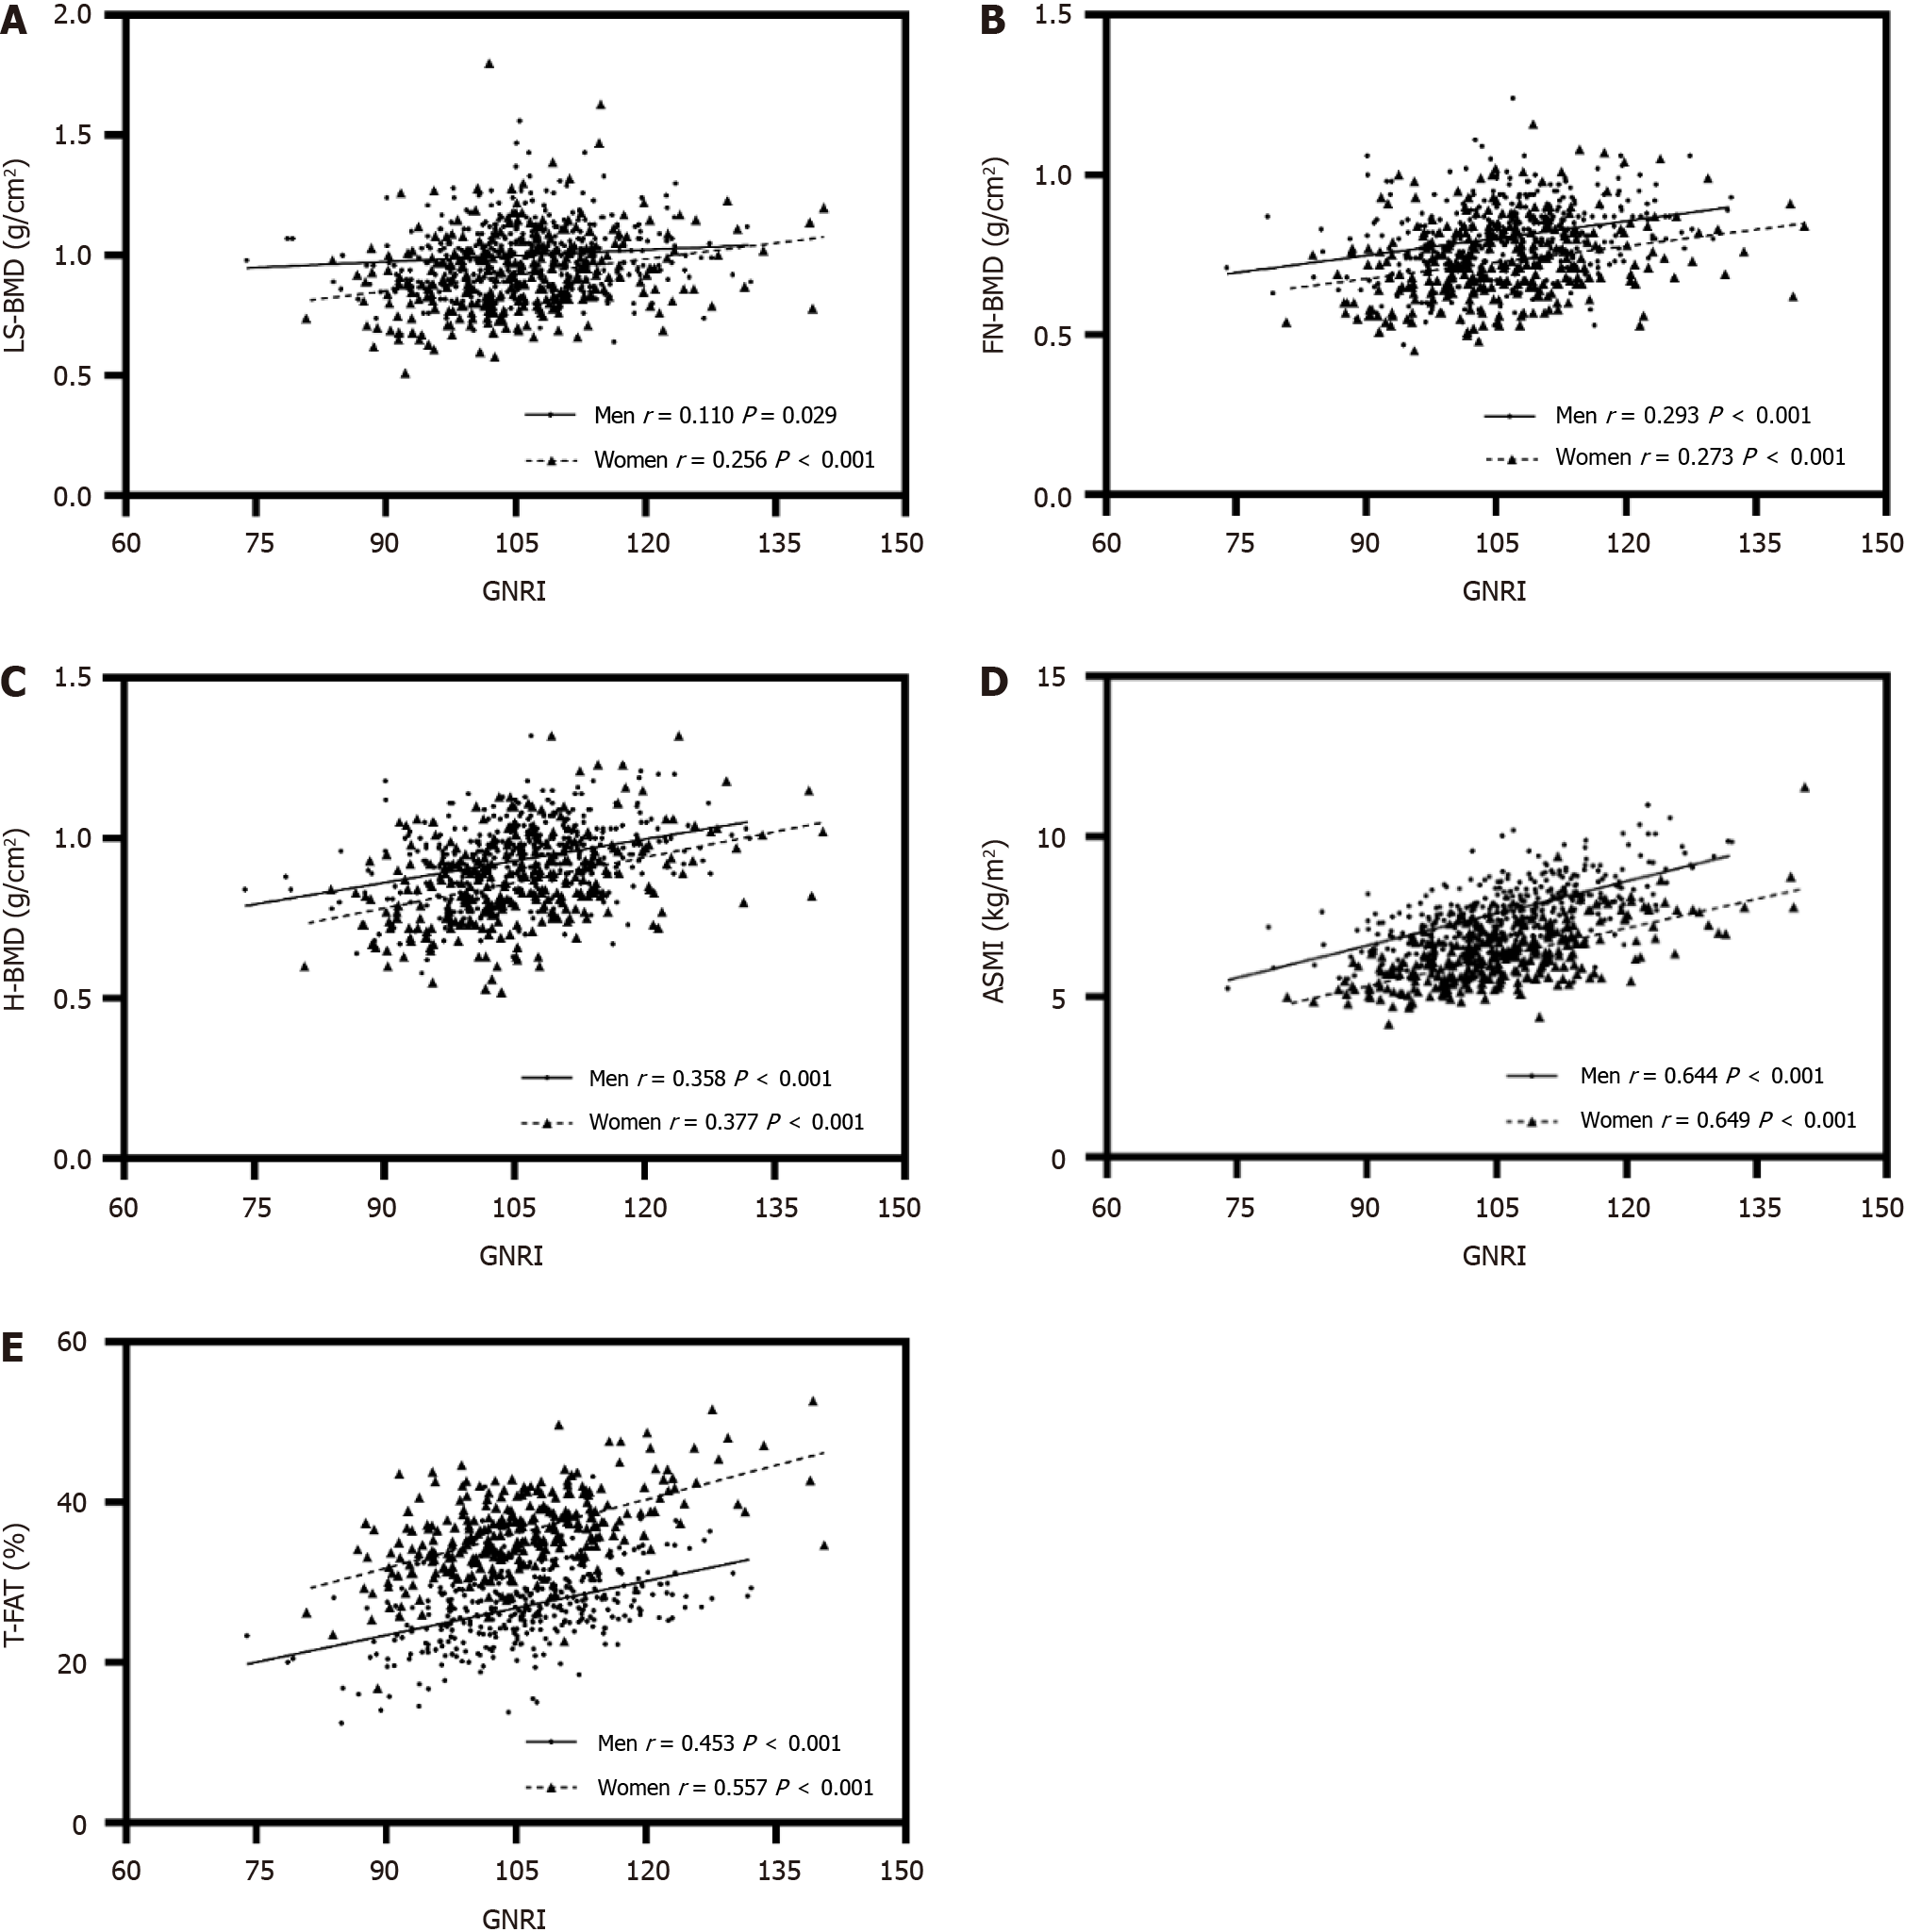
Figure 1 Scatter diagrams showing the correlation between Geriatric Nutritional Risk Index, bone mineral density, total body fat and appendicular skeletal muscle index.
A: Lumbar spine (L1-L4) bone mineral density (BMD); B: Femoral neck BMD; C: Hip BMD; D: Appendicular skeletal muscle index; E: Total (whole-body) BMD. BMD: Bone mineral density; GNRI: Geriatric Nutritional Risk Index; LS-BMD: Lumbar spine (L1-L4) bone mineral density; FN-BMD: Femoral neck bone mineral density; H-BMD: Hip bone mineral density; T-FAT: Total body fat.
- Citation: Zhu XX, Yao KF, Huang HY, Wang LH. Associations between Geriatric Nutrition Risk Index, bone mineral density and body composition in type 2 diabetes patients. World J Diabetes 2024; 15(3): 403-417
- URL: https://www.wjgnet.com/1948-9358/full/v15/i3/403.htm
- DOI: https://dx.doi.org/10.4239/wjd.v15.i3.403


