Copyright
©The Author(s) 2024.
World J Diabetes. Oct 15, 2024; 15(10): 2123-2134
Published online Oct 15, 2024. doi: 10.4239/wjd.v15.i10.2123
Published online Oct 15, 2024. doi: 10.4239/wjd.v15.i10.2123
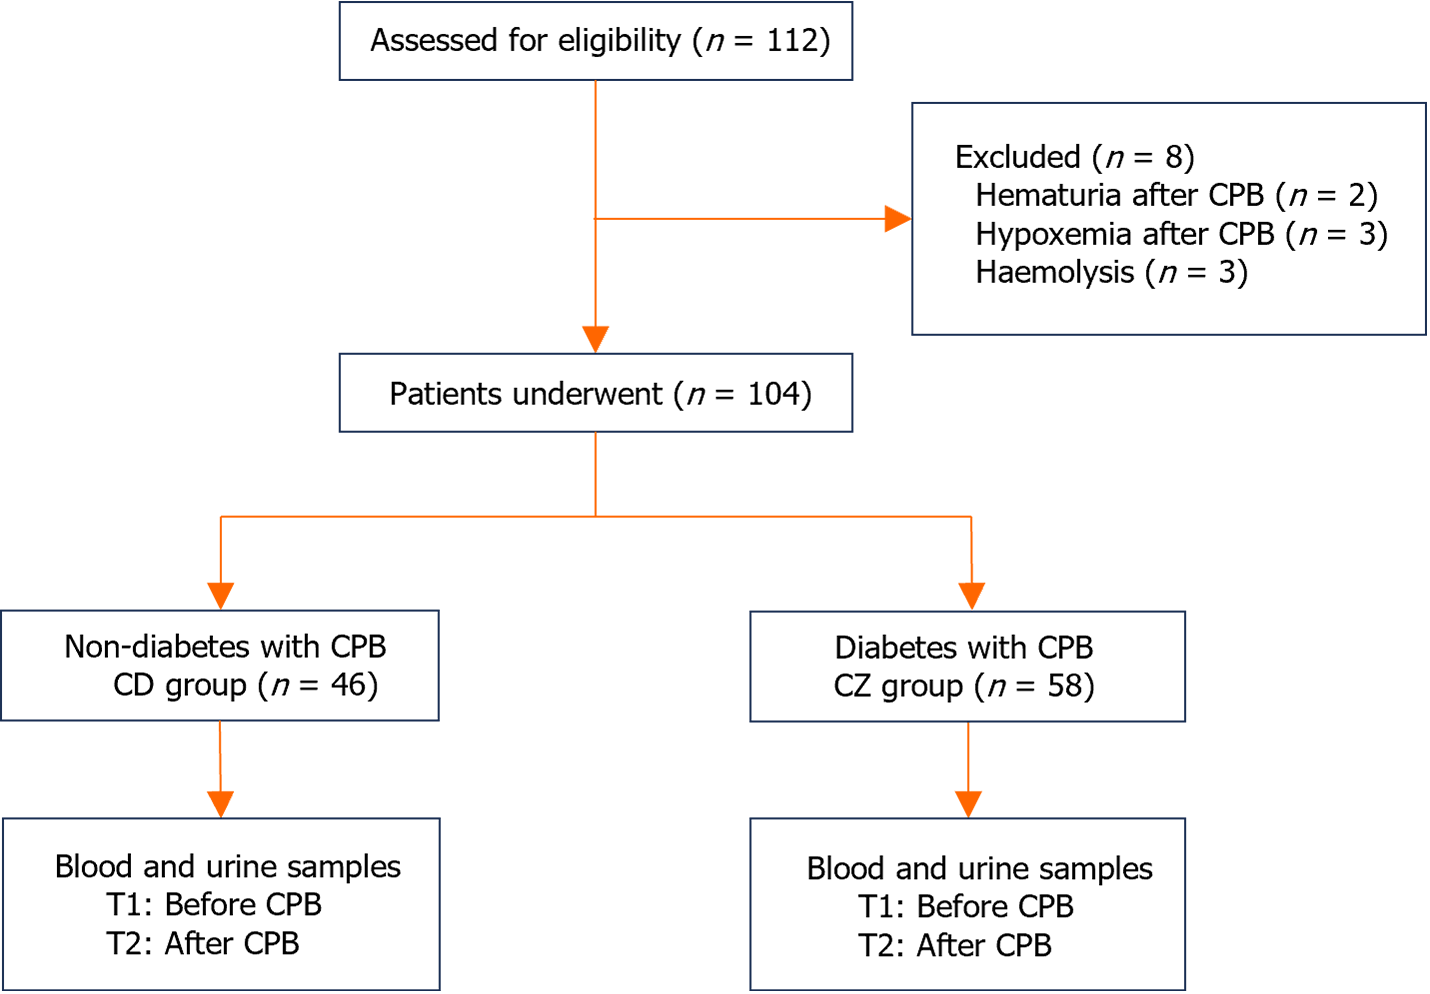
Figure 1 Patient recruitment flowchart.
CPB: Cardiopulmonary bypass; CD group: Non-diabetic patients; CZ group: Diabetic patients.
Figure 2 Experimental flow.
STZ: Streptozotocin; CPB: Cardiopulmonary bypass; TEM: Transmission electron microscopy; WB: Western blotting.
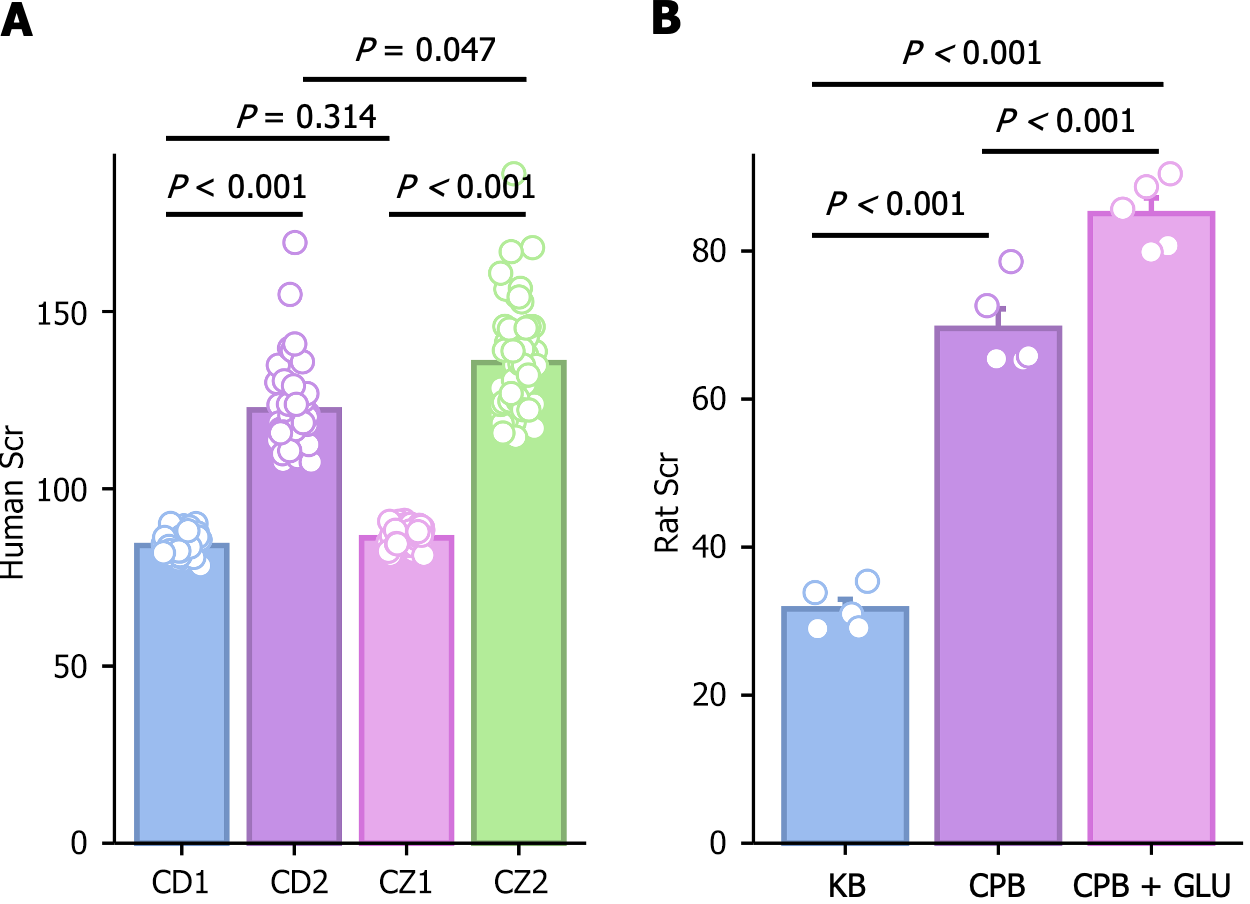
Figure 3 Serum creatinine levels (μmol/L) in different groups.
A: Serum creatinine in rats; B: Serum creatinine in patients. P < 0.05 indicates statistical significance. CD: Non-diabetic patients; CZ: Diabetic patients; KB: Control group; CPB: Cardiopulmonary bypass; Glu: Glucose; Scr: Creatinine.
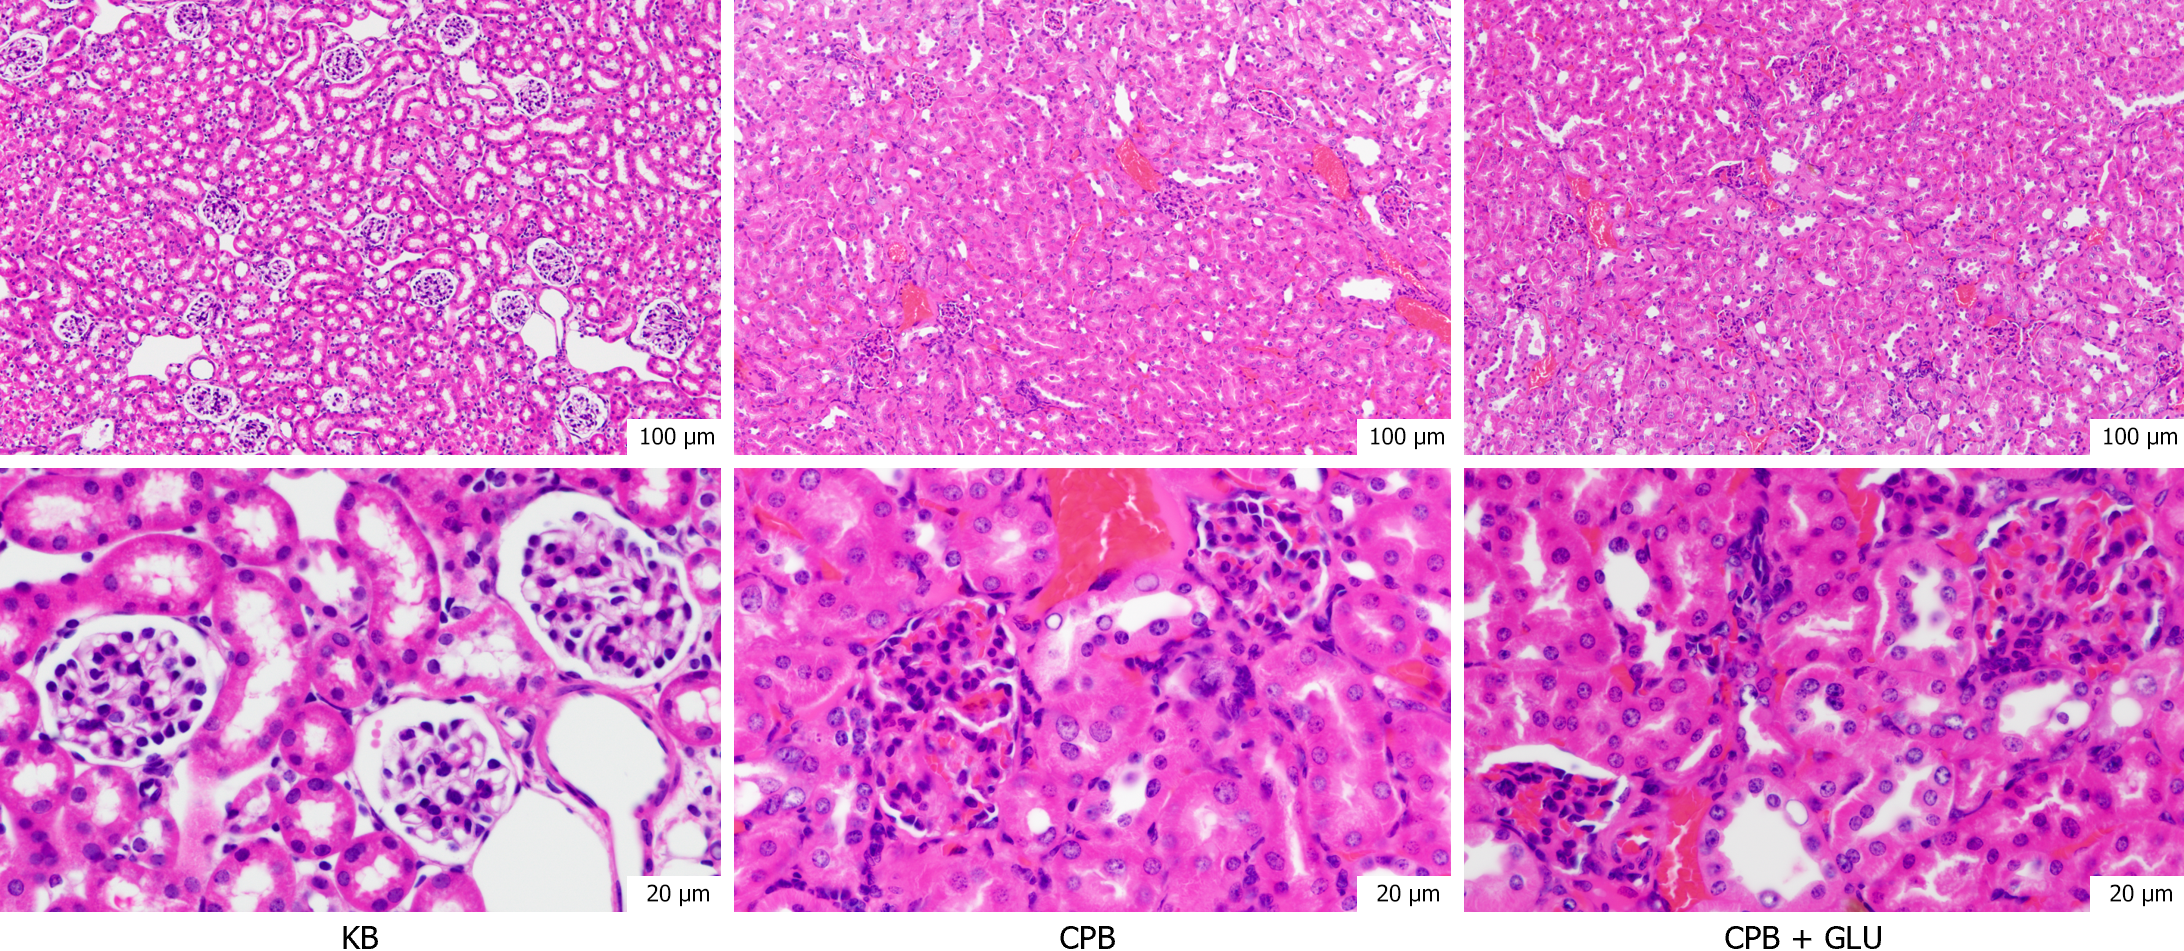
Figure 4 Hematoxylin-eosin staining in renal tissue of rats in each group.
KB: Control group; CPB: Cardiopulmonary bypass; Glu: Glucose.
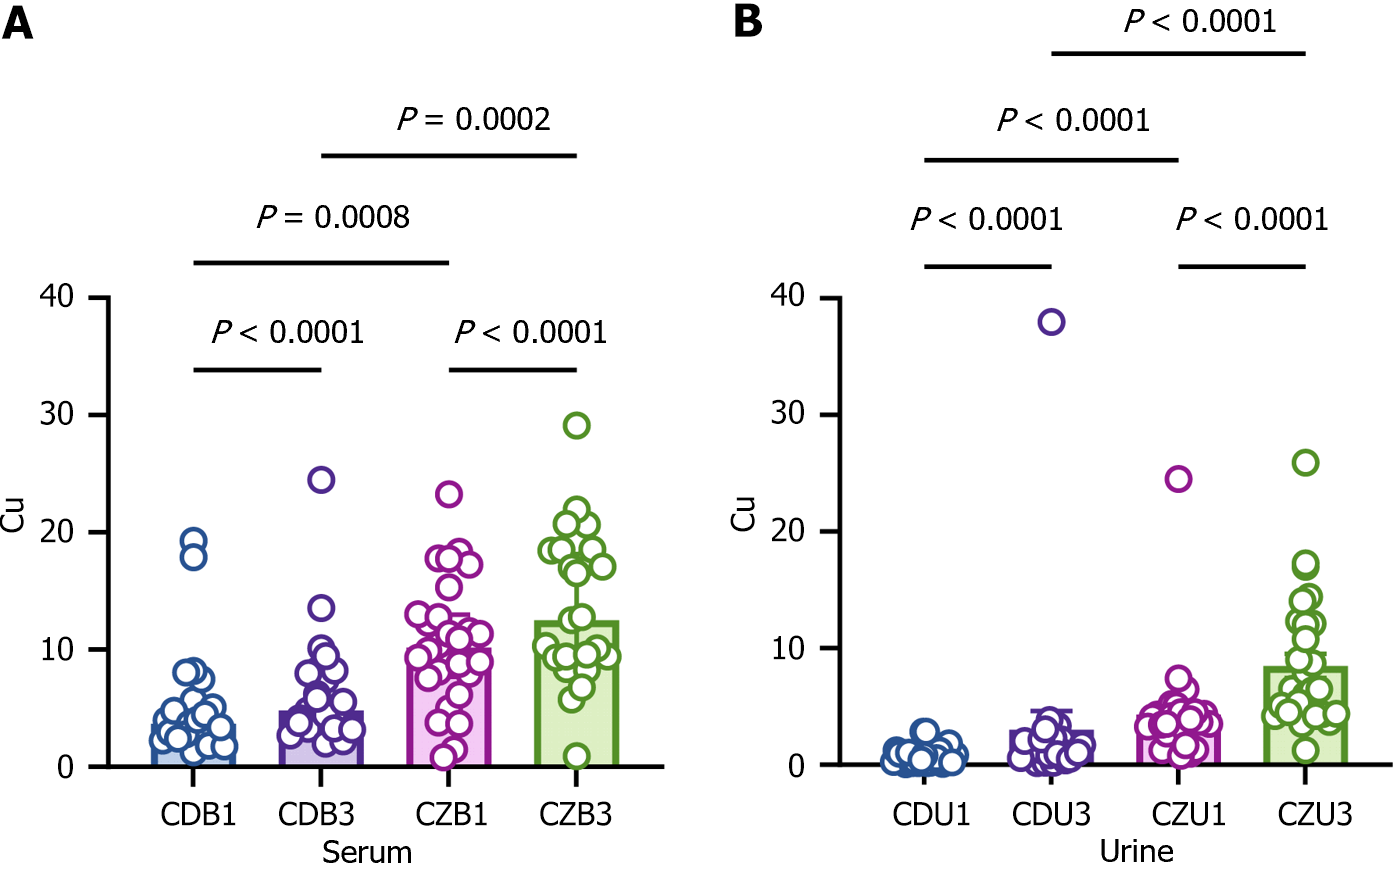
Figure 5 Comparison of copper ion levels between diabetic and non-diabetic patients.
A: Copper ion levels in serum; B: Copper ion levels in urine. In two group, copper levels were significantly elevated in after cardiopulmonary bypass (CPB). But in diabetic patients, copper levels had significantly higher after CPB. Cu: Copper ion; CDB1 and CDU1: Patients without diabetes before cardiopulmonary bypass; CDB3 and CDU3: Patients without diabetes after cardiopulmonary bypass; CZB1 and CZU1: Patients with diabetes before cardiopulmonary bypass; CZB3 and CZU3: Patients with diabetes after cardiopulmonary bypass.
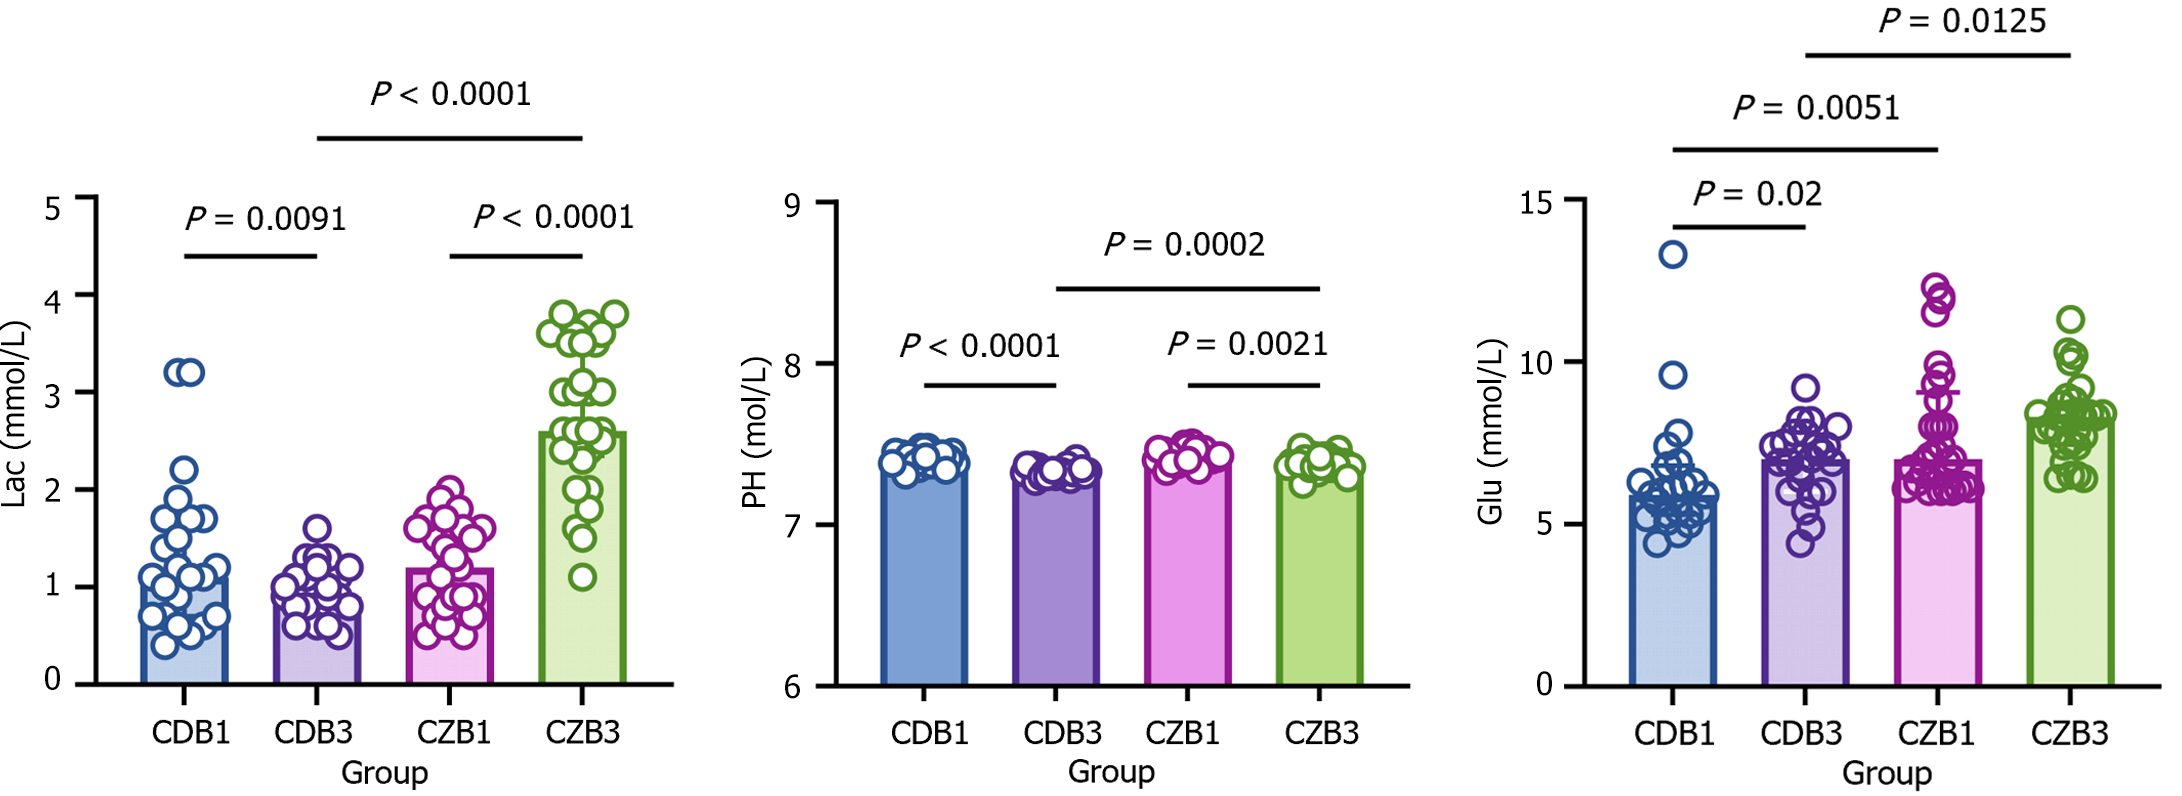
Figure 6 Serum expressions of serum lactic acid, potential of hydrogen, and glucose in diabetic and non-diabetic patients.
In two group, potential of hydrogen (PH), lactic acid (Lac) and glucose were significantly elevated in after cardiopulmonary bypass (CPB). But in diabetic patients, PH, Lac and glucose had significantly higher after CPB. Lac: Lactic acid; PH: Potential of hydrogen; Glu: Glucose; CDB1: Patients without diabetes before cardiopulmonary bypass; CDB3: Patients without diabetes after cardiopulmonary bypass; CZB1: Patients with diabetes before cardiopulmonary bypass; CZB3: Patients with diabetes after cardiopulmonary bypass.
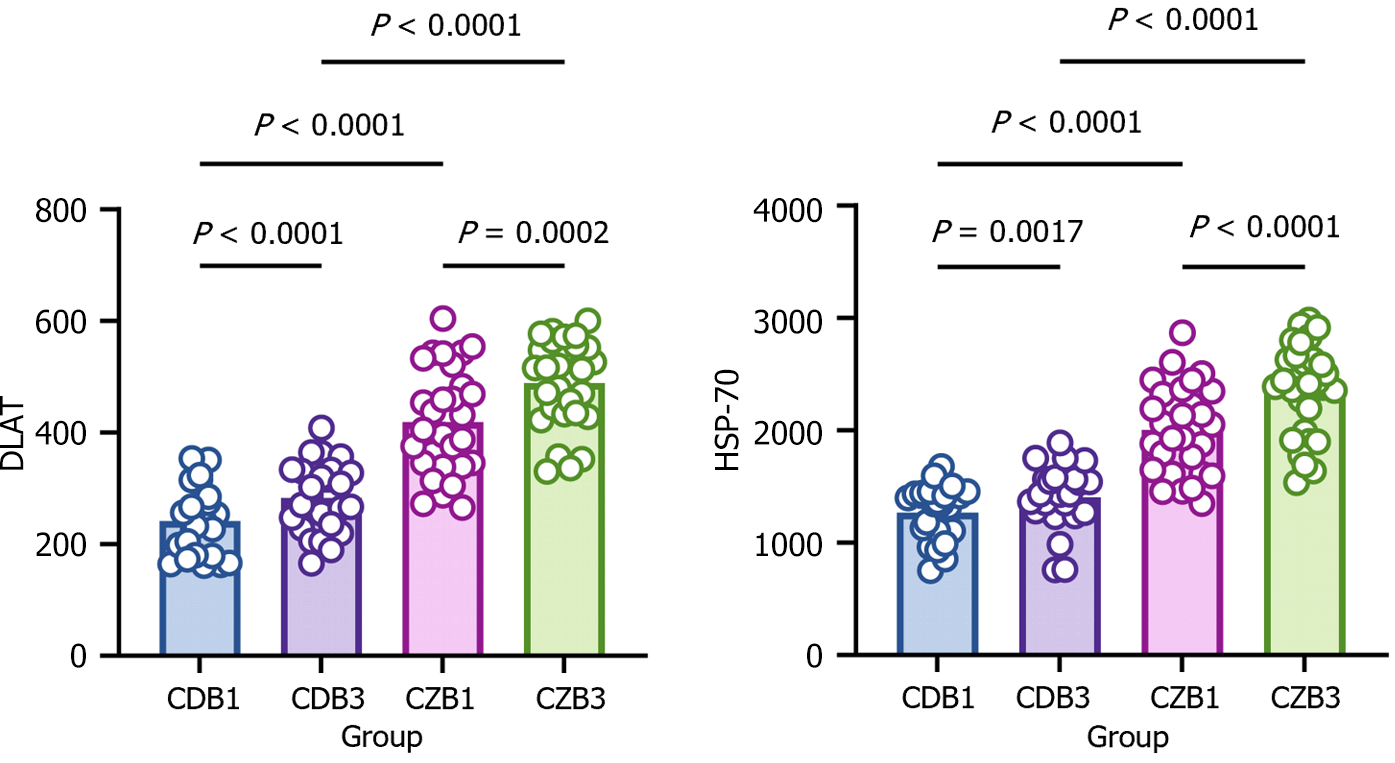
Figure 7 Serum expressions of dihydrolipoamide dehydrogenase and heat shock protein-70 in diabetic and non-diabetic patients.
In two group, dihydrolipoamide dehydrogenase (DLAT) and heat shock protein-70 (HSP-70) were significantly elevated in after cardiopulmonary bypass (CPB). But in diabetic patients, DLAT and HSP-70 had significantly higher after CPB. DLAT: Dihydrolipoamide dehydrogenase; HSP-70: Heat shock protein-70; CDB1: Patients without diabetes before cardiopulmonary bypass; CDB3: Patients without diabetes after cardiopulmonary bypass; CZB1: Patients with diabetes before cardiopulmonary bypass; CZB3: Patients with diabetes after cardiopulmonary bypass.
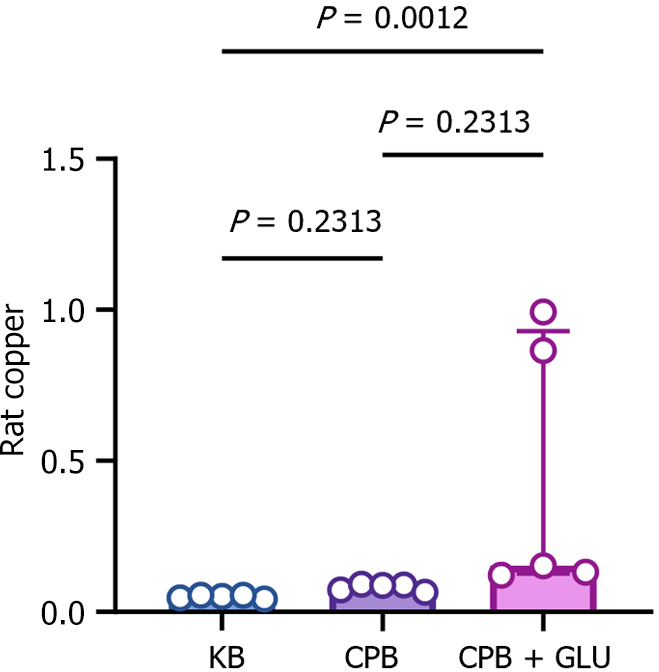
Figure 8 Expression level of copper ions in renal tissue of diabetic and non-diabetic rats.
Copper was significantly increased in kidney tissues of diabetic rats after cardiopulmonary bypass (CPB) compared with the CPB and control groups. KB: Control group; CPB: Cardiopulmonary bypass; Glu: Glucose.
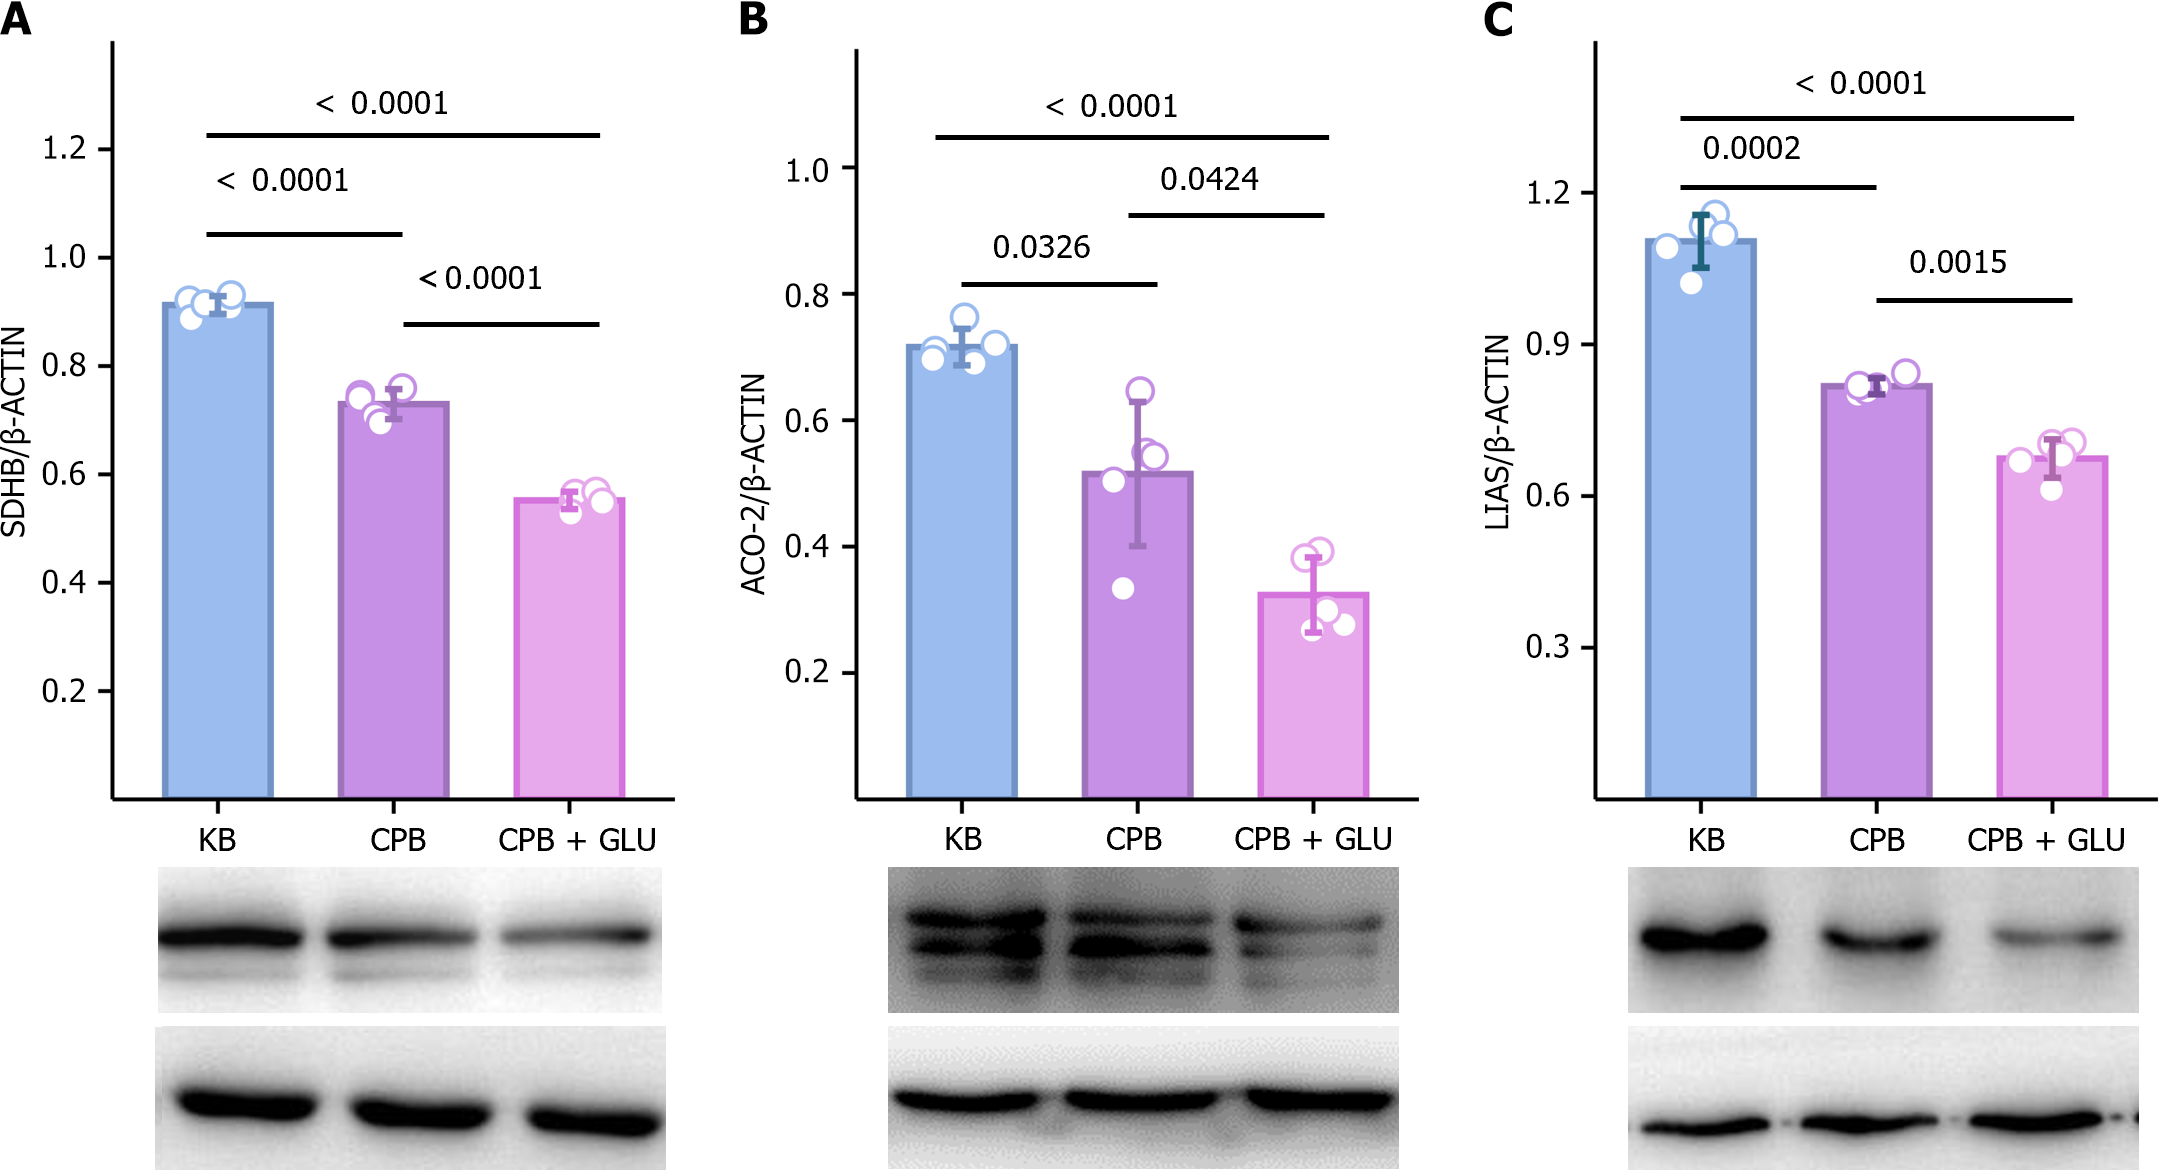
Figure 9 Expression of iron-sulfur cluster proteins in diabetic and non-diabetic rats.
Cuproptosis-related proteins, including lipoic acid synthase, aconitase 2 and succinate dehydrogenase, were significantly decreased in renal tissues of diabetic rats after cardiopulmonary bypass. SDHB: Succinate dehydrogenase; ACO-2: Aconitase 2; LIAS: Lipoic acid synthase; KB: Control group; CPB: Cardiopulmonary bypass; Glu: Glucose.
Figure 10 Transmission electron microscopy of rat mitochondria.
A: In the control group, the mitochondrial envelope is intact and the cristae structure is clear; B: In the cardiopulmonary bypass (CPB) group, a small portion of cells showed mitochondrial damage; C: In the CPB + glucose group, most of the cells donated were damaged, contents had been released, and the crest was broken.
- Citation: Deng XJ, Wang YN, Lv CB, Qiu ZZ, Zhu LX, Shi JH, Sana SRGL. Effect of cuproptosis on acute kidney injury after cardiopulmonary bypass in diabetic patients. World J Diabetes 2024; 15(10): 2123-2134
- URL: https://www.wjgnet.com/1948-9358/full/v15/i10/2123.htm
- DOI: https://dx.doi.org/10.4239/wjd.v15.i10.2123


