Copyright
©The Author(s) 2024.
World J Diabetes. Oct 15, 2024; 15(10): 2111-2122
Published online Oct 15, 2024. doi: 10.4239/wjd.v15.i10.2111
Published online Oct 15, 2024. doi: 10.4239/wjd.v15.i10.2111
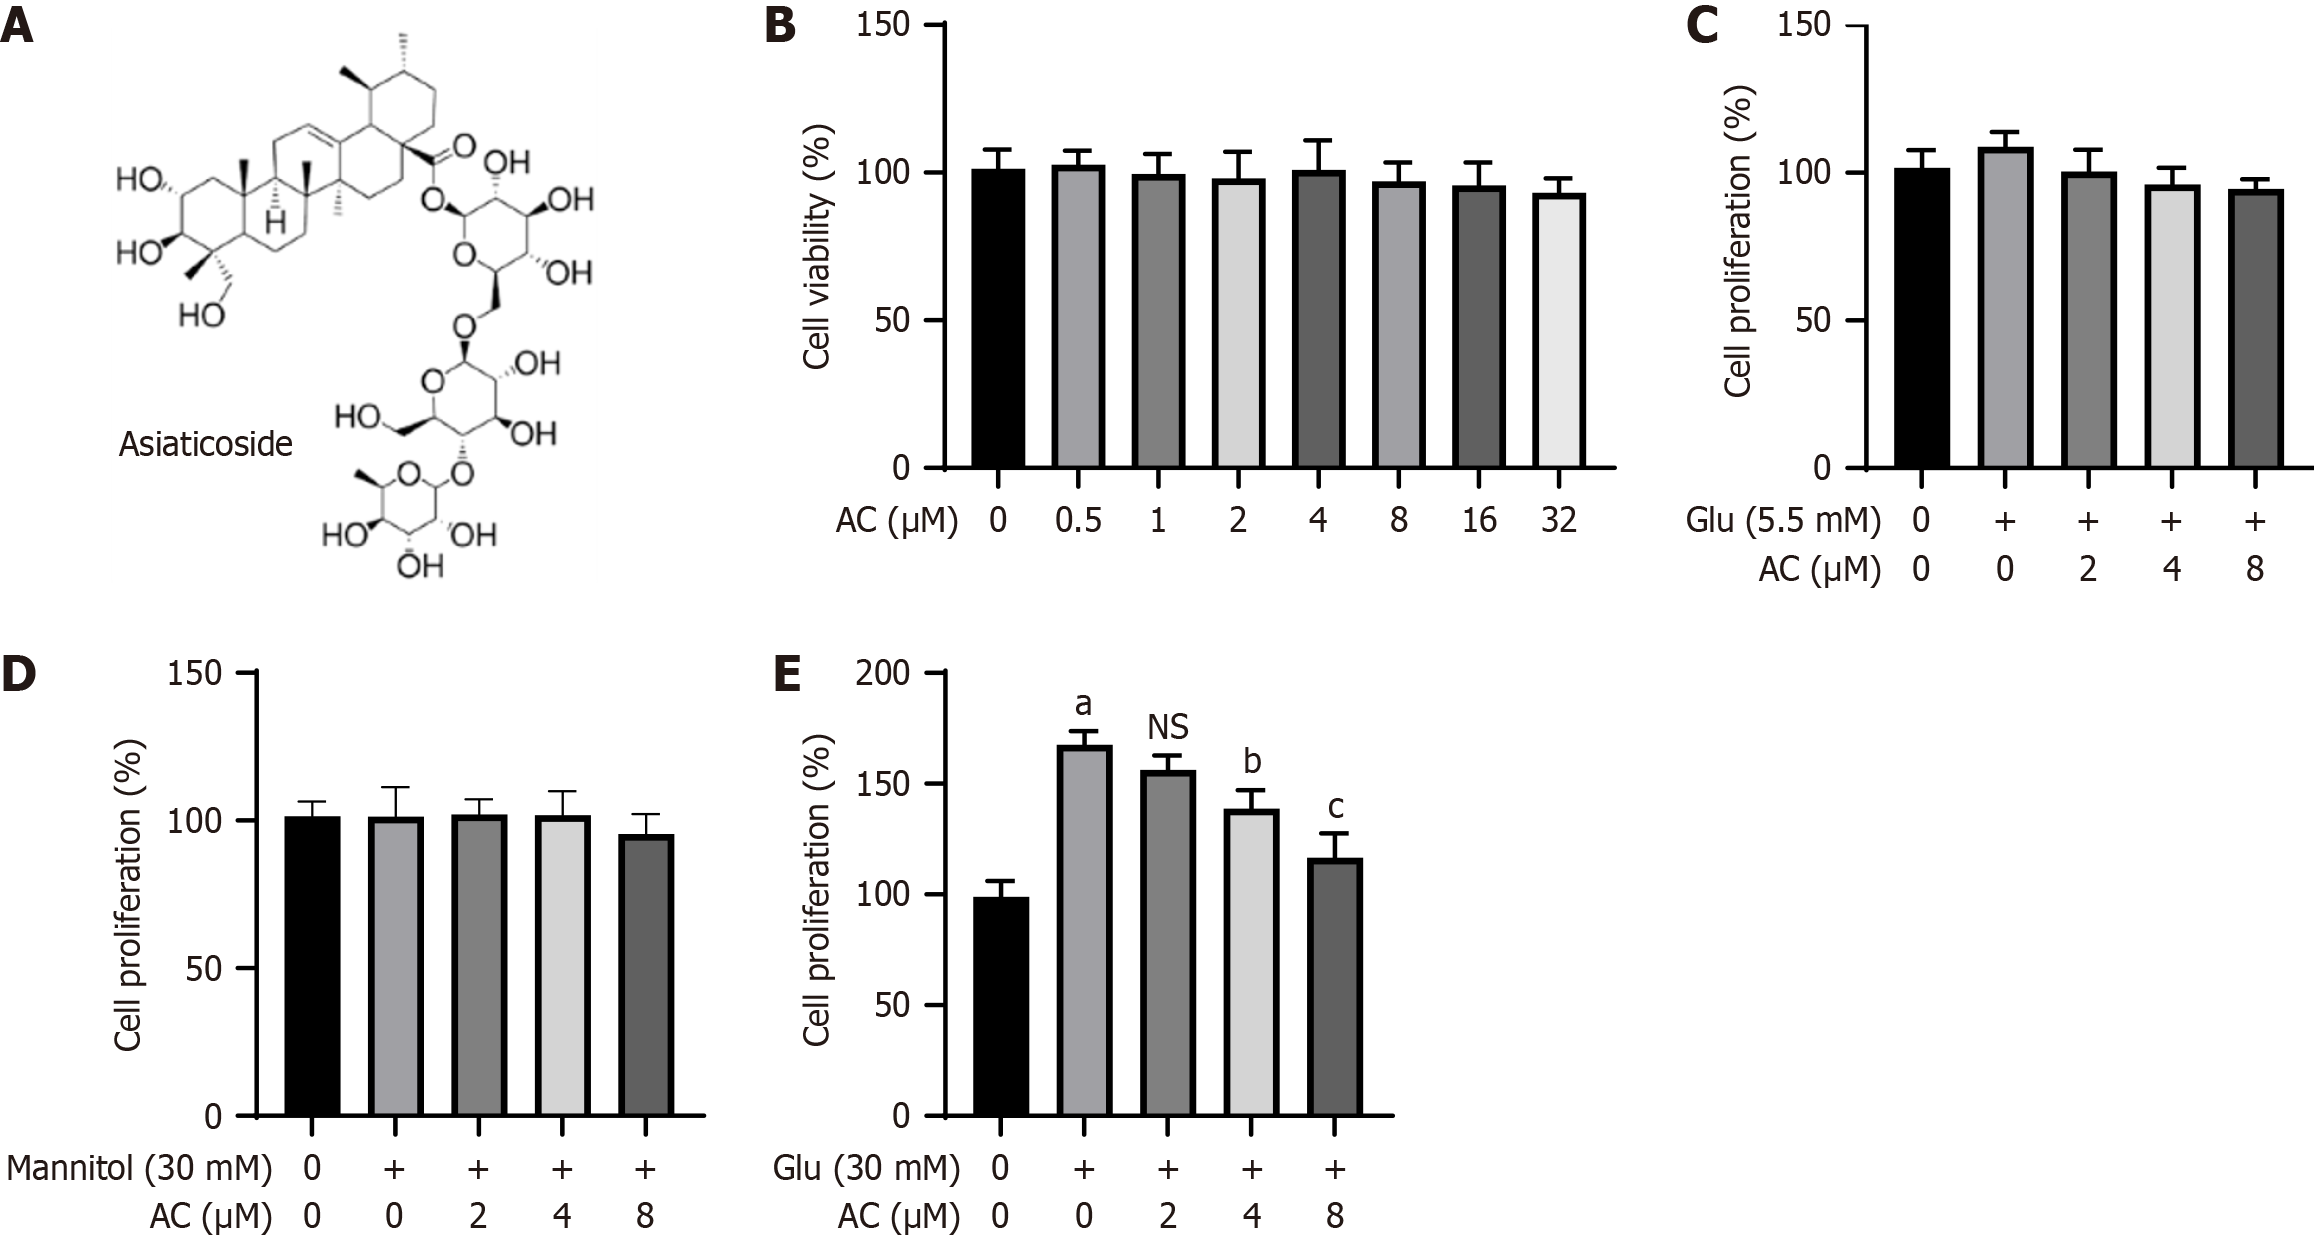
Figure 1 Effect of asiaticoside on high glucose-induced proliferation of rat glomerular mesangial cells.
A: Chemical structure of asiaticoside (AC); B: Viability of rat glomerular mesangial cells (HBZY-1) treated with AC at different concentrations (0, 0.5, 1.0, 2.0, 4.0, 8.0, 16.0, and 32.0 μM) for 24 h detected by Cell Counting Kit-8 (CCK-8) assay; C: Proliferation levels of HBZY-1 cells after co-treatment of AC at different concentrations (0, 2, 4, and 8 μM) and glucose (5.5 mmol/L) for 48 h detected by CCK-8 assay; D: Proliferation of HBZY-1 cells after co-treatment of AC treatment at different concentrations (0, 2, 4, and 8 μM) and mannitol (30 mmol/L) detected by CCK-8 assay; E: Proliferation of HBZY-1 cells treated with AC at different concentrations (0, 2, 4, and 8 μM) and glucose (30 mmol/L) detected by CCK-8 assay. n = 3 experiments. aP < 0.001 vs control, bP < 0.01, and cP < 0.001 vs (Glu, 30 mmol/L + AC, 0 µM); not significant (P > 0.05) vs (Glu, 30 mmol/L + AC 0 µM). AC: Asiaticoside; Glu: Glucose; NS: Not significant.
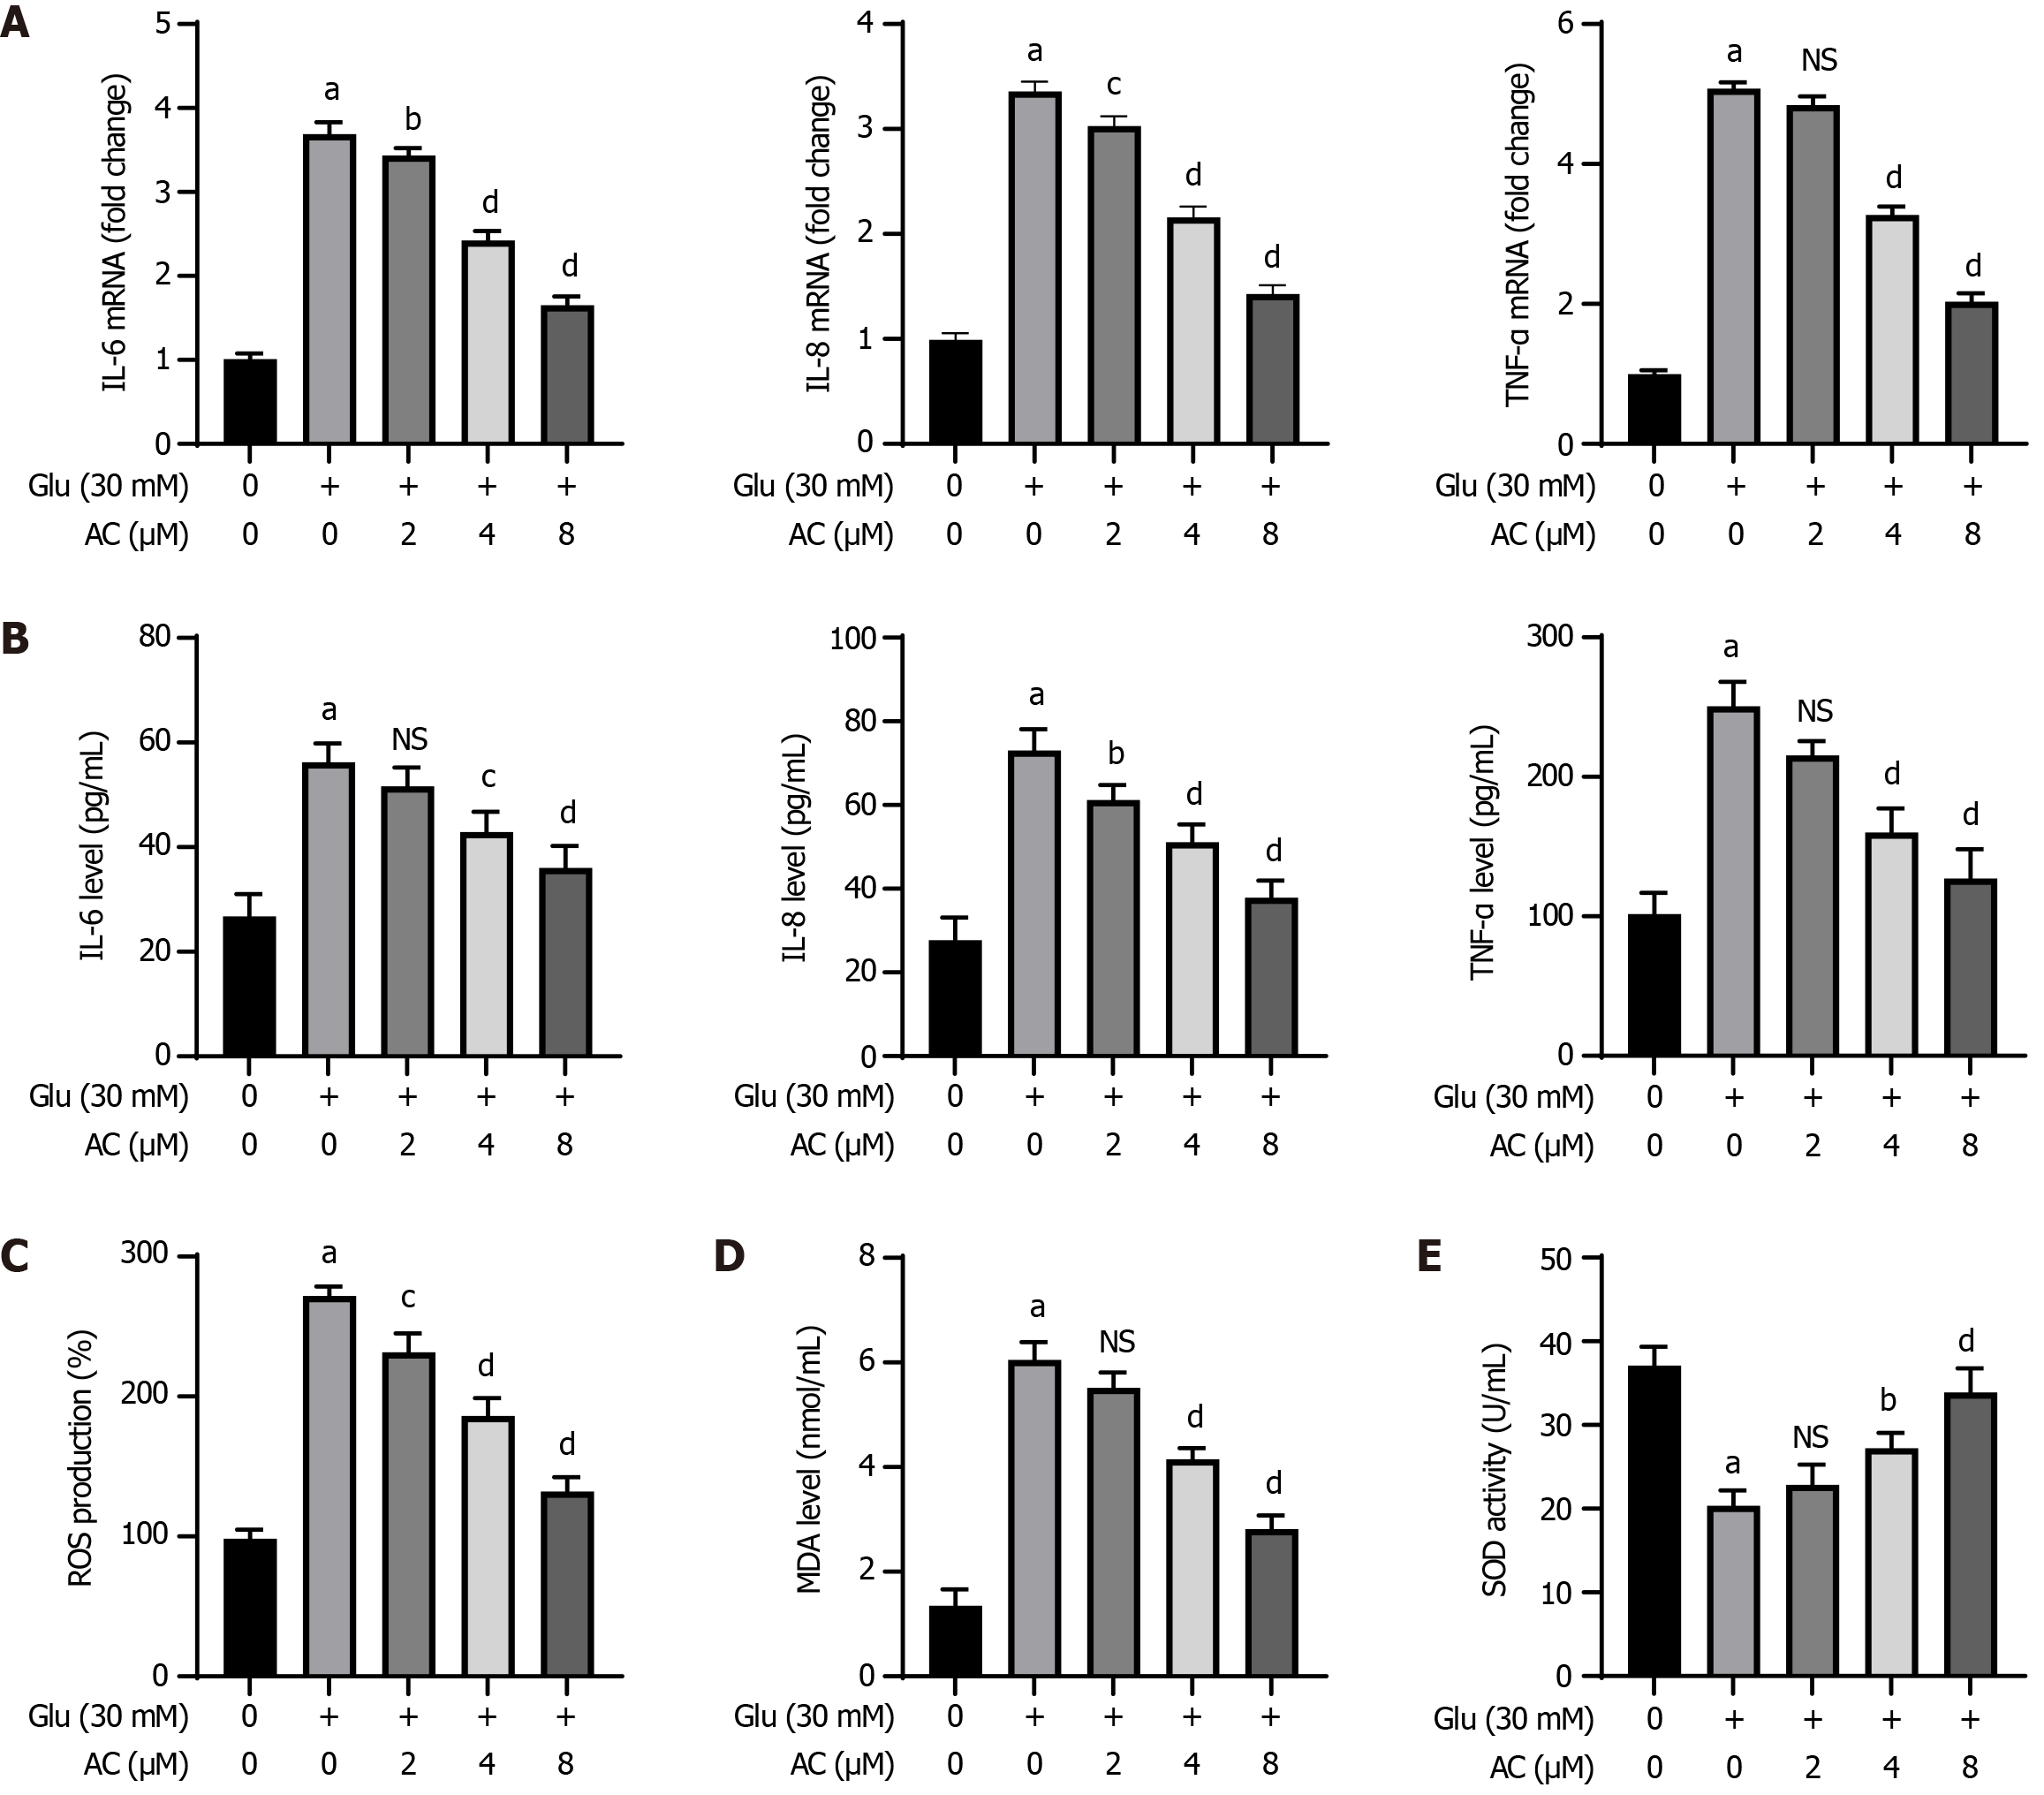
Figure 2 Effect of asiaticoside on high glucose-induced inflammatory response and oxidative stress in rat glomerular mesangial cells.
A: Quantitative real-time polymerase chain reaction analysis of the mRNA levels of interleukin (IL)-6, IL-8, and tumor necrosis factor (TNF)-α in rat glomerular mesangial (HBZY-1) cells treated with asiaticoside at different concentrations (0, 2, 4, and 8 μM) and glucose (30 mmol/L); B: IL-6, IL-8, and TNF-α in the supernatant of HBZY-1 cells determined by ELISA; C-E: Reactive oxygen species, malondialdehyde, and superoxide dismutase levels in HBZY-1 cells determined by ELISA using corresponding kits. n = 3 experiments. aP < 0.001 vs control, bP < 0.05, cP < 0.01, and dP < 0.001 (Glu, 30 mmol/L + AC, 0 µM); not significant (P > 0.05) vs (Glu, 30 mmol/L + AC 0 µM). AC: Asiaticoside; Glu: Glucose; NS: Not significant.
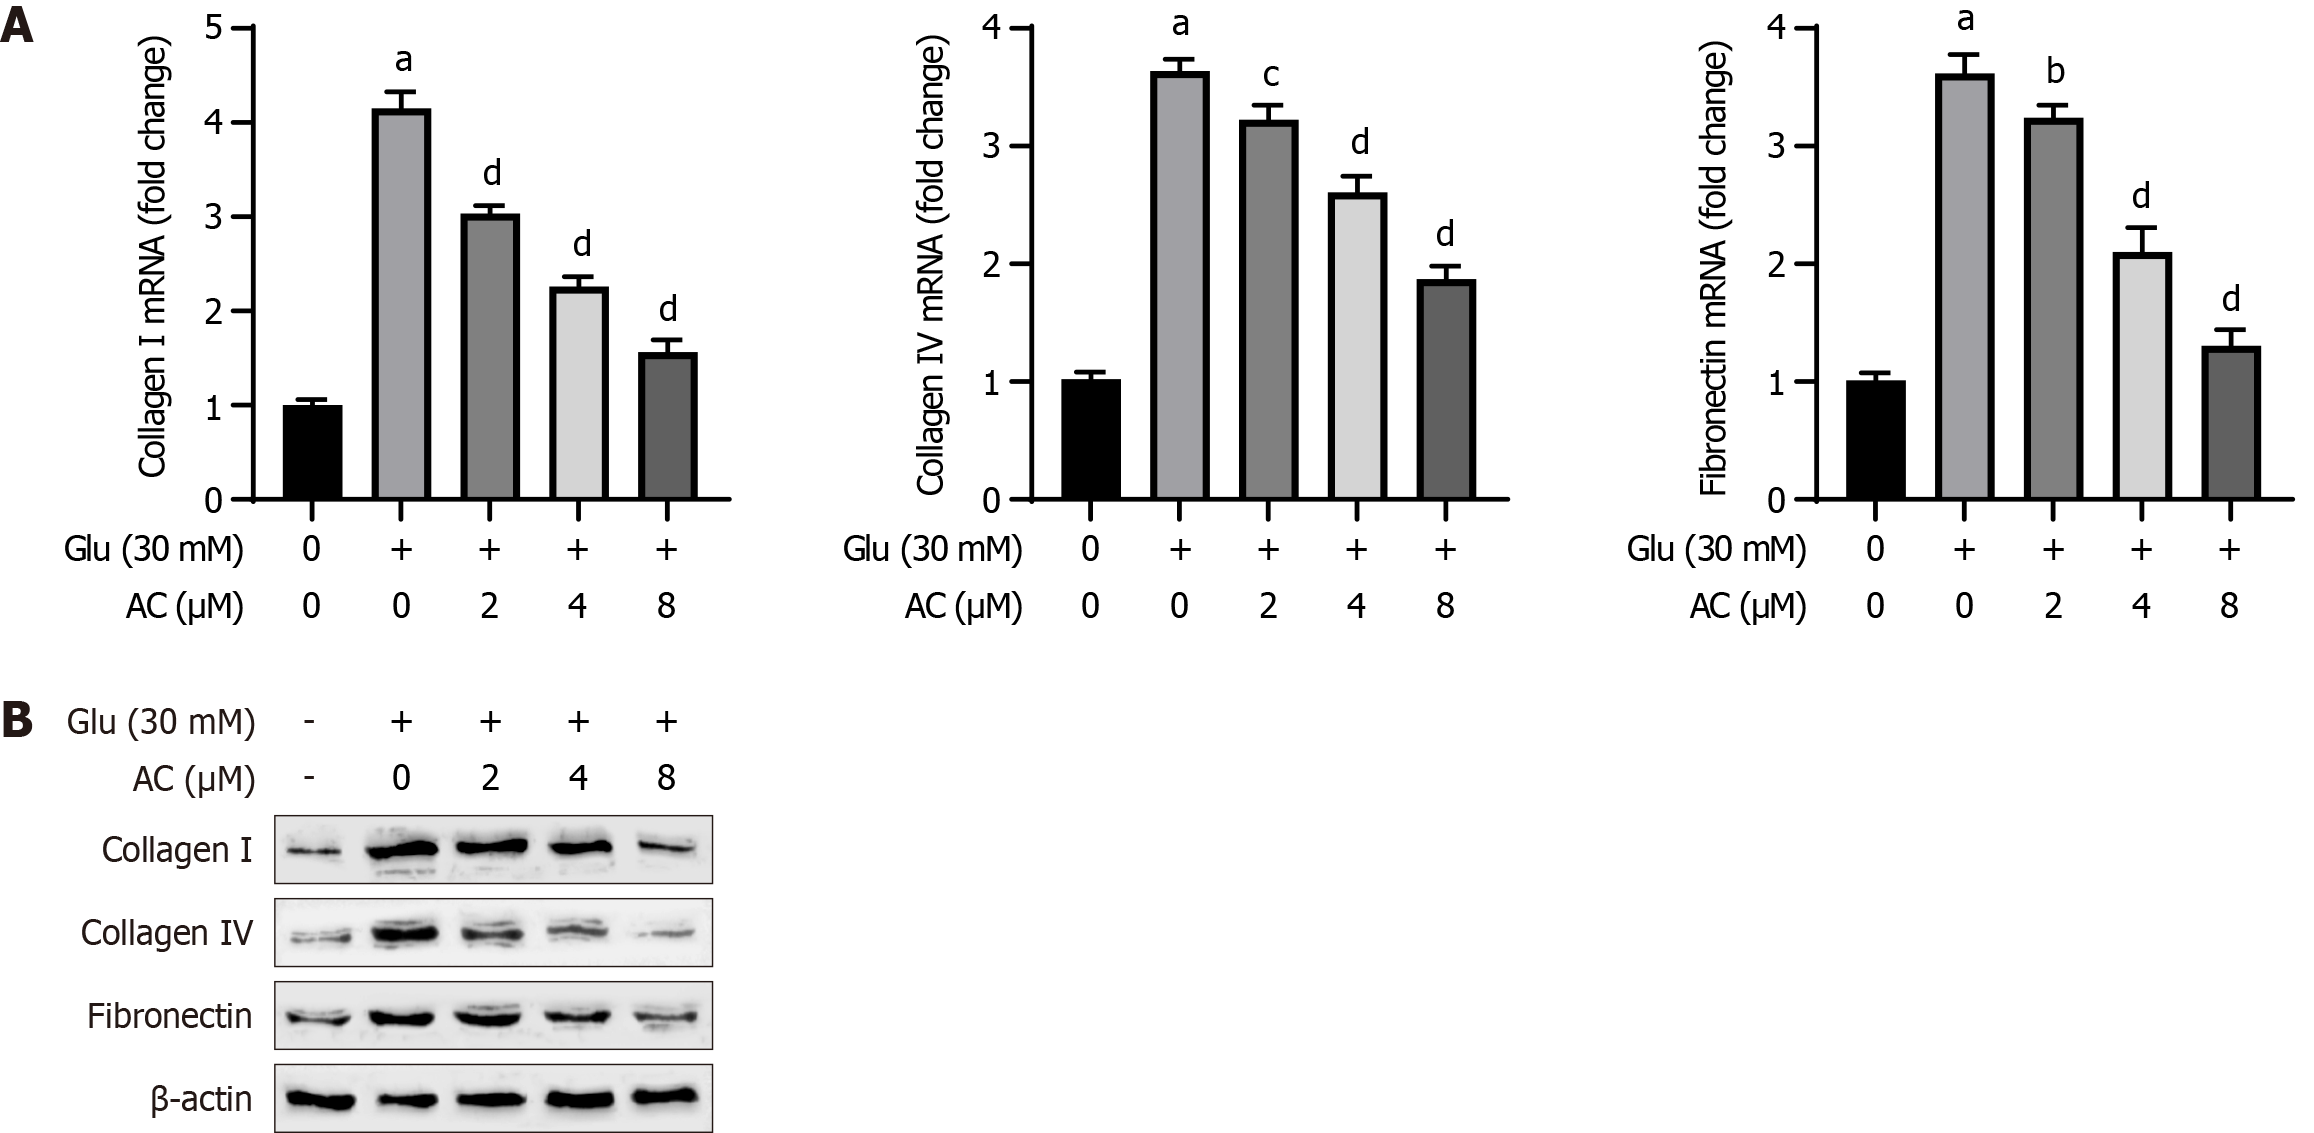
Figure 3 Effect of asiaticoside on high glucose-induced fibrosis in rat glomerular mesangial cells.
A:Quantitative real-time polymerase chain reaction analysis of the mRNA levels of collagen I, collagen IV, and fibronectin in rat glomerular mesangial (HBZY-1) cells treated with asiaticoside at different concentrations (0, 2, 4, and 8 μM) and glucose (30 mmol/L); B: Western blot analysis of the protein levels of collagen I, collagen IV, and fibronectin in HBZY-1 cells. n = 3 experiments. aP < 0.001 vs control; bP < 0.05, cP < 0.01, and dP < 0.001 vs Glu (30 mmol/L). AC: Asiaticoside; Glu: Glucose.
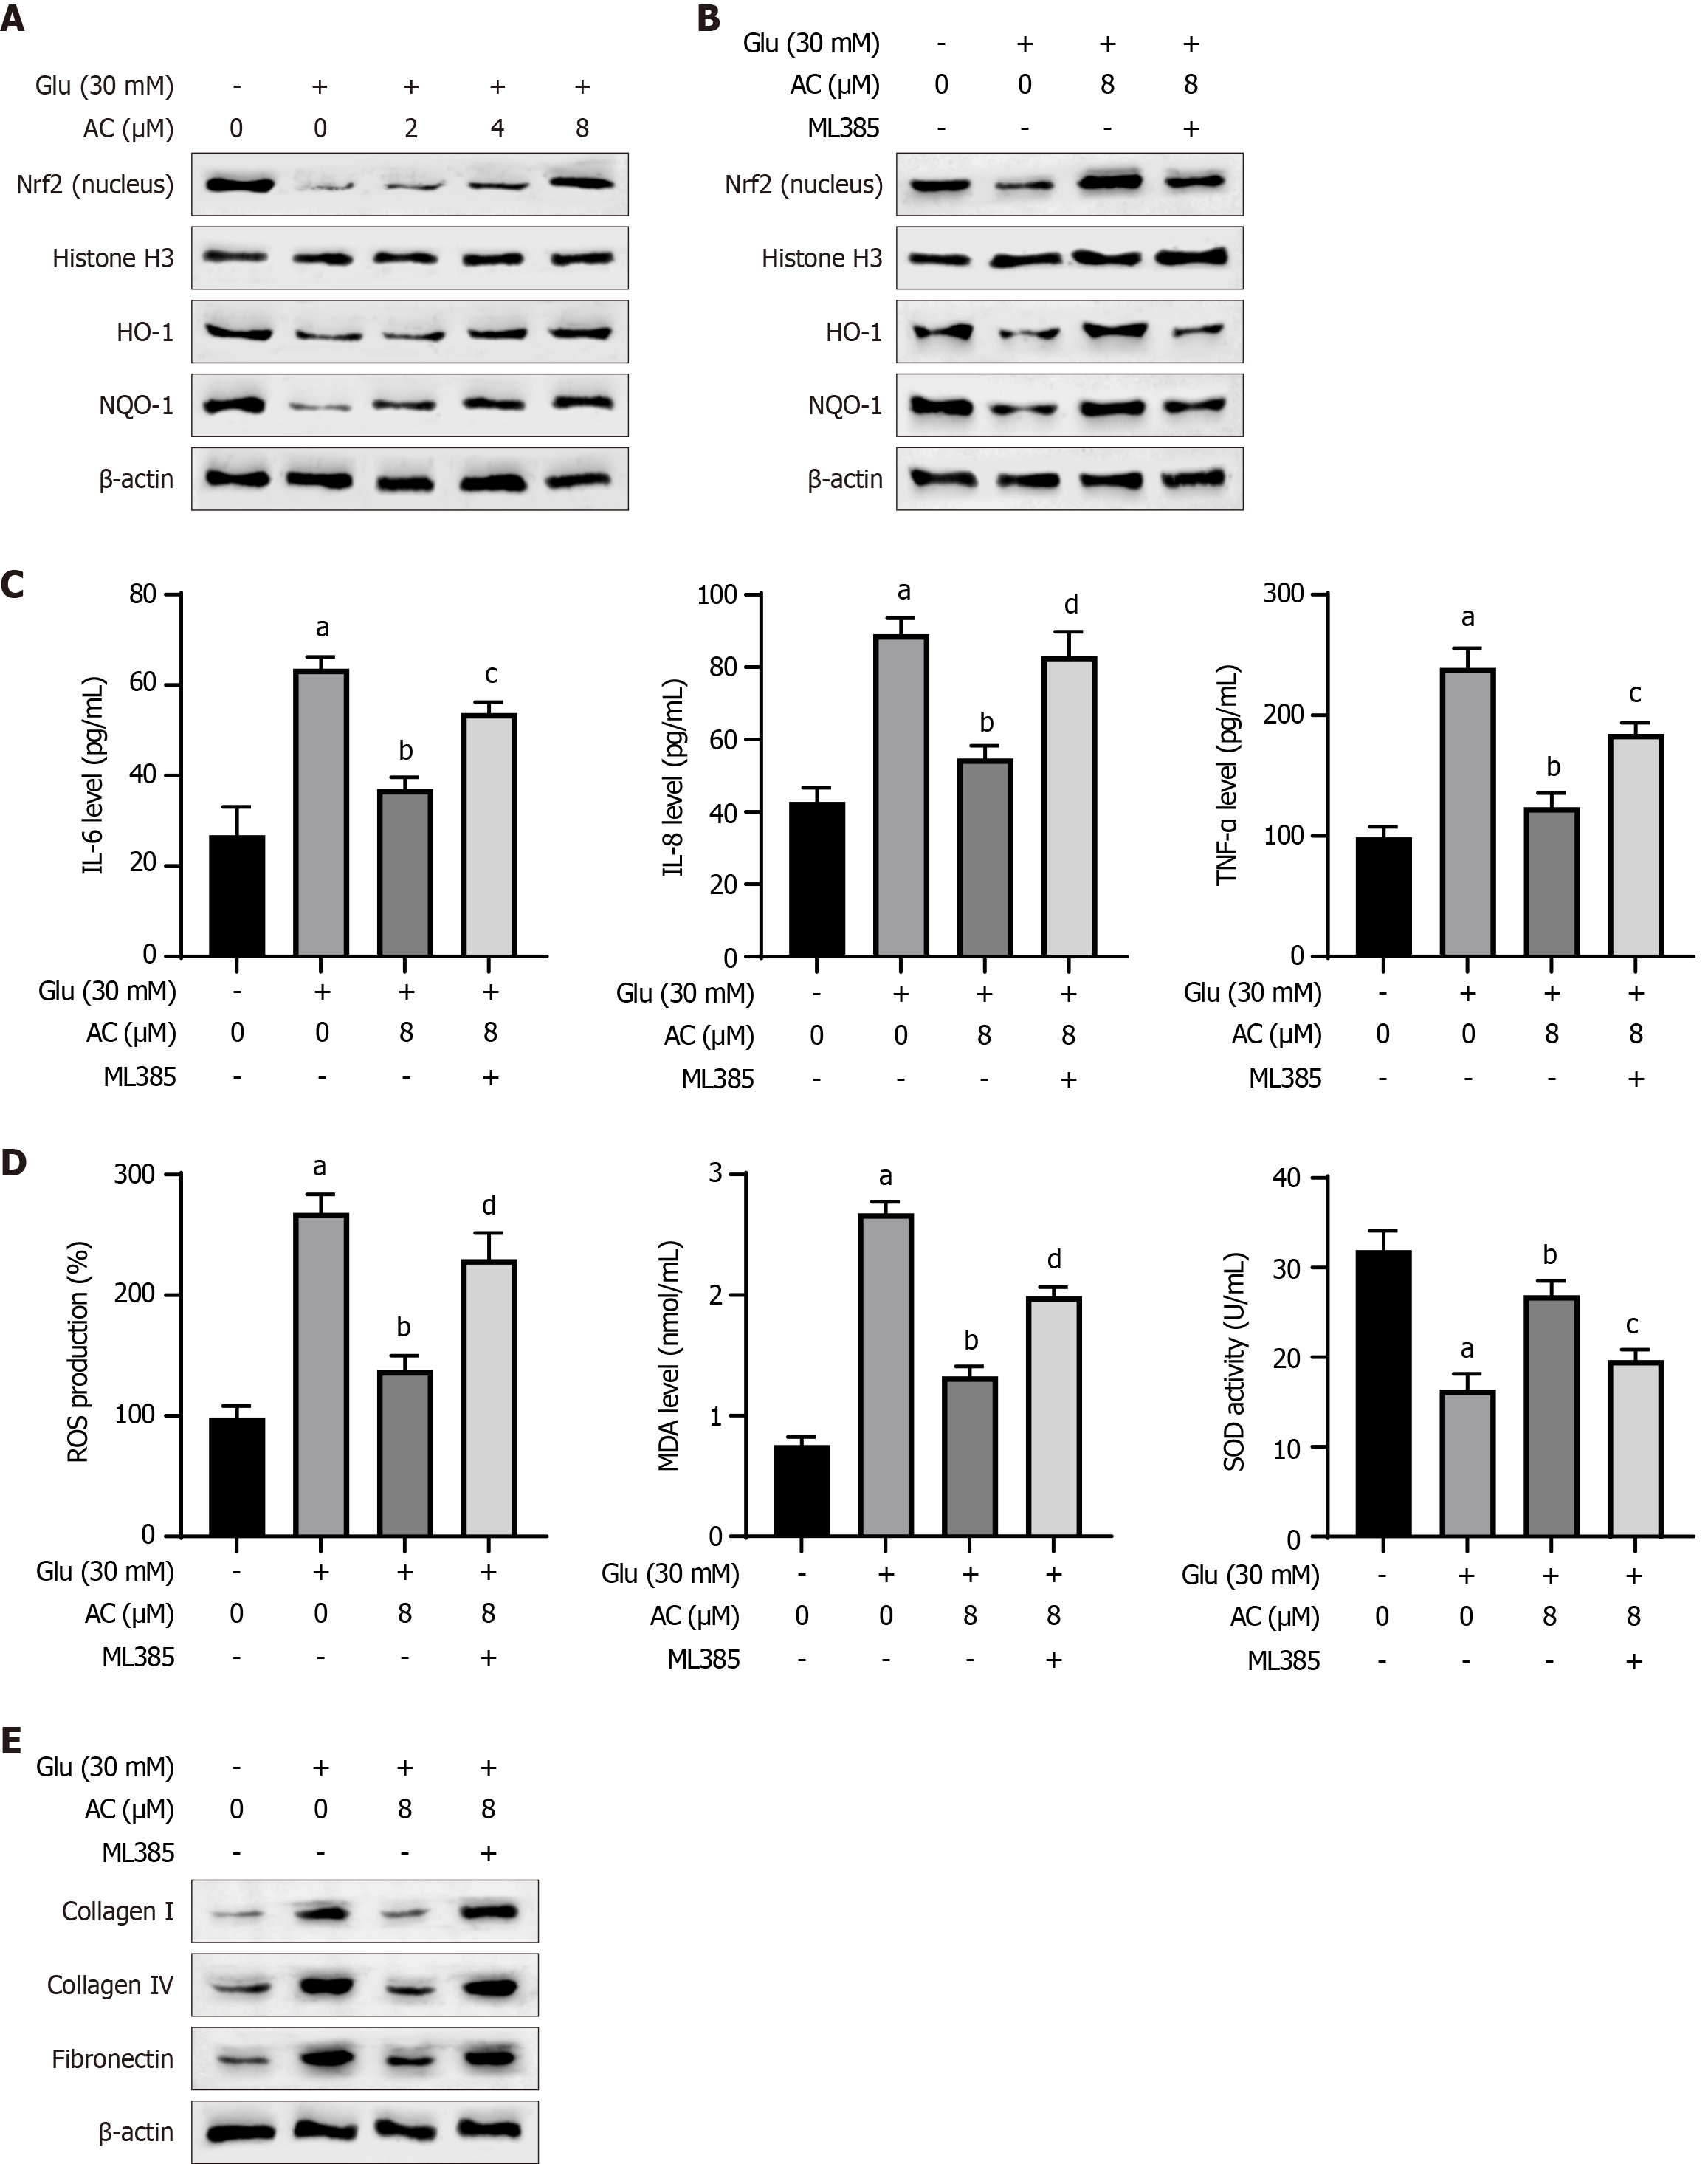
Figure 4 Asiaticoside regulates high glucose-induced effects on rat glomerular mesangial cells by activating the NRF2/ heme oxygenase-1 pathway.
A: Western blot analysis of the NRF2 protein expression and total heme oxygenase-1 (HO-1) and NAD(P)H dehydrogenase (Quinone) 1 (NQO-1) protein expression in the nucleus of rat glomerular mesangial (HBZY-1) cells treated with asiaticoside (AC) at different concentrations (0, 2, 4, and 8 μM) and glucose (30 mmol/L); B: Western blot analysis of NRF2 protein expression and total HO-1 and NQO-1 protein expression in the nucleus of HBZY-1 cells treated with AC (8 μM), glucose (30 mmol/L), and ML385 (NRF2 inhibitor, 5 μM); C: Interleukin (IL)-6, IL-8, and tumor necrosis factor-α levels in the supernatant of HBZY-1 cells; D: Reactive oxygen species, malondialdehyde, and superoxide dismutase in HBZY-1 cells; E: Western blot analysis of the expression levels of collagen I, collagen IV, fibronectin, and β-actin in HBZY-1 cells. n = 3 experiments. aP < 0.001 vs control, bP < 0.001 vs Glu (30 mmol/L), cP < 0.01, and dP < 0.001 vs Glu (30 mmol/L) + AC (8 μM). AC: Asiaticoside; Glu: Glucose.
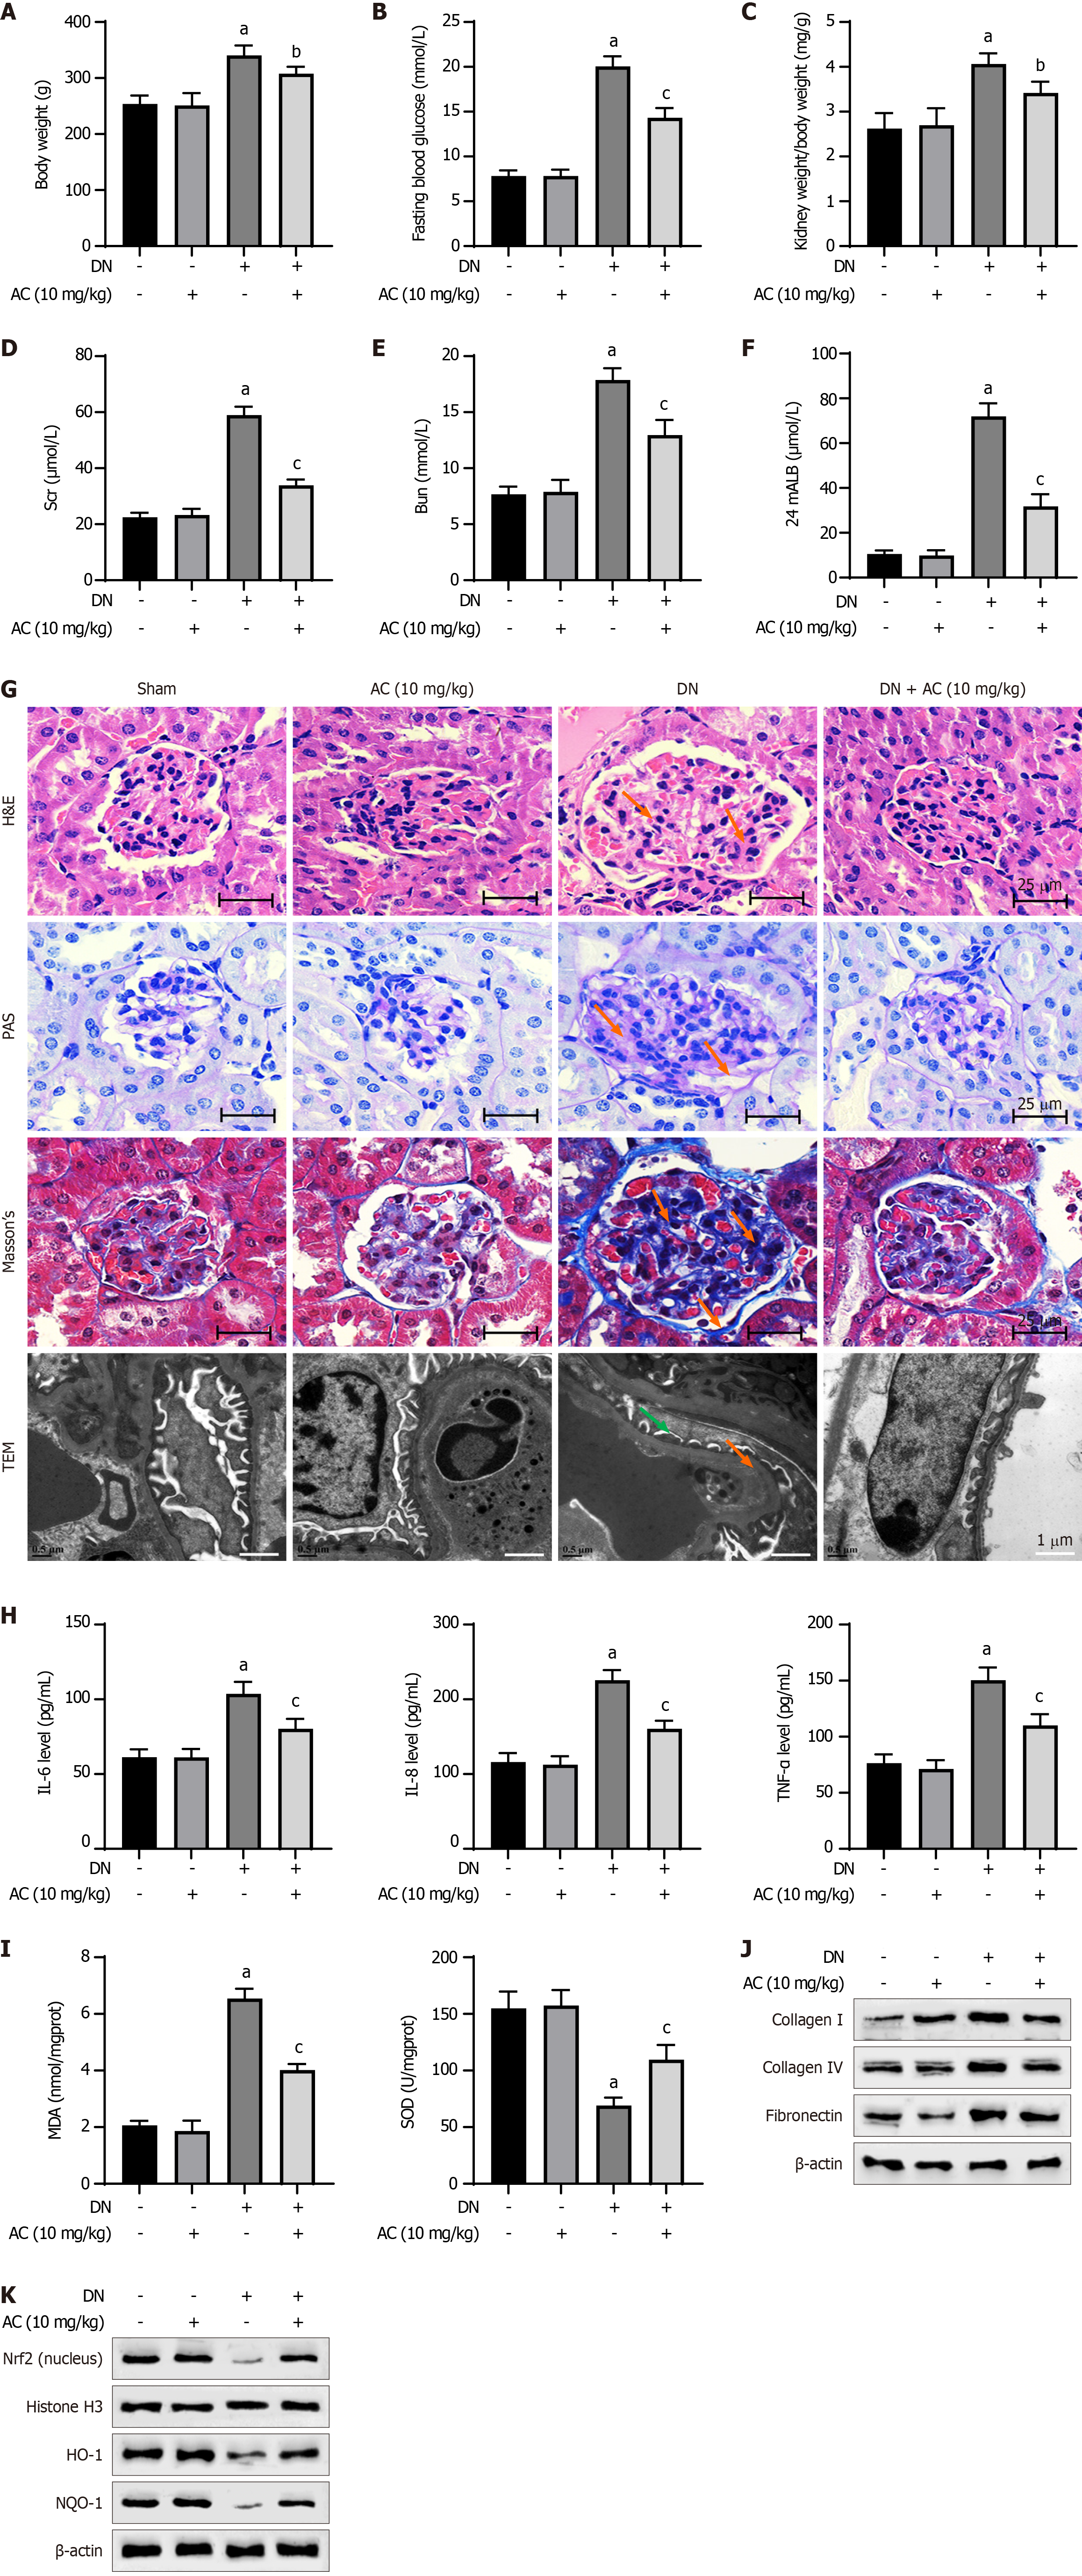
Figure 5 Asiaticoside attenuates oxidative stress and fibrosis in a diabetic nephropathy rat model.
A-F: Graphical summary of the changes in body weight, blood glucose, kidney weight/body weight ratio, serum creatinine, blood urea nitrogen, and 24-h urine protein in control, diabetic nephropathy (DN) model, asiaticoside (AC) drug, and DN + AC groups; G: Results of hematoxylin and eosin (scale bar: 25 μm, orange arrows indicate mesangial hyperplasia), Masson’s (scale bar: 25 μm, orange arrows mark collagen fiber deposition), and Periodic acid-Schiff staining (scale bar: 25 μm, orange arrows indicate glycogen deposition), as well as TEM (scale bar: 1 μm, orange arrow shows uniform thickening of the basement membrane, and green arrow indicates loss of the podocyte foot process); H and I: Graphical summary of (H) the contents of interleukin (IL)-6, IL-8, and tumor necrosis factor (TNF)-α, and (I) the contents of malondialdehyde and superoxide dismutase in rat serum of each experimental group; J: Western blot analysis of the protein expression of collagen I, collagen IV, and fibronectin; K: Protein expression of nuclear NRF2 and total heme oxygenase-1, as well as NAD(P)H dehydrogenase (Quinone) 1, in renal tissues. n = 6 animals in each group. aP < 0.001 vs Sham, bP < 0.05, and cP < 0.001 vs diabetic nephropathy. DN: Diabetic nephropathy; AC: Asiaticoside; PAS: Periodic acid-Schiff; TEM: Transmission electron microscopy; HO-1: Heme oxygenase-1; NQO-1: NAD(P)H dehydrogenase (Quinone) 1; IL: Interleukin; TNF: Tumor necrosis factor; H&E: Hematoxylin and eosin.
- Citation: Zhuang LG, Zhang R, Jin GX, Pei XY, Wang Q, Ge XX. Asiaticoside improves diabetic nephropathy by reducing inflammation, oxidative stress, and fibrosis: An in vitro and in vivo study. World J Diabetes 2024; 15(10): 2111-2122
- URL: https://www.wjgnet.com/1948-9358/full/v15/i10/2111.htm
- DOI: https://dx.doi.org/10.4239/wjd.v15.i10.2111


