Copyright
©The Author(s) 2024.
World J Diabetes. Jan 15, 2024; 15(1): 43-52
Published online Jan 15, 2024. doi: 10.4239/wjd.v15.i1.43
Published online Jan 15, 2024. doi: 10.4239/wjd.v15.i1.43
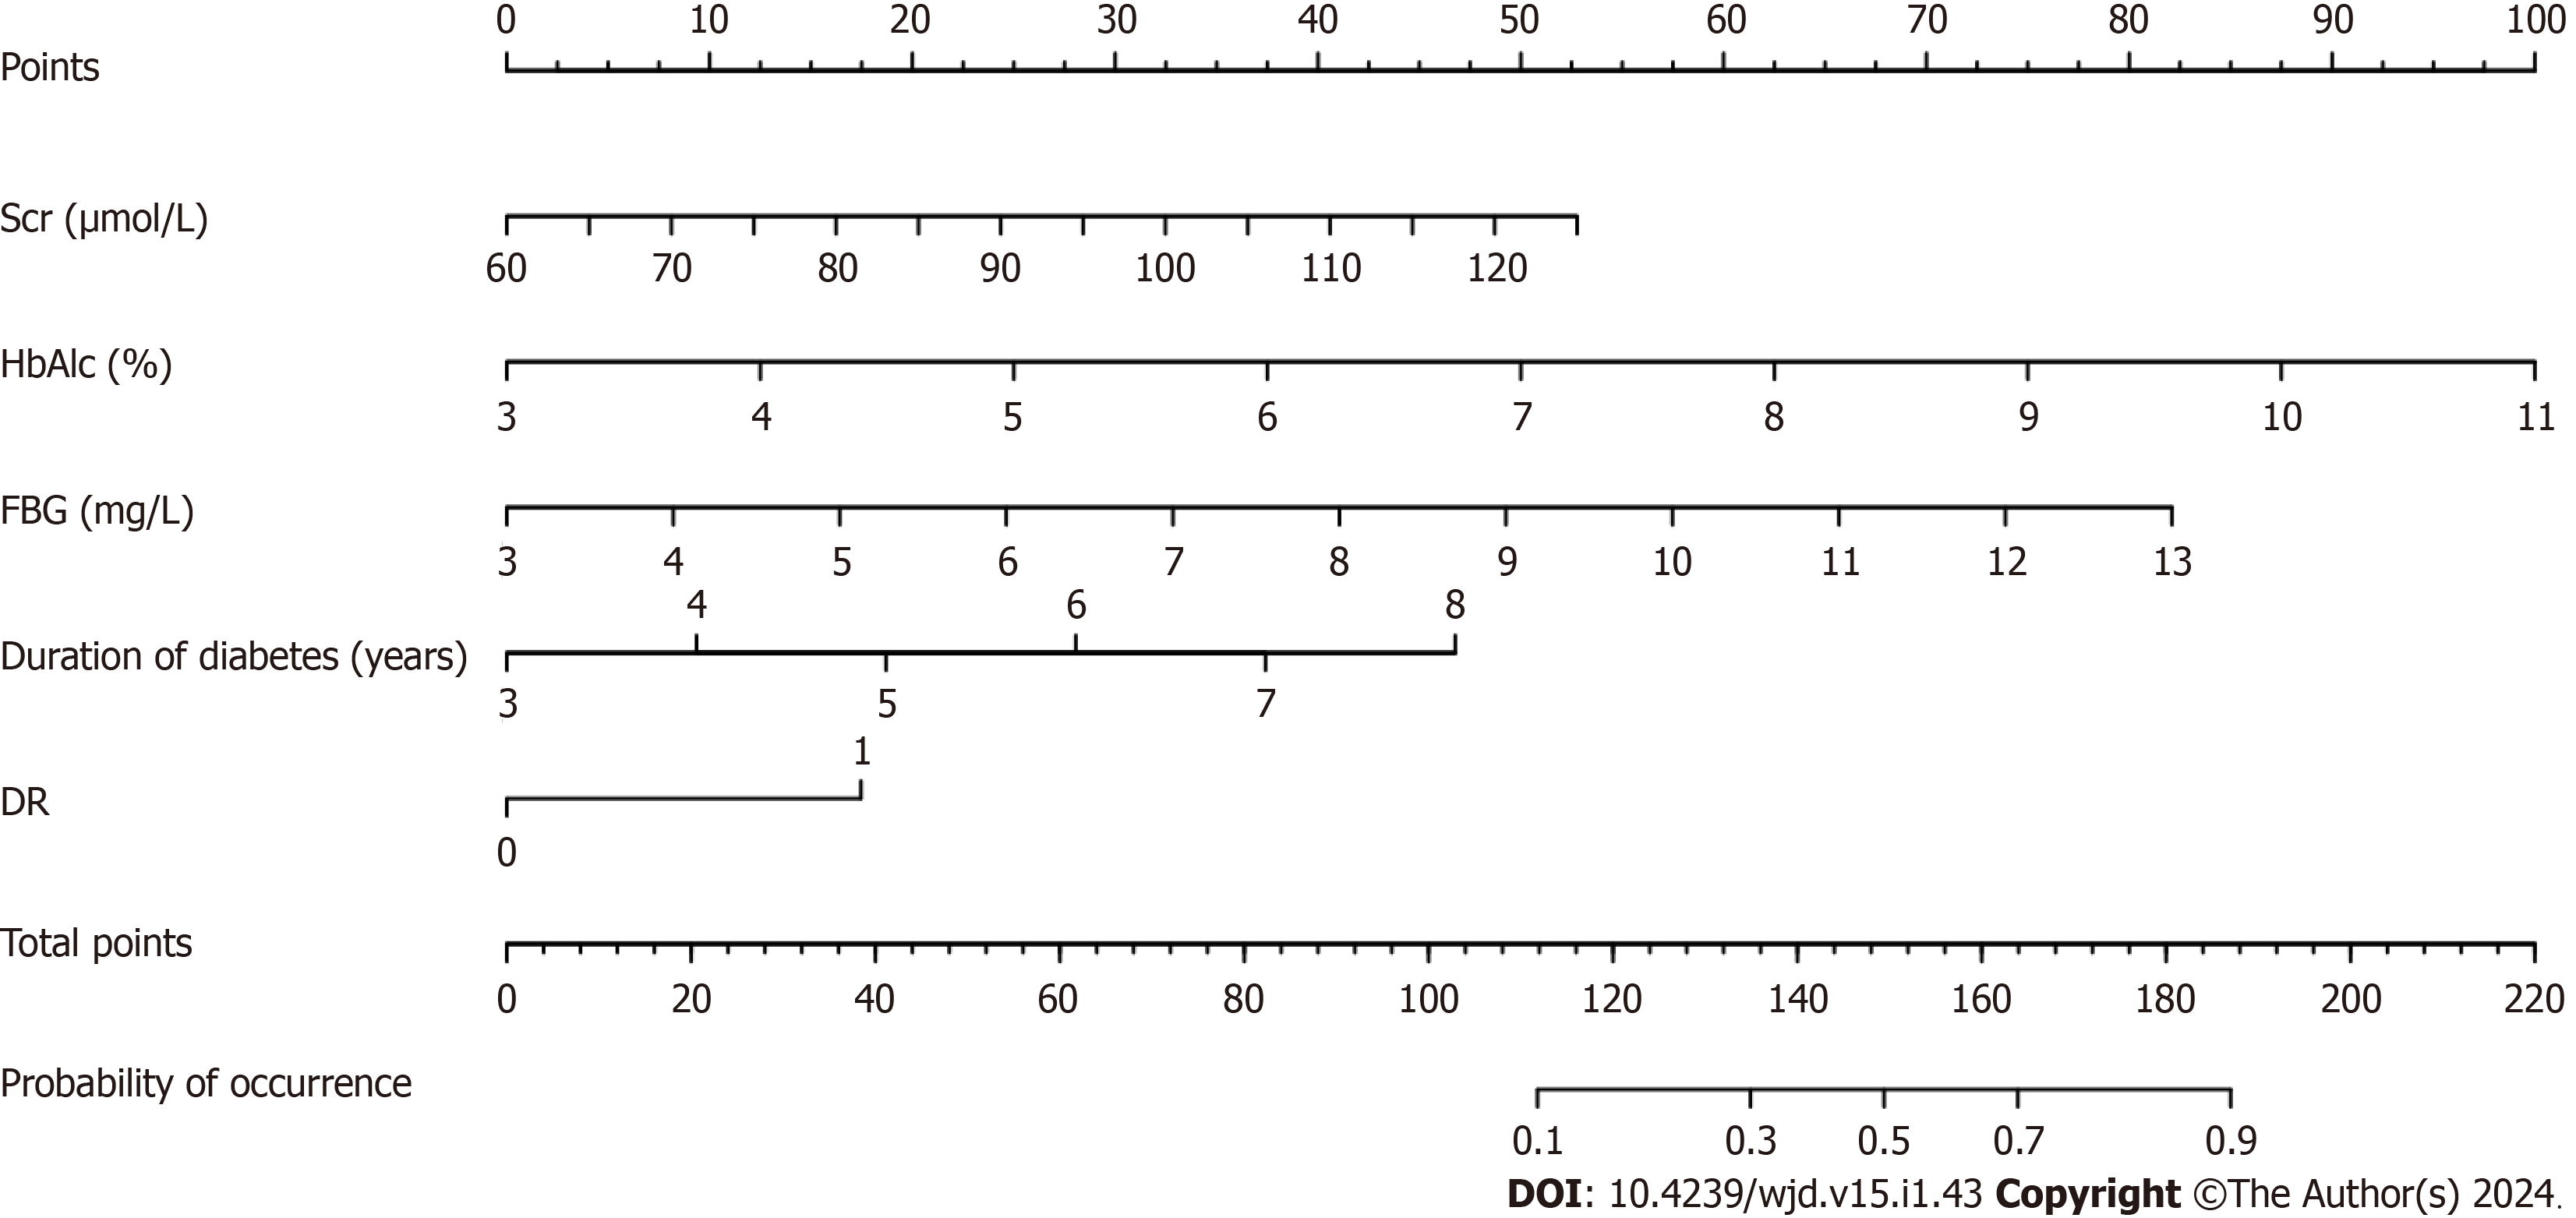
Figure 1 Nomogram prediction model for diabetic nephropathy in patients with type 2 diabetes mellitus.
Scr: Serum creatinine; HbAlc: Glycosylated hemoglobin; DR: Diabetic retinopathy; FBG: Fasting blood glucose.
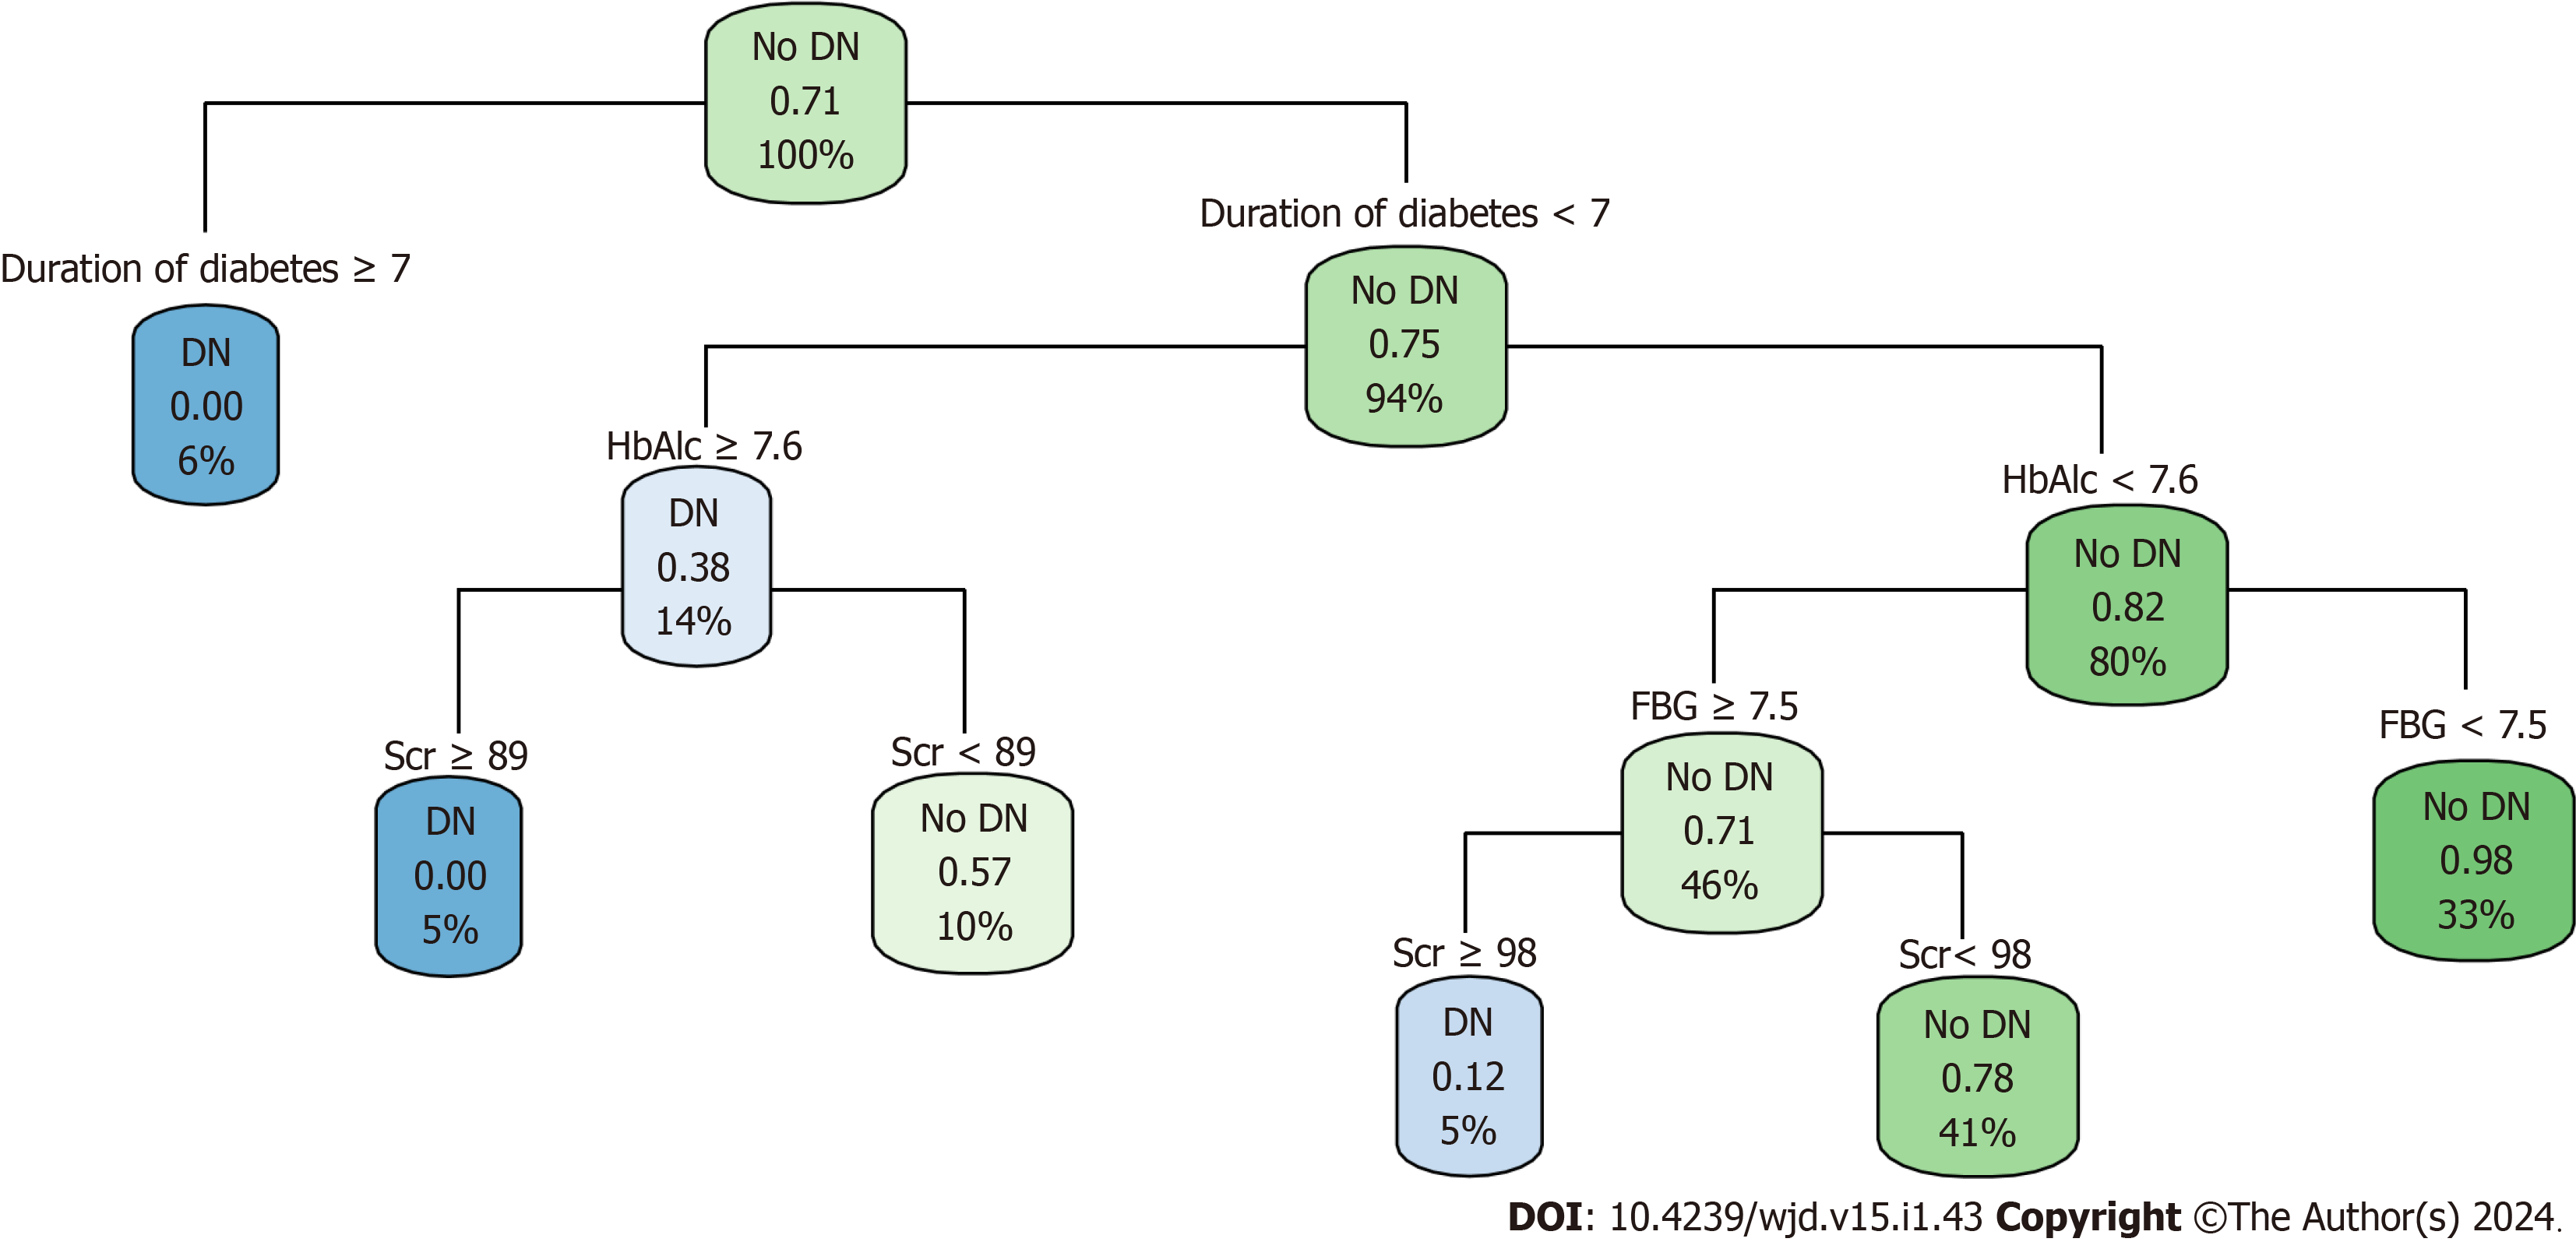
Figure 2 Decision tree model of diabetic nephropathy in patients type 2 diabetes.
Scr: Serum creatinine; HbAlc: Glycosylated hemoglobin; FBG: Fasting blood glucose.
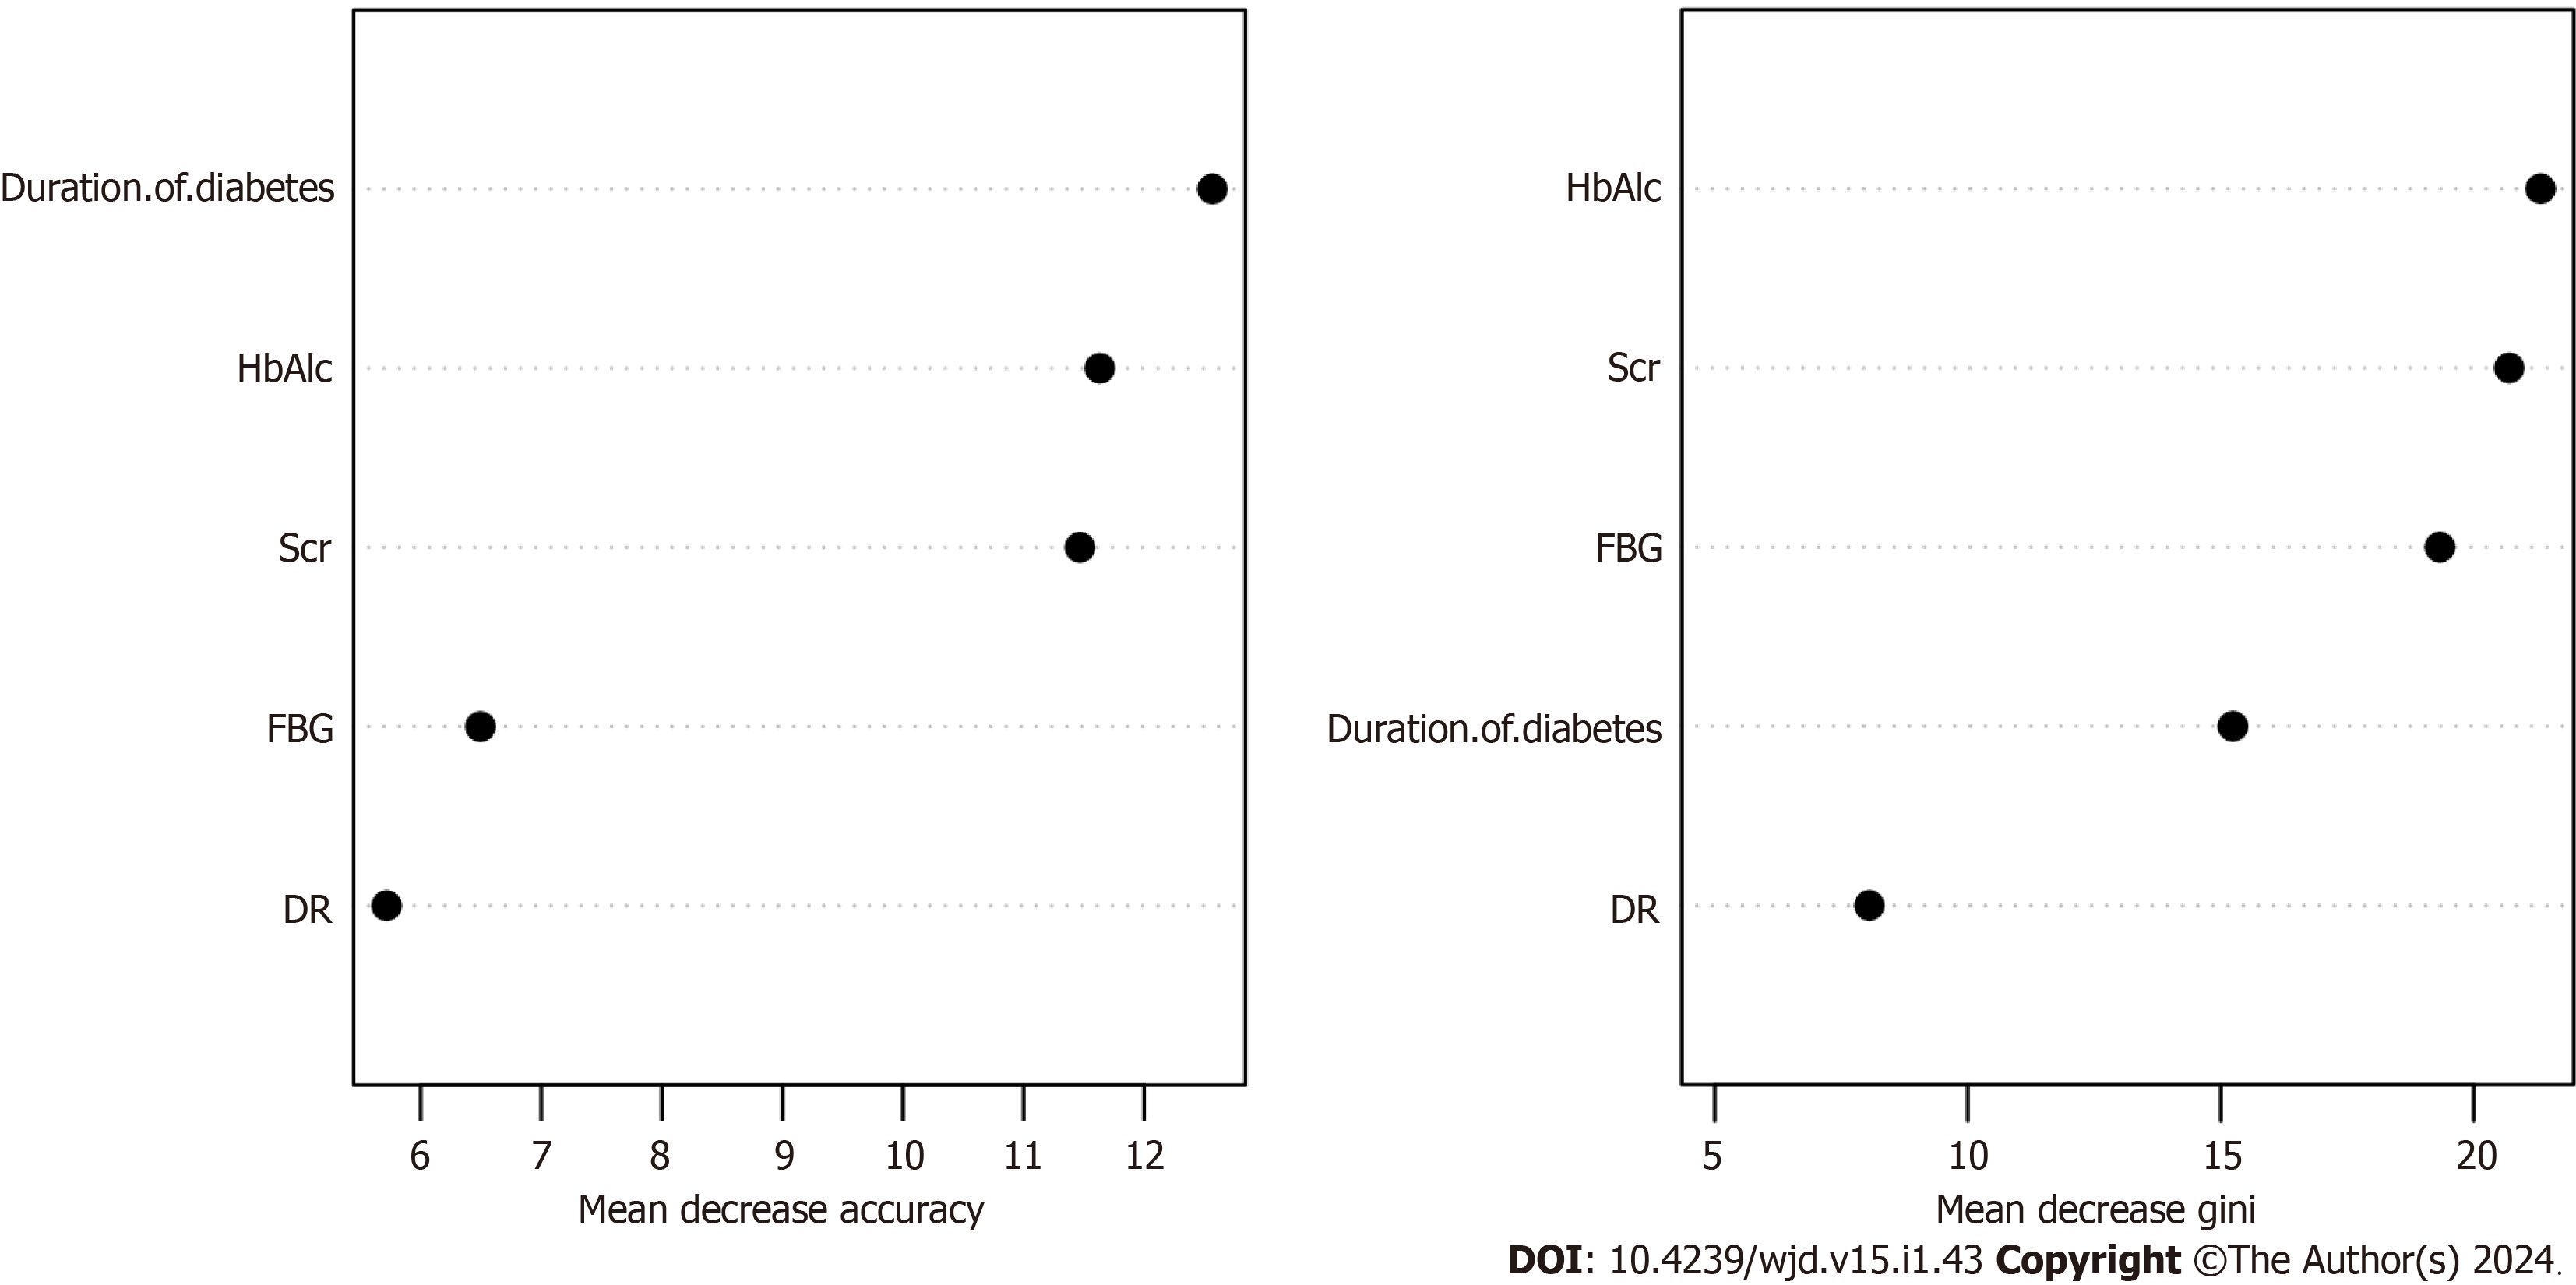
Figure 3 Random forest model of diabetic nephropathy in patients with type 2 diabetes.
Scr: Serum creatinine; HbAlc: Glycosylated hemoglobin; DR: Diabetic retinopathy; FBG: Fasting blood glucose.
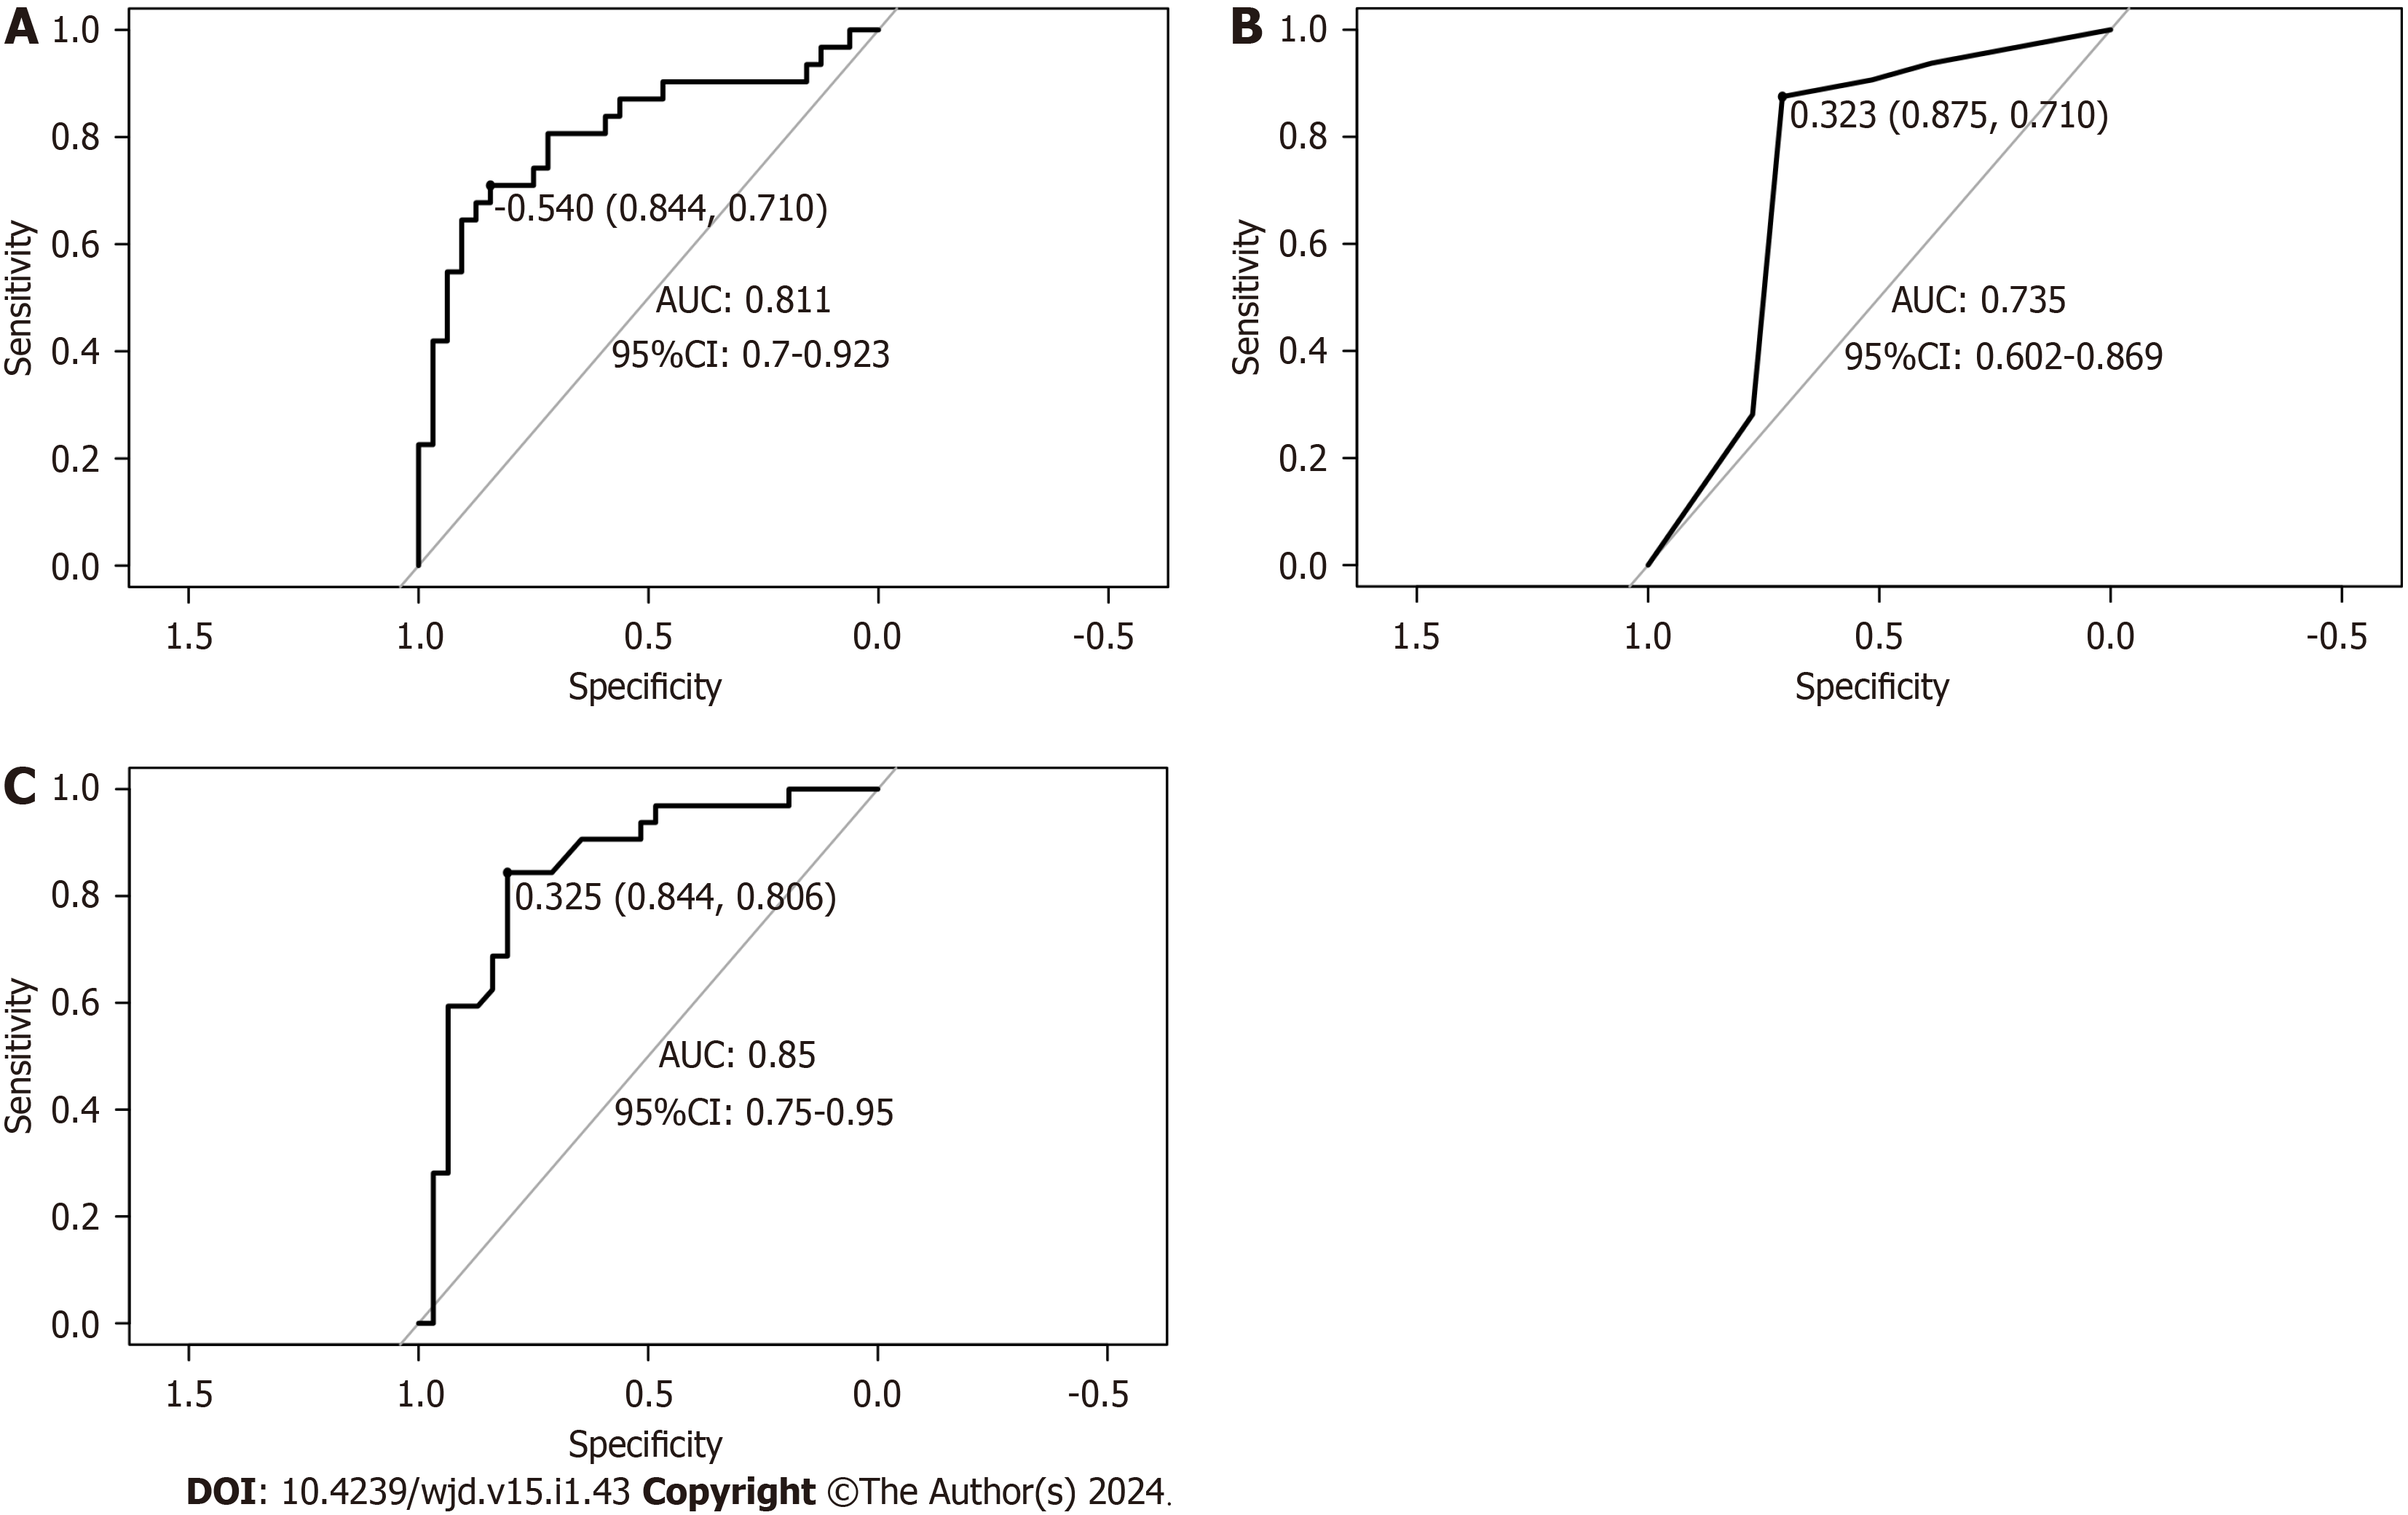
Figure 4 Receiver operating characteristic curves for the validation sets of the three models.
A: Nomogram; B: Decision-making tree; C: Random forest. AUC: Area under the receiver operating characteristic curve; CI: Confidence interval.
- Citation: Cai SS, Zheng TY, Wang KY, Zhu HP. Clinical study of different prediction models in predicting diabetic nephropathy in patients with type 2 diabetes mellitus. World J Diabetes 2024; 15(1): 43-52
- URL: https://www.wjgnet.com/1948-9358/full/v15/i1/43.htm
- DOI: https://dx.doi.org/10.4239/wjd.v15.i1.43


