Copyright
©The Author(s) 2023.
World J Diabetes. Oct 15, 2023; 14(10): 1562-1572
Published online Oct 15, 2023. doi: 10.4239/wjd.v14.i10.1562
Published online Oct 15, 2023. doi: 10.4239/wjd.v14.i10.1562
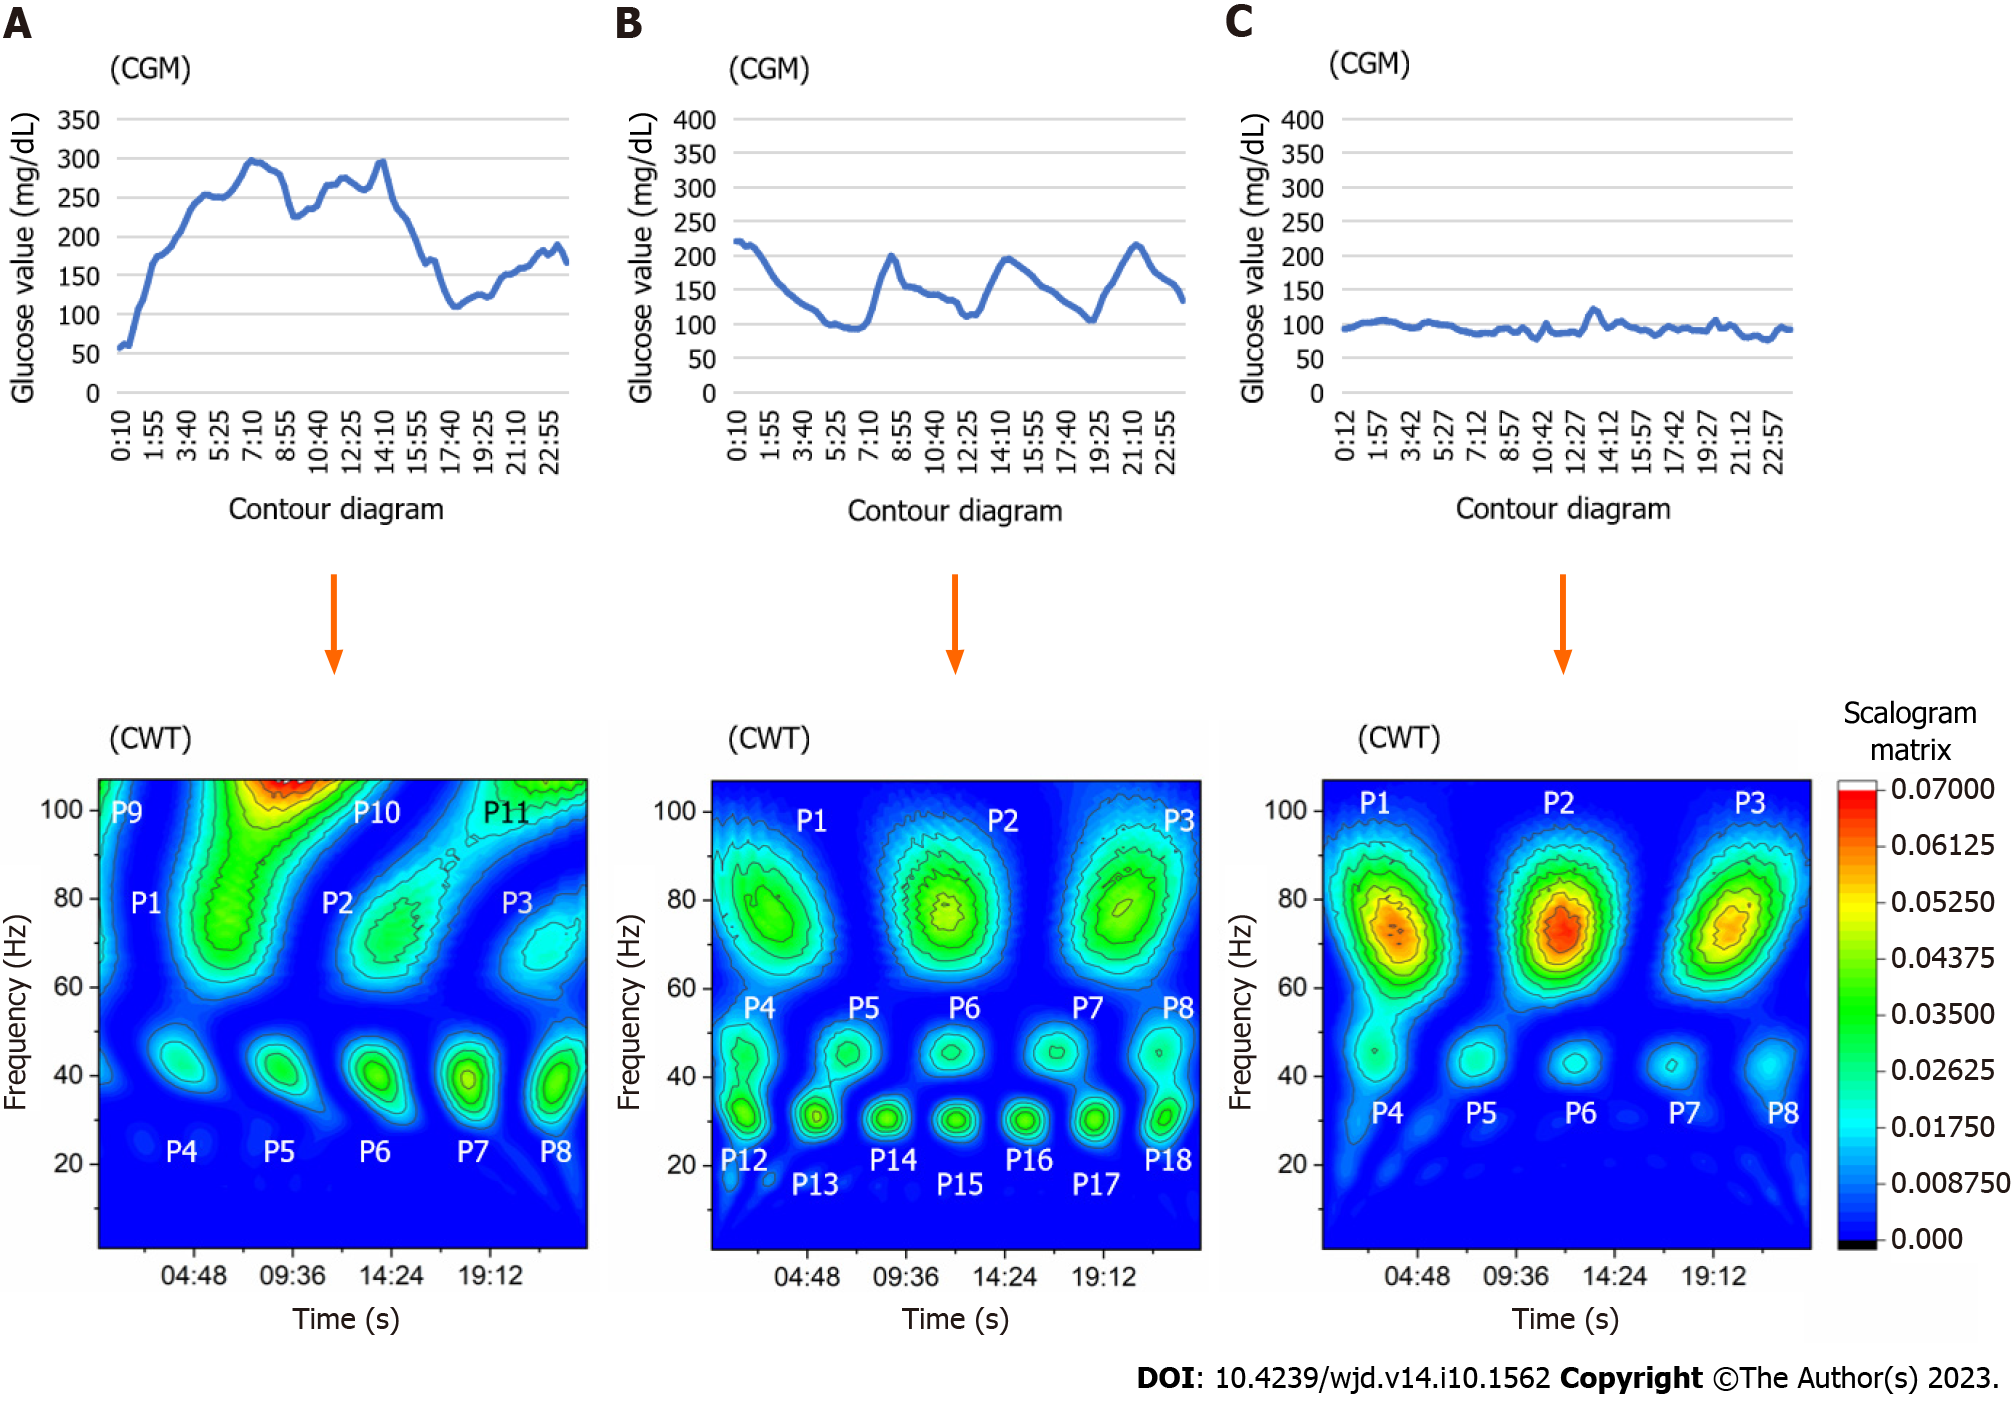
Figure 1 Representative image of the contour diagram converted through continuous wavelet transform of continuous glucose monitoring data associated with both diabetes groups, including a subject without diabetes.
The upper panels indicate the continuous glucose monitoring data of each group. The bottom panels indicate the contour diagram after continuous wavelet transform (CWT) processing. The CWT produced 18 signals from the continuous glucose shift. The signals were divided according to the time and frequency zone, which corresponded to the peak scalogram value. P1-P3, P4-P8, P9-P11, and P12-P18 belonged to a high frequency zone (about 60-85 Hz; indicating a wave period of 17-24 min), middle frequency zone (35-55 Hz; indicating a wave period of 26-41 min), super-high frequency zone (> 100 Hz; indicating a wave period < 14 min), and low frequency zone (15-35 Hz; indicating a wave period 41-96 min), respectively. A: Type 1 diabetes mellitus; B: Type 2 diabetes mellitus; C: A subject without diabetes as a reference. T1DM: Type 1 diabetes mellitus; T2DM: Type 2 diabetes mellitus; CGM: Continuous glucose monitoring; CWT: Continuous wavelet transform.
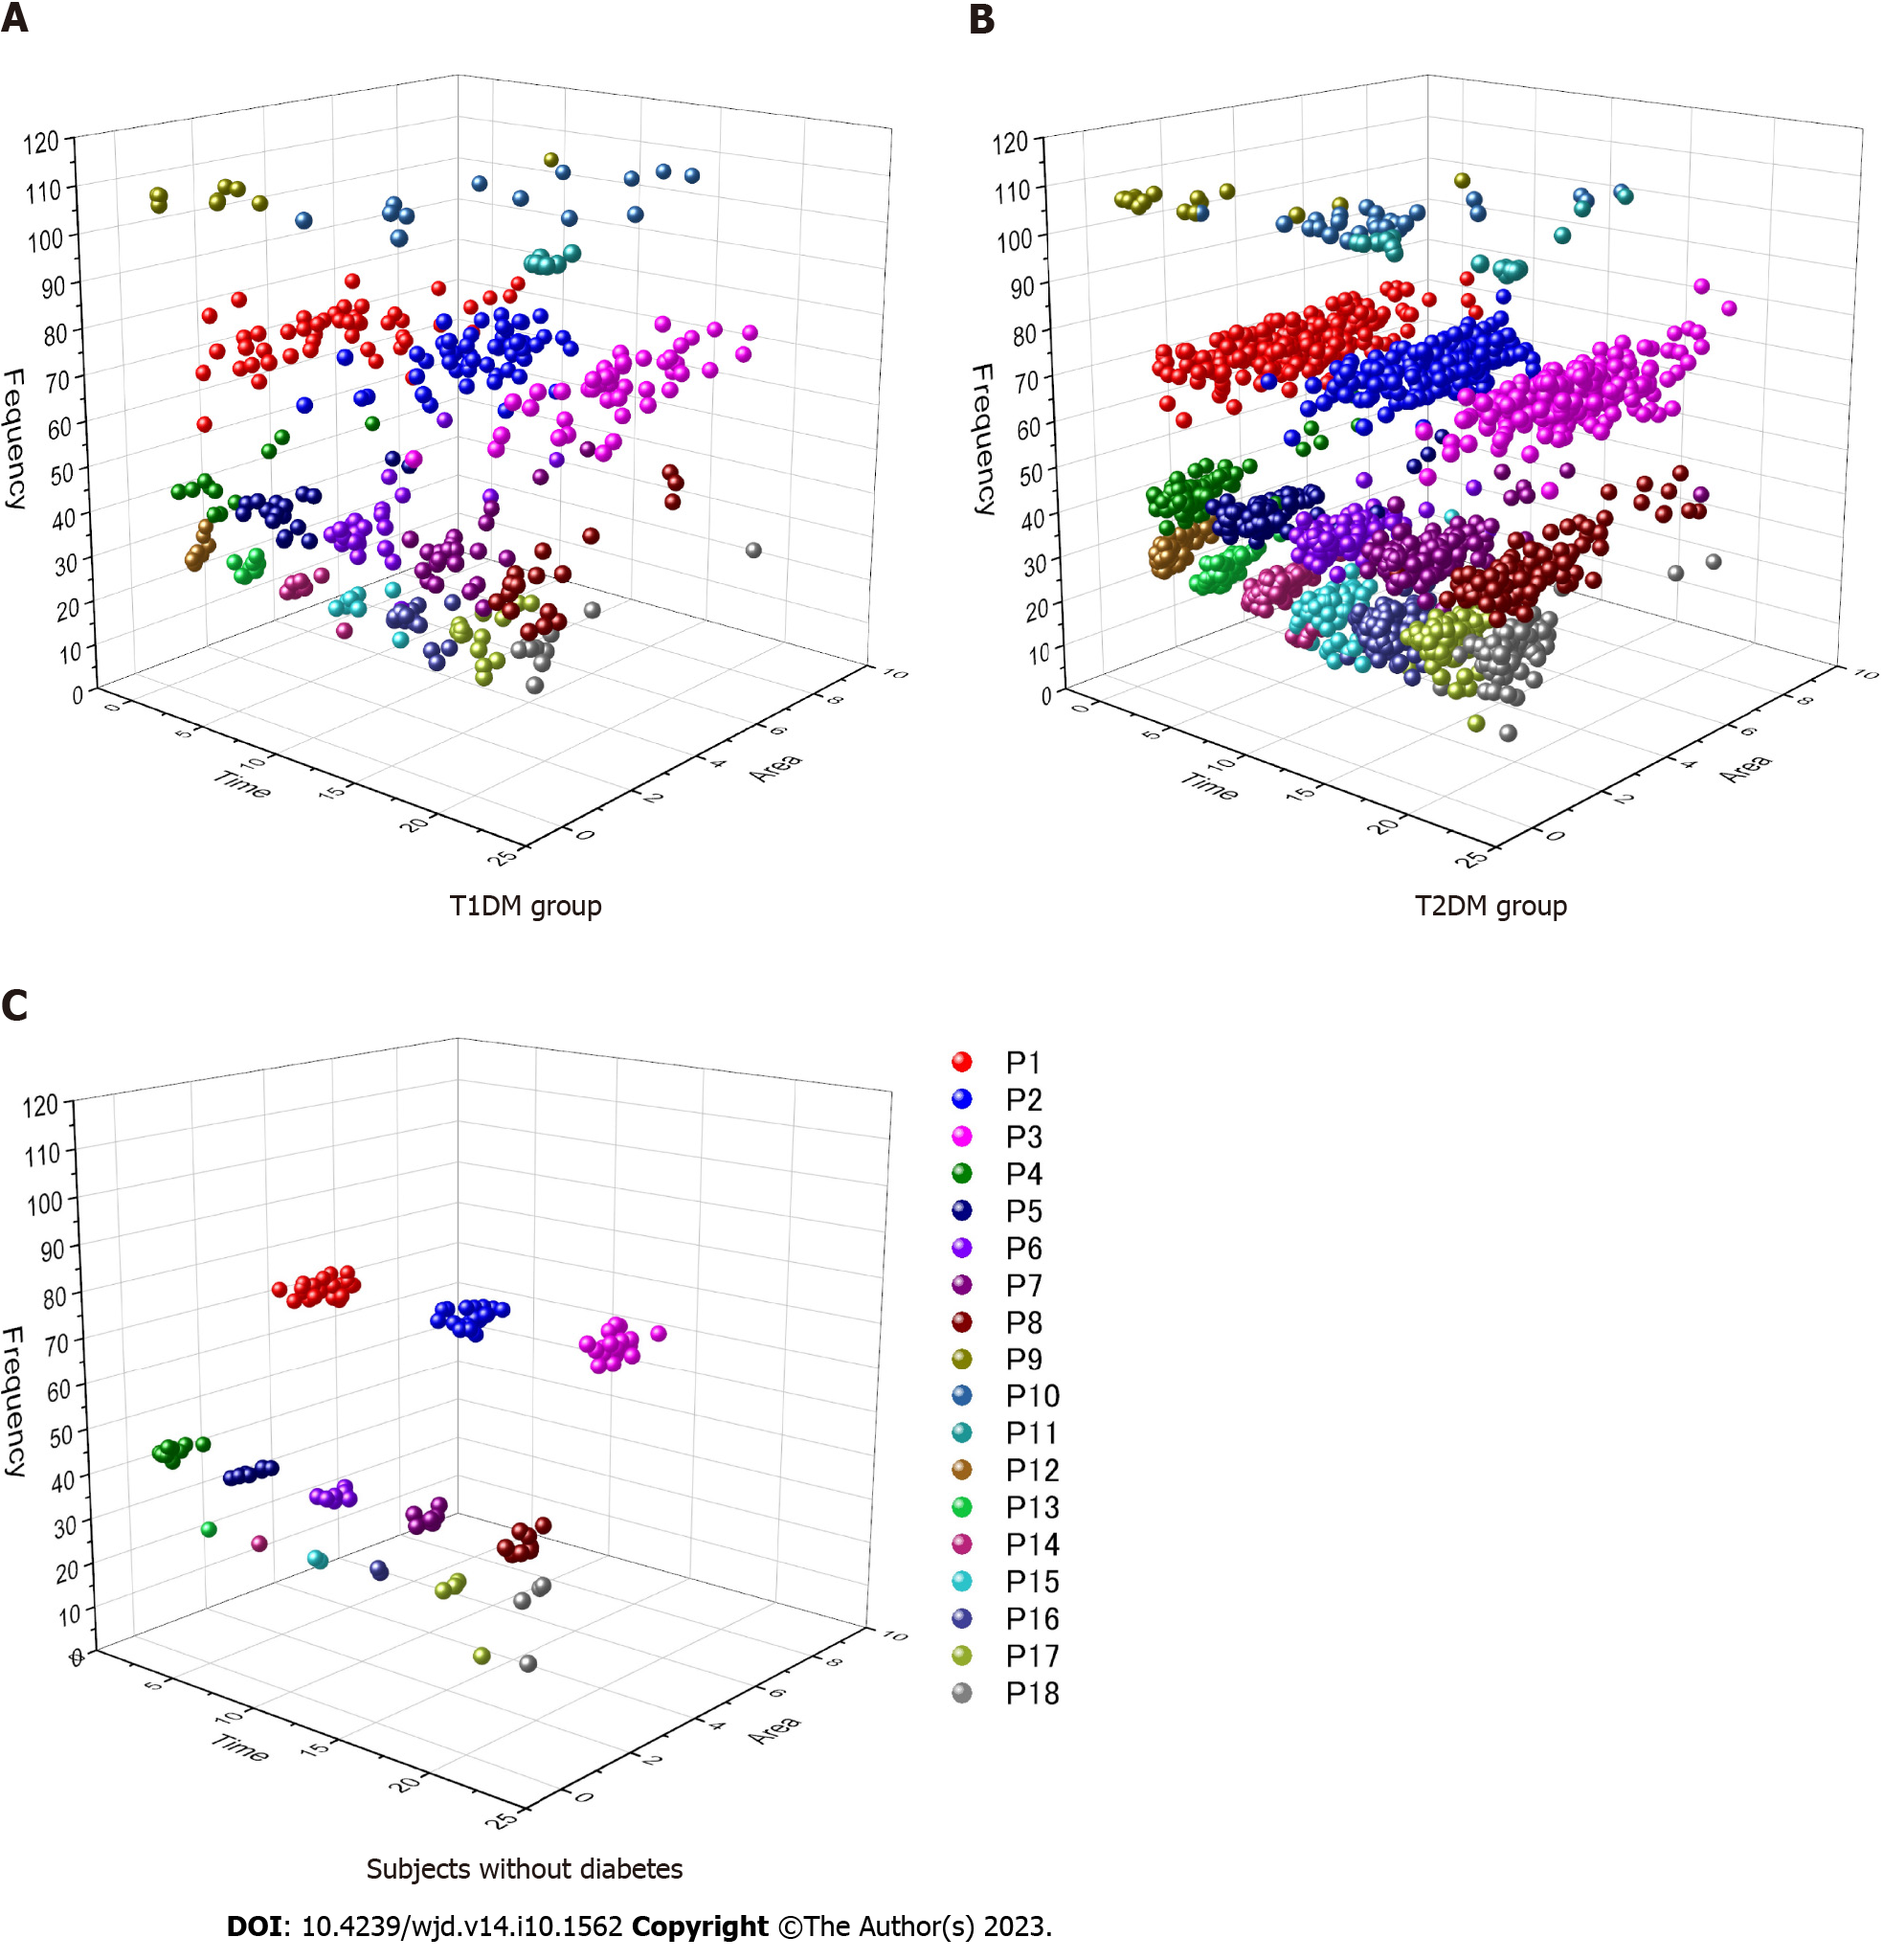
Figure 2 Comparison of the three-dimensional scattering diagram between groups.
The x-axis indicates time during a day; the y-axis indicates the area enclosed at the 0.02625 scalogram value; the z-axis indicates a pseudo-frequency determined after continuous wavelet transform processing. The wave cycles of P1 signals belonging to type 1 diabetes mellitus (T1DM) were distributed during 17-24 min. The loose distribution of P1 signal wave length characterized T1DM. A: Type 1 diabetes mellitus group; B: Type 2 diabetes mellitus group; C: Subjects without diabetes.
- Citation: Nakamura Y, Furukawa S. Characteristics of glucose change in diabetes mellitus generalized through continuous wavelet transform processing: A preliminary study. World J Diabetes 2023; 14(10): 1562-1572
- URL: https://www.wjgnet.com/1948-9358/full/v14/i10/1562.htm
- DOI: https://dx.doi.org/10.4239/wjd.v14.i10.1562


