Copyright
©The Author(s) 2022.
World J Diabetes. May 15, 2022; 13(5): 408-416
Published online May 15, 2022. doi: 10.4239/wjd.v13.i5.408
Published online May 15, 2022. doi: 10.4239/wjd.v13.i5.408
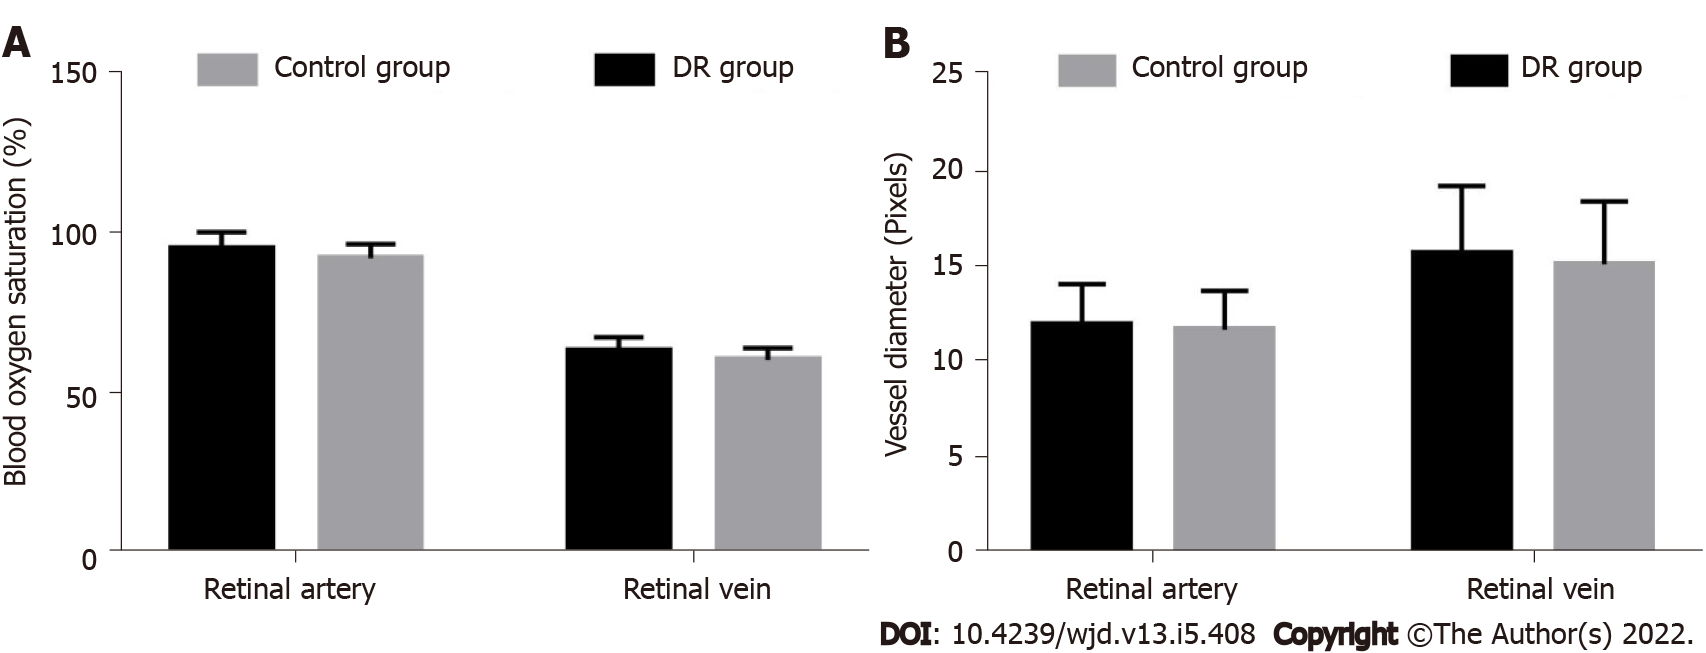
Figure 1 Histograms of retinal artery, venous oxygen saturation, diameters of retinal arteries and veins of two groups of subjects.
A: Histograms of retinal artery and venous oxygen saturation; B: Histograms of the diameters of retinal arteries and veins. DR: Diabetic retinopathy.
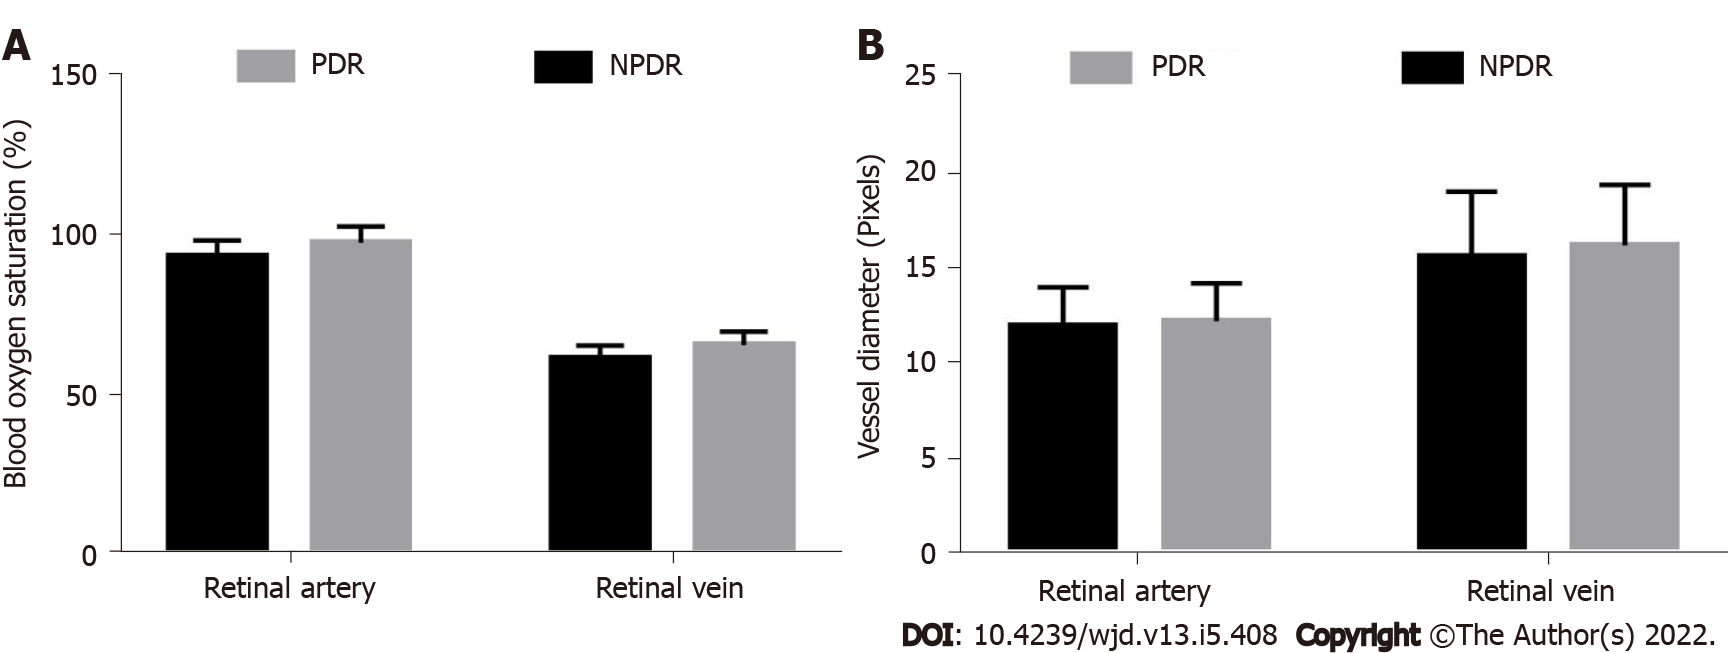
Figure 2 Histogram of retinal artery, venous oxygen saturation and vein diameters in patients with different diabetic retinopathy stages.
A: Histogram of retinal artery and venous oxygen saturation; B: Histogram of retinal artery and vein diameters. PDR: Proliferative diabetic retinopathy; NPDR: Non-proliferative diabetic retinopathy.
Figure 3 Results of retinal color images of different subjects.
A: The control group; B: The simple diabetic retinopathy (DR) group; C: The proliferative DR group.
- Citation: Wang XL, Cai FR, Gao YX, Zhang J, Zhang M. Changes and significance of retinal blood oxygen saturation and oxidative stress indexes in patients with diabetic retinopathy. World J Diabetes 2022; 13(5): 408-416
- URL: https://www.wjgnet.com/1948-9358/full/v13/i5/408.htm
- DOI: https://dx.doi.org/10.4239/wjd.v13.i5.408


