Copyright
©The Author(s) 2021.
World J Diabetes. Apr 15, 2021; 12(4): 480-498
Published online Apr 15, 2021. doi: 10.4239/wjd.v12.i4.480
Published online Apr 15, 2021. doi: 10.4239/wjd.v12.i4.480
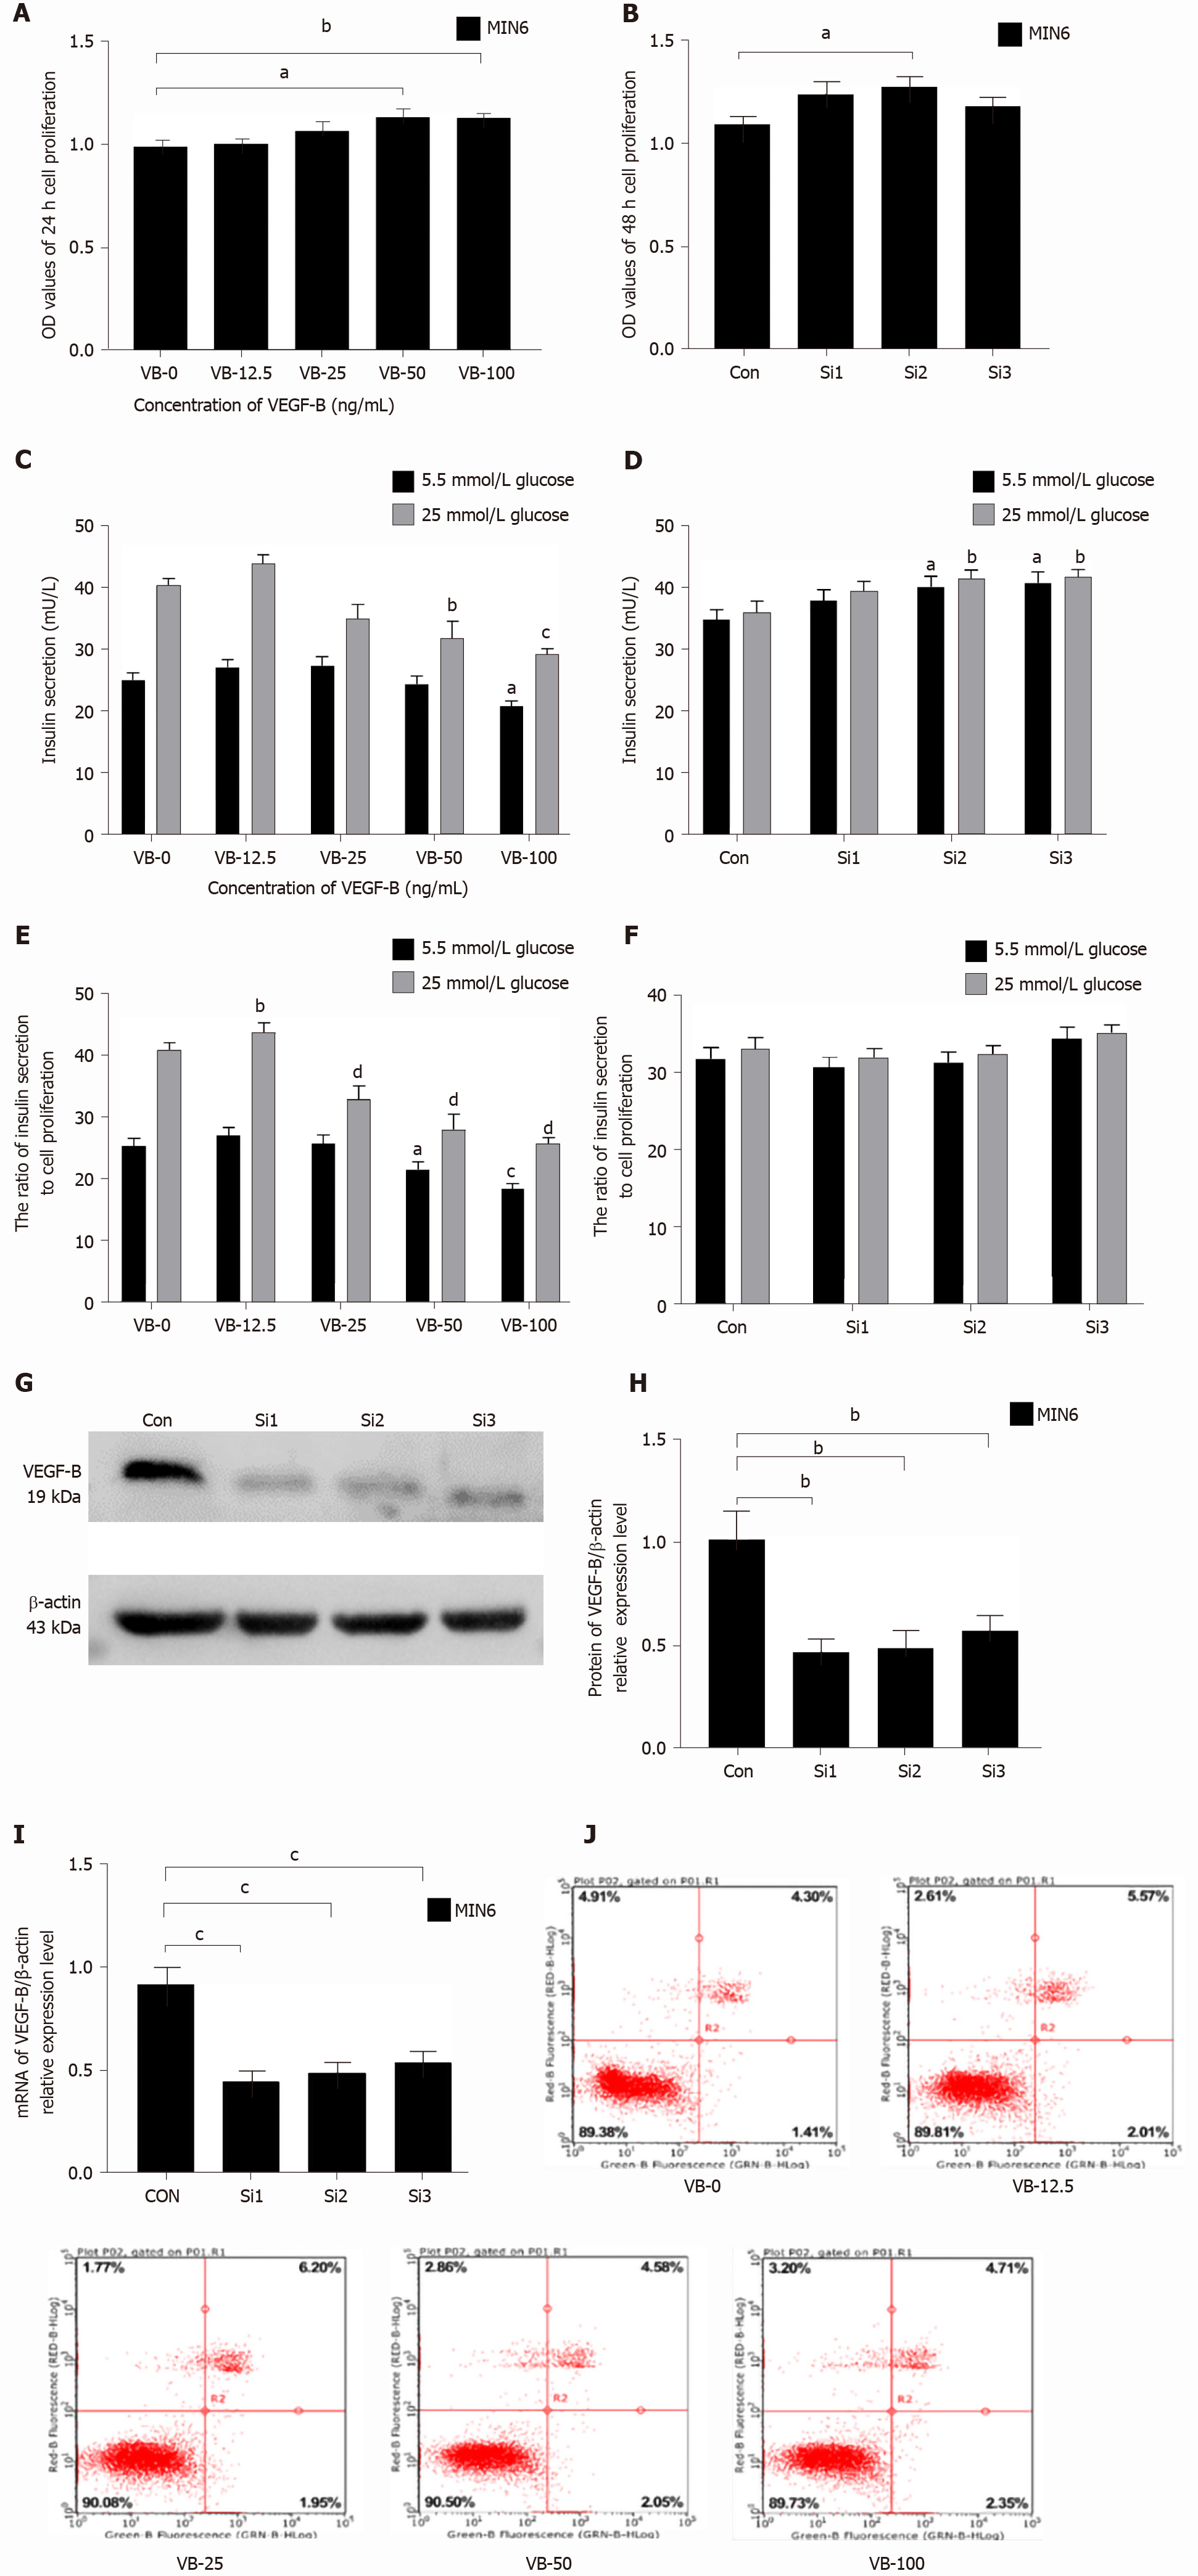
Figure 1 Decreased insulin secretion in MIN6 cells is related to vascular endothelial growth factor B function.
A: Treatment with a gradient concentration of vascular endothelial growth factor B (VEGF-B, VB) protein promotes MIN6 cell proliferation. aP < 0.05 vs VB-0, bP < 0.01 vs VB-0; B: MIN6 cells with VEGF-B knockdown show an increasing trend in proliferation. aP < 0.05 vs Control; C: Stimulation with a gradient concentration of VEGF-B protein inhibits insulin secretion by MIN6 cells. aP < 0.05 vs VB-0 in the presence of 5.5 mmol/L glucose; bP < 0.01, cP < 0.001 vs VB-0 in the presence of 25 mmol/L glucose; D: MIN6 cells with VEGF-B knockdown exhibit increased insulin secretion. aP < 0.05 vs Control in the presence of 5.5 mmol/L glucose; bP < 0.05 Control in the presence of 25 mmol/L glucose; E: The ratio of insulin secretion by MIN6 cells to their corresponding proliferation upon stimulation with a gradient concentration of VEGF-B protein. aP < 0.05, cP < 0.001 vs VB-0 in the presence of 5.5 mmol/L glucose; bP < 0.01, dP < 0.001 vs Control in the presence of 25 mmol/L glucose; F: The ratio of insulin secretion in MIN6 cells to its corresponding cell proliferation after knocking down VEGF-B; G and H: Western blot analysis revealing relative VEGF-B protein expression in cells transfected with VEGF-B siRNA and corresponding statistical data. bP < 0.01 vs Control; I: Reverse transcription-polymerase chain reaction revealing relative VEGF-B mRNA expression in cells transfected with VEGF-B siRNA and corresponding statistical data. cP < 0.001 vs Control; J: Flow cytometry results indicating that VEGF-B does not affect the apoptosis of MIN6 cells. Student's t-test was performed. VEGF-B: Vascular endothelial growth factor B; VB: VEGF-B; Con: Control; Si: Small interfering RNA; MIN6: MIN6 cell; OD: Optical density.
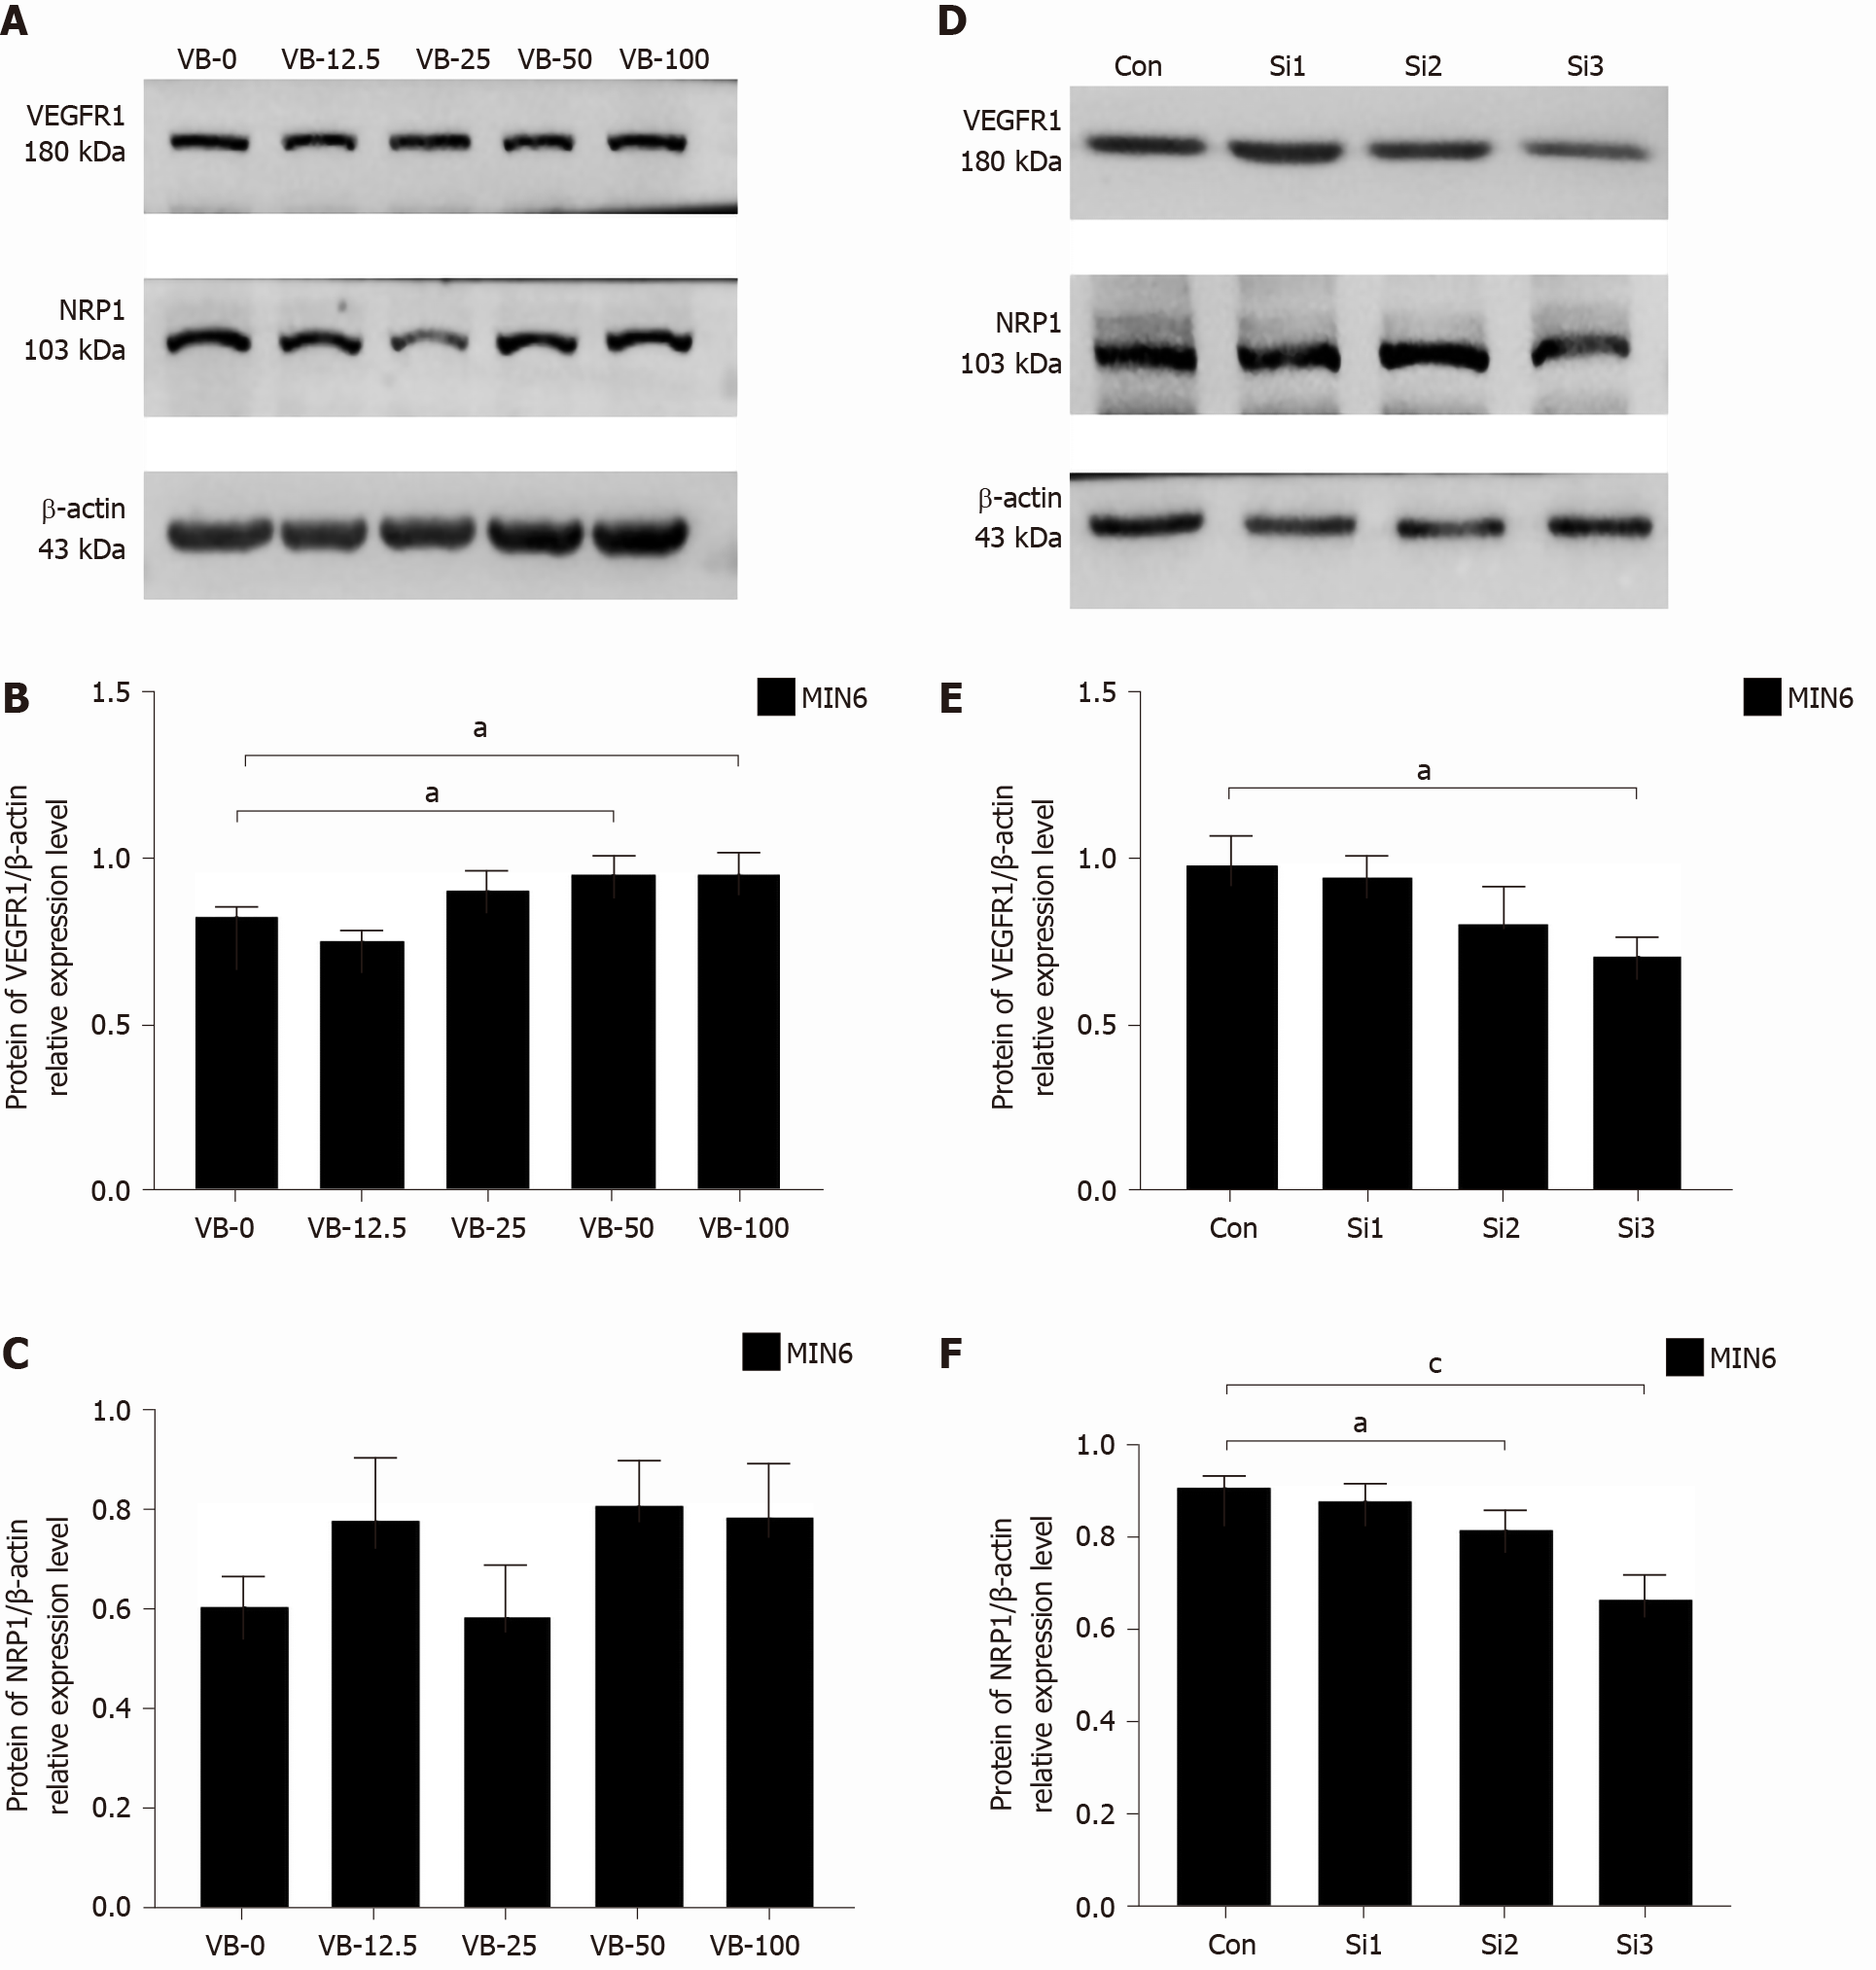
Figure 2 Exogenous vascular endothelial growth factor B stimulation increases the expression of vascular endothelial growth factor B receptor 1, while vascular endothelial growth factor B small interfering RNA transfection decreases the expression of vascular endothelial growth factor B receptor 1 and neuropilin 1.
A-C: Western blot analysis revealing the relative protein expression of vascular endothelial growth factor B receptor 1 (VEGFR1) and neuropilin 1 in cells stimulated with exogenous VEGF-B and corresponding statistical data; D-F: Western blot analysis indicating the relative protein expression of VEGFR1 and neuropilin 1 in cells transfected with VEGF-B small interfering RNA and corresponding statistical data. Student's t-test was performed. aP < 0.05 vs Control; cP < 0.001 vs Control. NRP1: Neuropilin 1; VEGF-B: Vascular endothelial growth factor B; VB: VEGF-B; Con: Control; Si: Small interfering RNA; MIN6: MIN6 cell.
Figure 3 Exogenous vascular endothelial growth factor B inhibits the expression of PI3K-AKT pathway proteins in MIN6 cells, and knockdown of vascular endothelial growth factor B promotes the expression of these pathway proteins.
A-C: Western blot analysis revealing the relative protein expression of phosphatidylinositol 3-kinase (PI3K)-P85 and PI3K-P110γ in cells treated with exogenous vascular endothelial growth factor B (VEGF-B, VB) and corresponding statistical data. aP < 0.05 vs VB-0, bP < 0.01 vs VB-0; D and E: Western blot analysis indicating the relative protein expression of phosphorylated (p)-serine/threonine kinase (AKT) and AKT in cells treated with exogenous VEGF-B and corresponding statistical data. aP < 0.05 vs VB-0 about p-AKT; F: The effect of exogenous VEGF-B protein stimulation on AKT phosphorylation. aP < 0.05 vs VB-0; G-I: Western blot analysis revealing the relative protein expression of PI3K-P85 and PI3K-P110γ in cells transfected with VEGF-B small interfering RNA (siRNA) and corresponding statistical data. aP < 0.05 vs Control, bP < 0.01 vs Control; J and K: Western blot analysis indicating the relative protein expression of p-AKT and AKT in cells transfected with VEGF-B siRNA and corresponding statistical data. aP < 0.05 vs Control, bP < 0.01 vs Control for p-AKT levels; cP < 0.01 vs Control, dP < 0.001 vs Control for AKT levels; L: Effect of VEGF-B knockdown on AKT phosphorylation. bP < 0.01 vs Con vs Control. Student's t-test was performed. PI3K: Phosphatidylinositol 3-kinase; AKT: Serine/threonine kinase; p-AKT: Phosphorylated-serine/threonine kinase; VB: Vascular endothelial growth factor B; Con: Control; Si: Small interfering RNA; MIN6: MIN6 cell.
Figure 4 Vascular endothelial growth factor B inhibits Ca2+ and cyclic adenosine monophosphate levels and phospholipase C gamma 1 protein expression in MIN6 cells.
A: Exogenous vascular endothelial growth factor B (VEGF-B, VB) protein reduces cyclic adenosine monophosphate (cAMP) levels in MIN6 cells. bP < 0.01 vs VB-0 in the presence of 5.5 mmol/L glucose; dP < 0.01 vs VB-0 in the presence of 25 mmol/L glucose; B: cAMP levels in MIN6 cells increase after VEGF-B is knocked down. bP < 0.01, cP < 0.001 vs Control in the presence of 5.5 mmol/L glucose; dP < 0.05 vs Control in the presence of 25 mmol/L glucose; C: Exogenous VEGF-B protein reduces Ca2+ levels in MIN6 cells. bP < 0.01 vs VB-0 in the presence of 5.5 mmol/L glucose; D: Ca2+ levels in MIN6 cells increase after VEGF-B is knocked down. cP < 0.001 vs Con in the presence of 5.5 mmol/L glucose; dP < 0.01, eP < 0.001 vs Con in the presence of 25 mmol/L glucose; E and F: Western blot analysis revealing the relative protein expression of phospholipase C gamma 1 (PLCγ1) and phosphorylated (p)-PLCγ1 in cells stimulated with exogenous VEGF-B and corresponding statistical data. aP < 0.05 vs VB-0 for P-PLCγ1; bP < 0.05 vs VB-0 for PLCγ1; G: The effect of exogenous VEGF-B protein stimulation on PLCγ1 phosphorylation; H and I: Western blot analysis revealing the relative protein expression of PLCγ1 and p-PLCγ1 in cells transfected with VEGF-B siRNA and corresponding statistical data. aP < 0.05 vs Control for p-PLCγ1, bP < 0.05 vs Control for PLCγ1; J: Effect of VEGF-B knockdown on PLCγ1 phosphorylation. Student's t-test was performed. VEGF-B: Vascular endothelial growth factor B; VB: VEGF-B; cAMP: Cyclic adenosine monophosphate; Con: Control; Si: Small interfering RNA; MIN6: MIN6 cell; PLCγ1: Phospholipase C gamma 1; p-PLCγ1: Phosphorylated phospholipase C gamma 1.
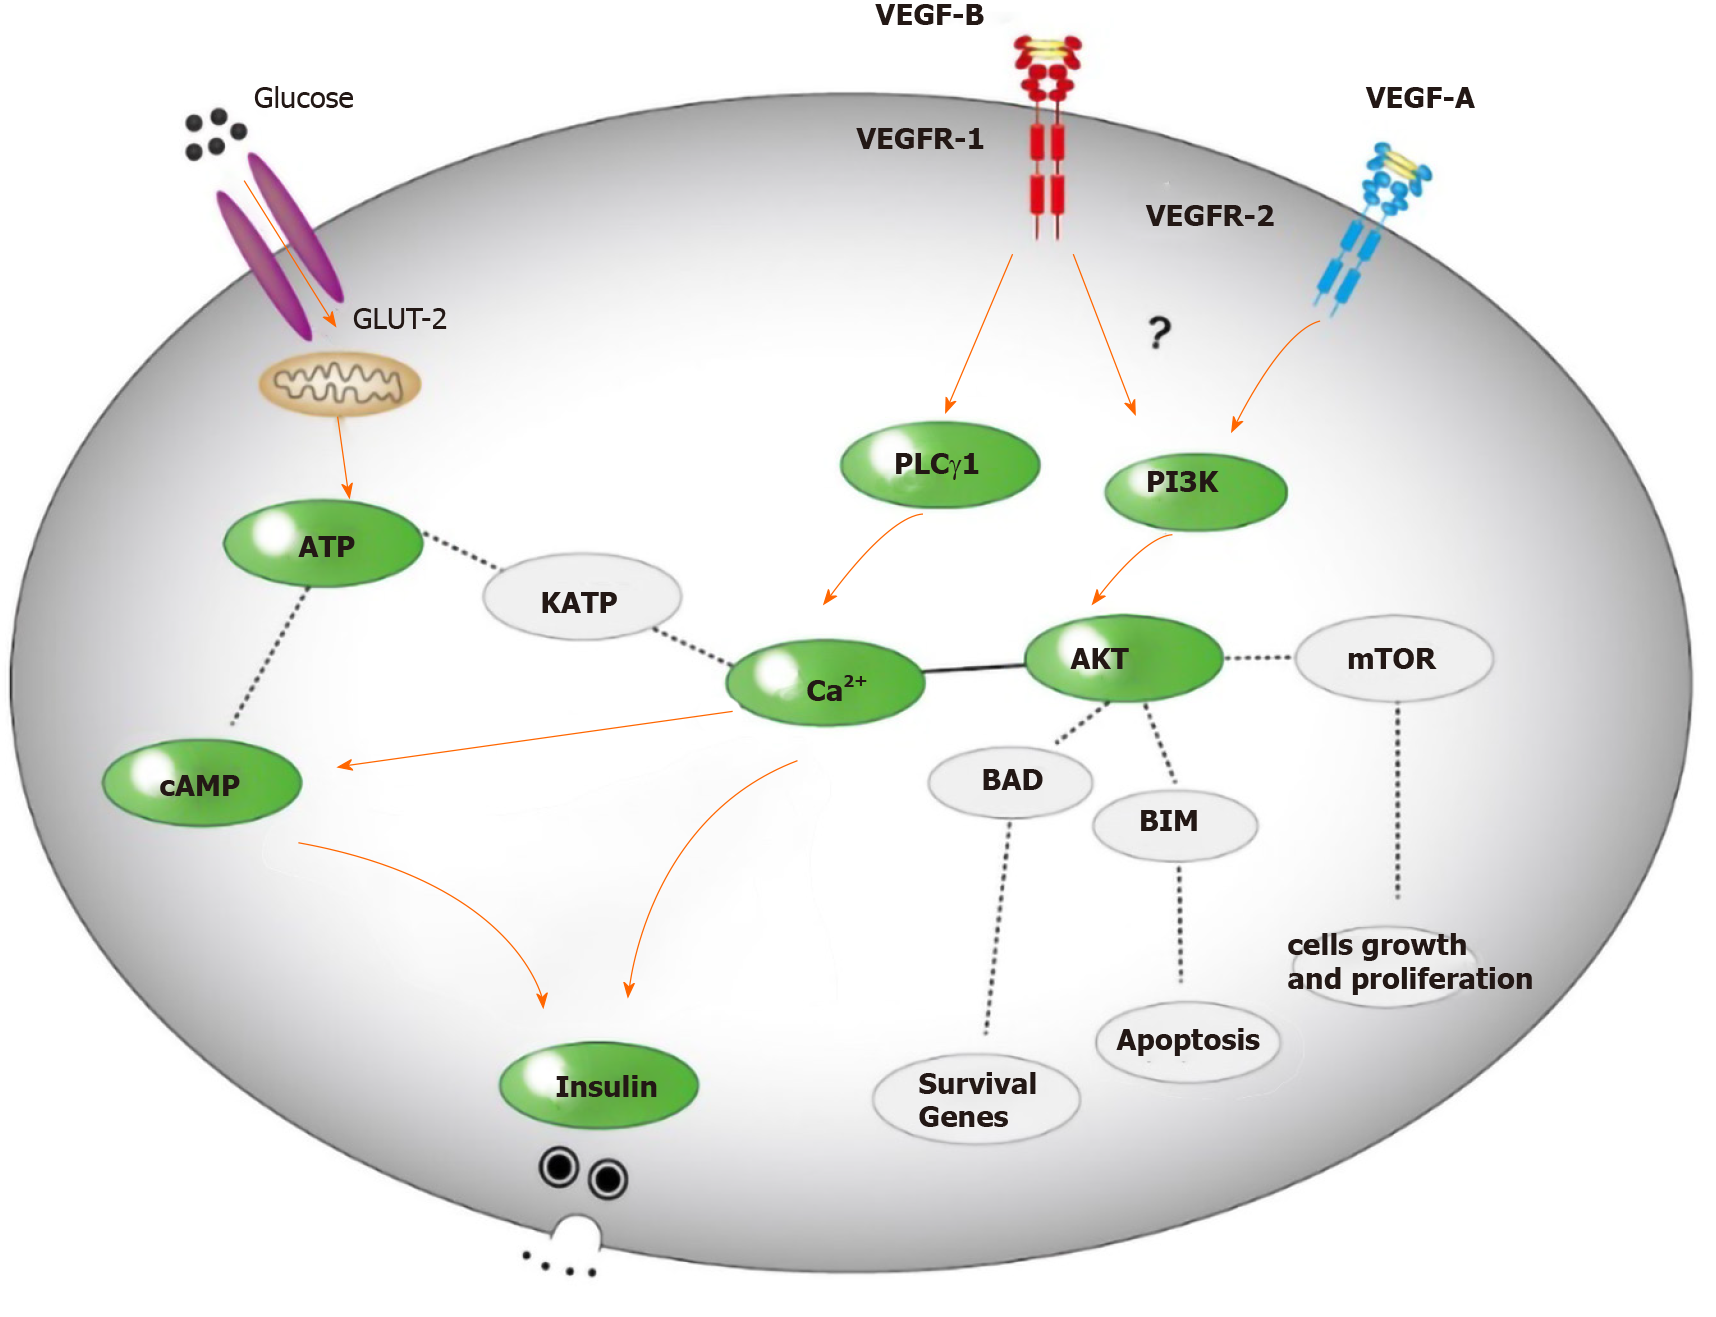
Figure 5
Possible mechanism for VEGF-B to regulate insulin secretion.
- Citation: Jia JD, Jiang WG, Luo X, Li RR, Zhao YC, Tian G, Li YN. Vascular endothelial growth factor B inhibits insulin secretion in MIN6 cells and reduces Ca2+ and cyclic adenosine monophosphate levels through PI3K/AKT pathway. World J Diabetes 2021; 12(4): 480-498
- URL: https://www.wjgnet.com/1948-9358/full/v12/i4/480.htm
- DOI: https://dx.doi.org/10.4239/wjd.v12.i4.480


