Copyright
©The Author(s) 2021.
World J Diabetes. Apr 15, 2021; 12(4): 453-465
Published online Apr 15, 2021. doi: 10.4239/wjd.v12.i4.453
Published online Apr 15, 2021. doi: 10.4239/wjd.v12.i4.453
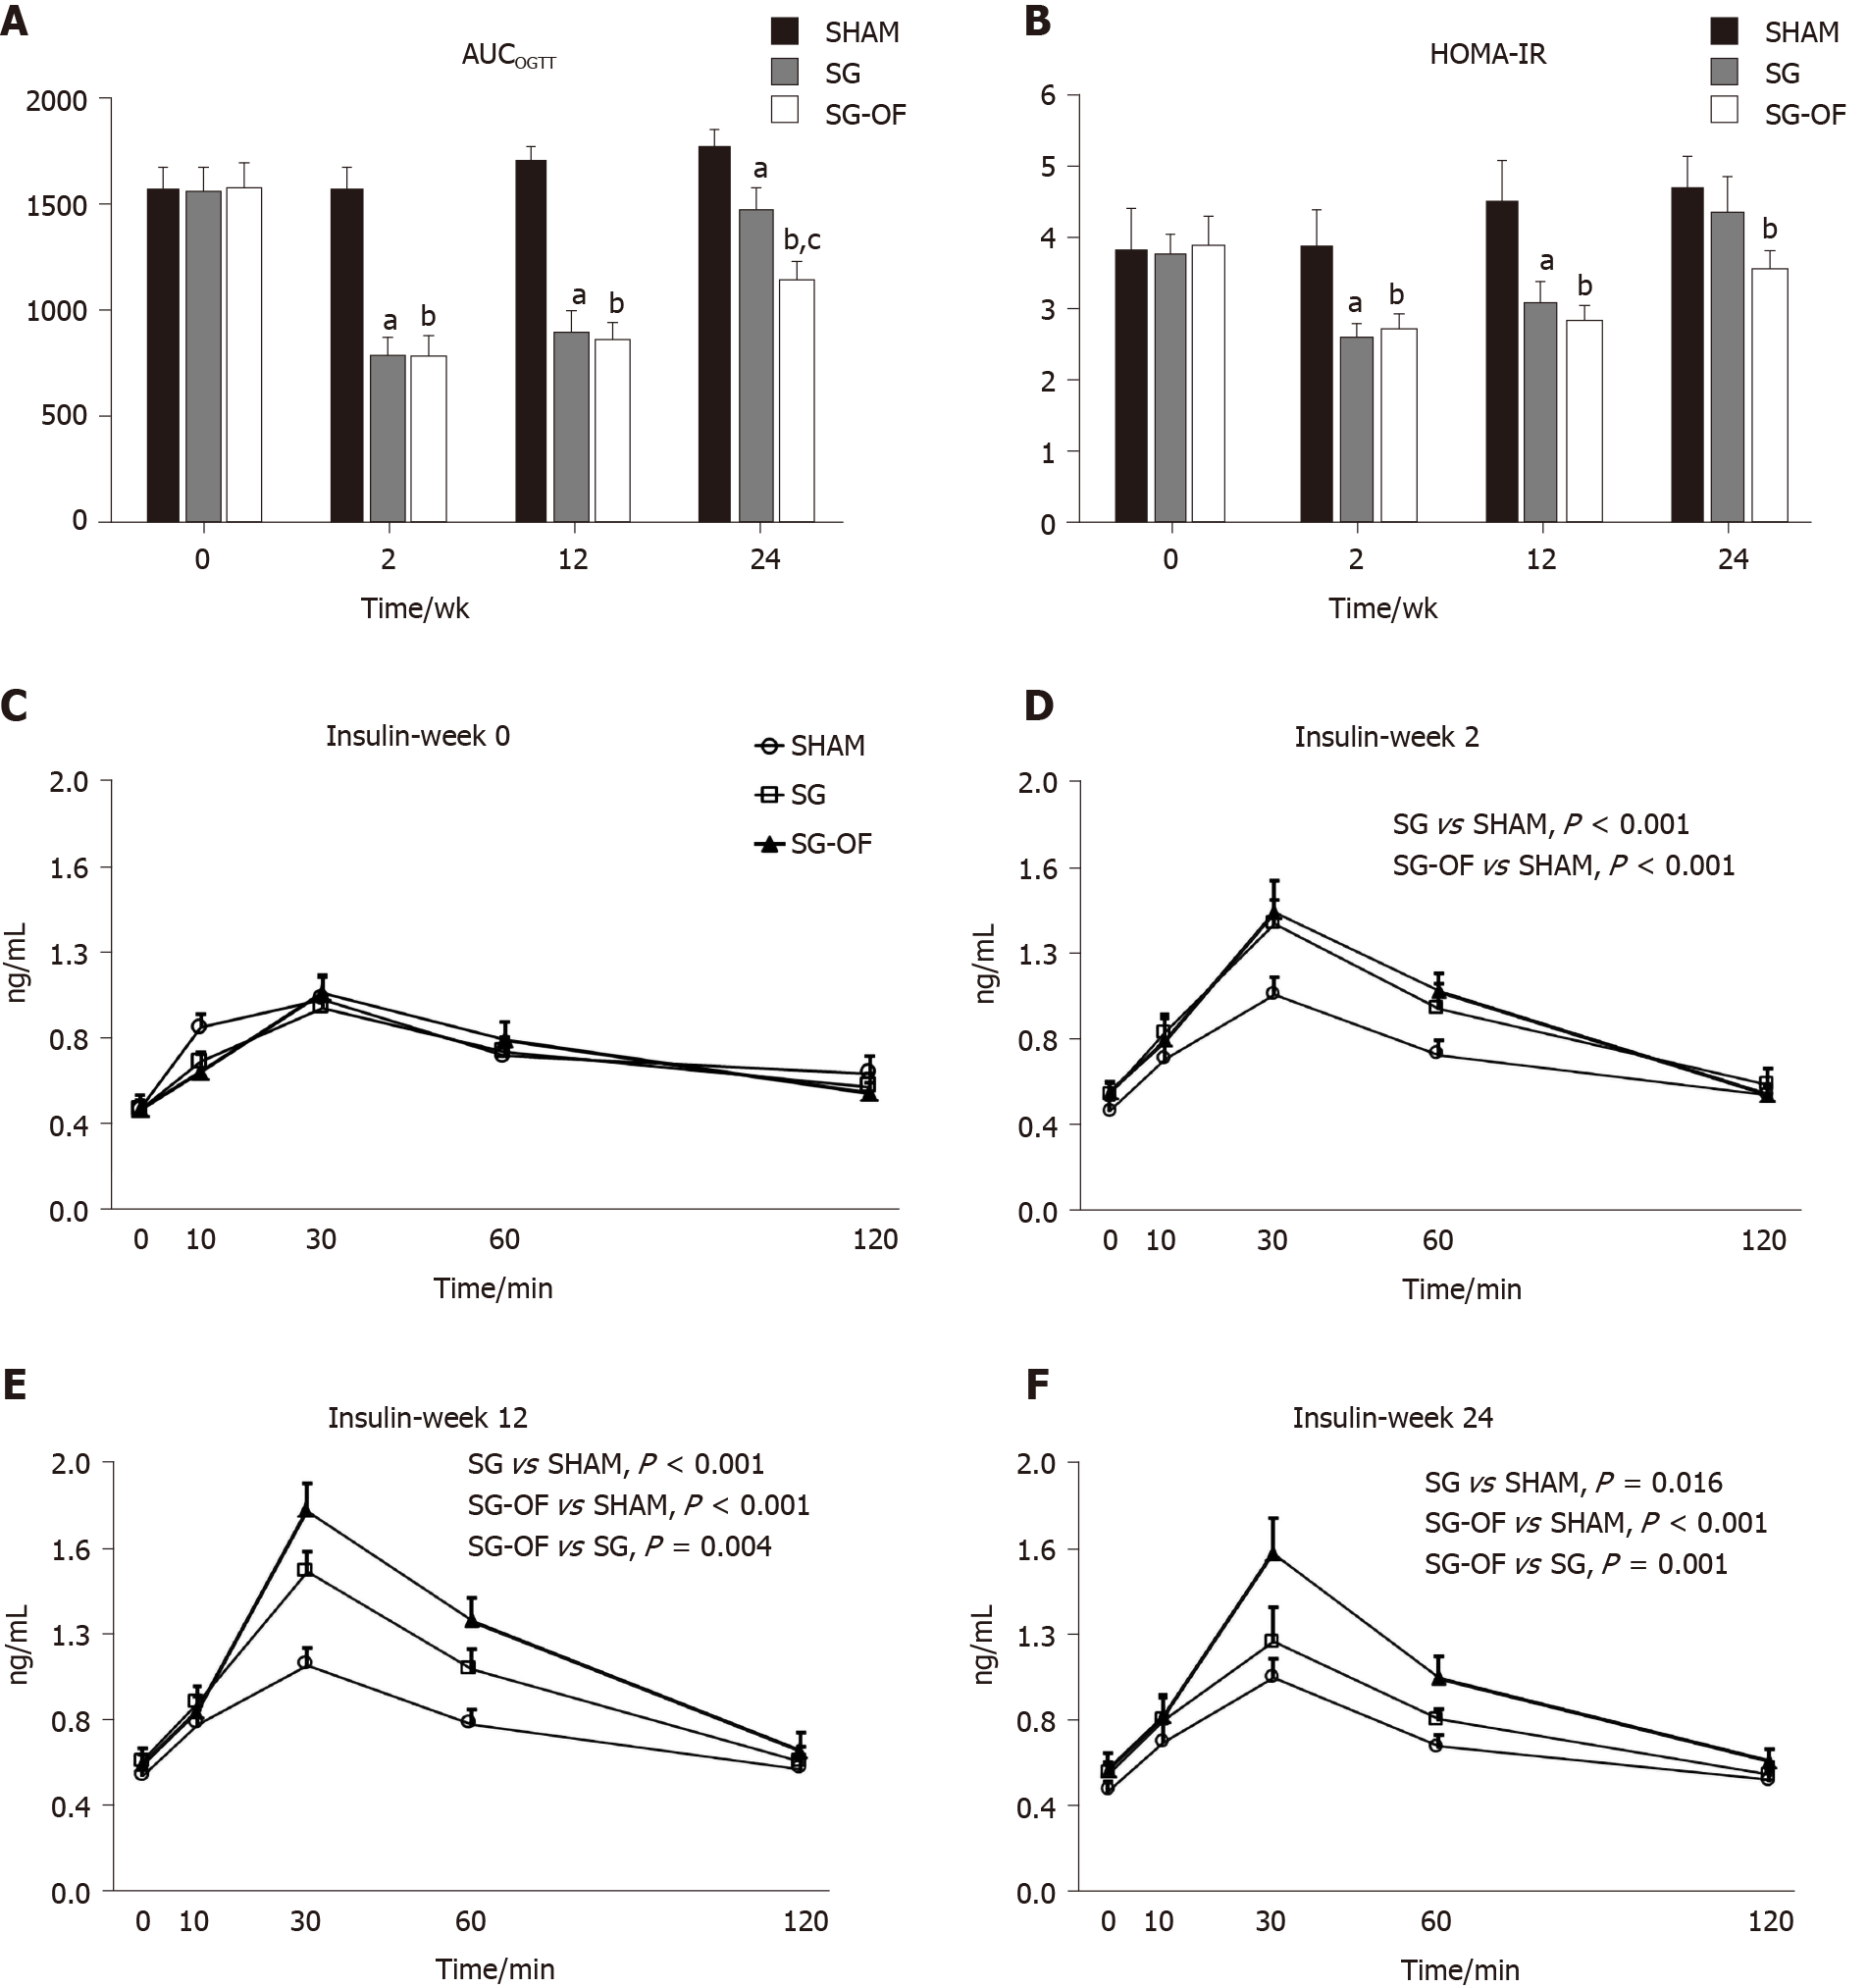
Figure 1 Areas under the curves for oral glucose tolerance test, homeostasis model assessment of insulin resistance, and serum insulin levels.
A: Areas under the curves for oral glucose tolerance test; B: Homeostasis model assessment of insulin resistance; C-F: Serum insulin levels measured during the oral glucose tolerance test at baseline and 2, 12, and 24 wk after surgery [aP < 0.001, SHAM vs sleeve gastrectomy (SG); bP < 0.001, SHAM vs SG-oligofructose (SG-OF); cP < 0.001, SG vs SG-OF]. The concentration of insulin during the oral glucose tolerance test was analyzed using mixed model ANOVA followed by Bonferroni post hoc comparison. The P value is shown in the rectangular frame. A statistically significant difference was considered at P < 0.05. AUCOGTT: Areas under the curves for oral glucose tolerance test; SG-OF: Sleeve gastrectomy-oligofructose; HOMA-IR: Homeostasis model assessment of insulin resistance.
Figure 2 Fasting serum triglyceride and cholesterol levels.
A: Fasting serum triglyceride levels; B: Fasting serum cholesterol levels [aP < 0.05, bP < 0.001, SHAM vs sleeve gastrectomy (SG); cP < 0.05, dP < 0.001, SHAM vs SG-oligofructose (SG-OF); eP < 0.001, SG vs SG-OF]. A statistically significant difference was considered at P < 0.05. SG-OF: Sleeve gastrectomy-oligofructose.
Figure 3 Body weight and calorie intake.
A: Body weight measured at baseline and 2, 12, and 24 wk after surgery; B: Calorie intake measured at baseline and 2, 12, and 24 wk after surgery [aP < 0.05, bP < 0.01, cP < 0.001, SHAM vs sleeve gastrectomy (SG); dP < 0.01, eP < 0.001, SHAM vs SG-oligofructose (SG-OF); fP < 0.01, gP < 0.001, SG vs SG-OF]. A statistically significant difference was considered at P < 0.05. SG-OF: Sleeve gastrectomy-oligofructose.
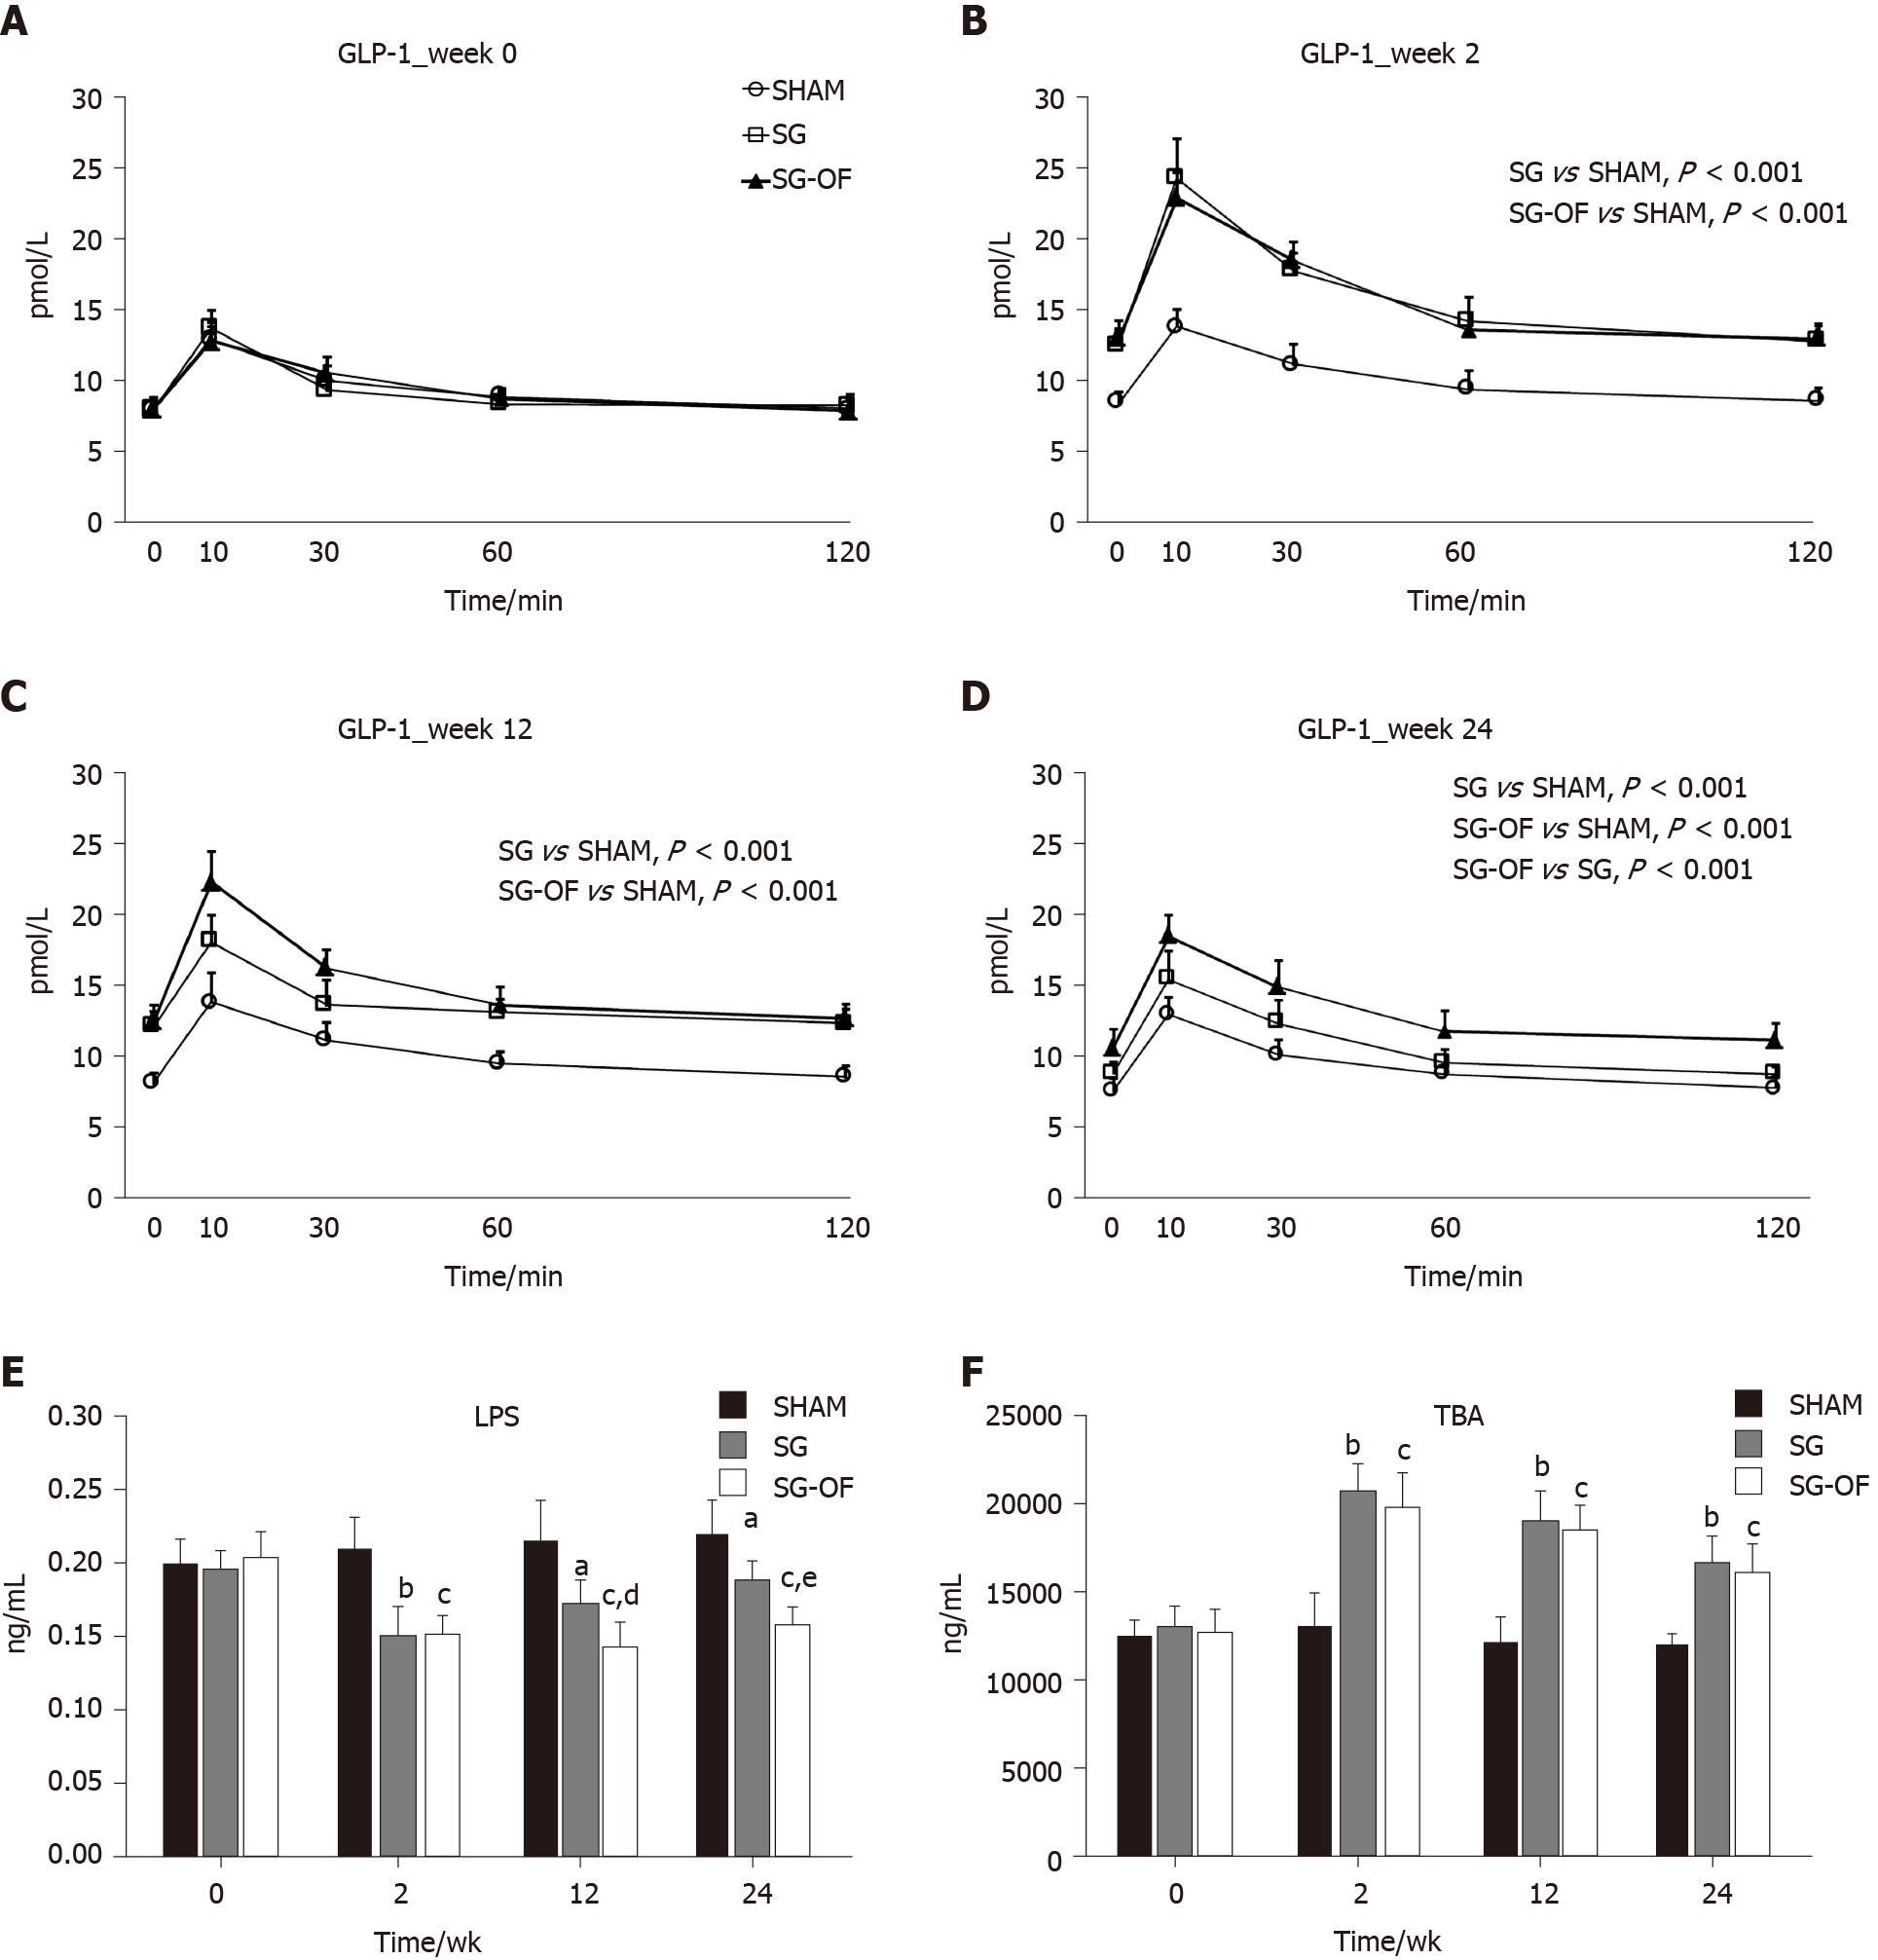
Figure 4 Glucagon-like peptide 1, fasting serum lipopolysaccharide, and total bile acids levels.
A-D: Fasting serum glucagon-like peptide 1 levels measured at baseline and 2, 12, and 24 wk after surgery. The P value is shown in a rectangular frame; E: Fasting serum lipopolysaccharide; F: Total bile acids [aP < 0.01, bP < 0.001, SHAM vs sleeve gastrectomy (SG); cP < 0.001, SHAM vs SG-oligofructose (SG-OF); dP < 0.05, eP < 0.01, SG vs SG-OF]. A statistically significant difference was considered at P < 0.05. GLP-1: Glucagon-like peptide 1; LPS: Lipopolysaccharide; TBA: Total bile acids; SG-OF: Sleeve gastrectomy-oligofructose.
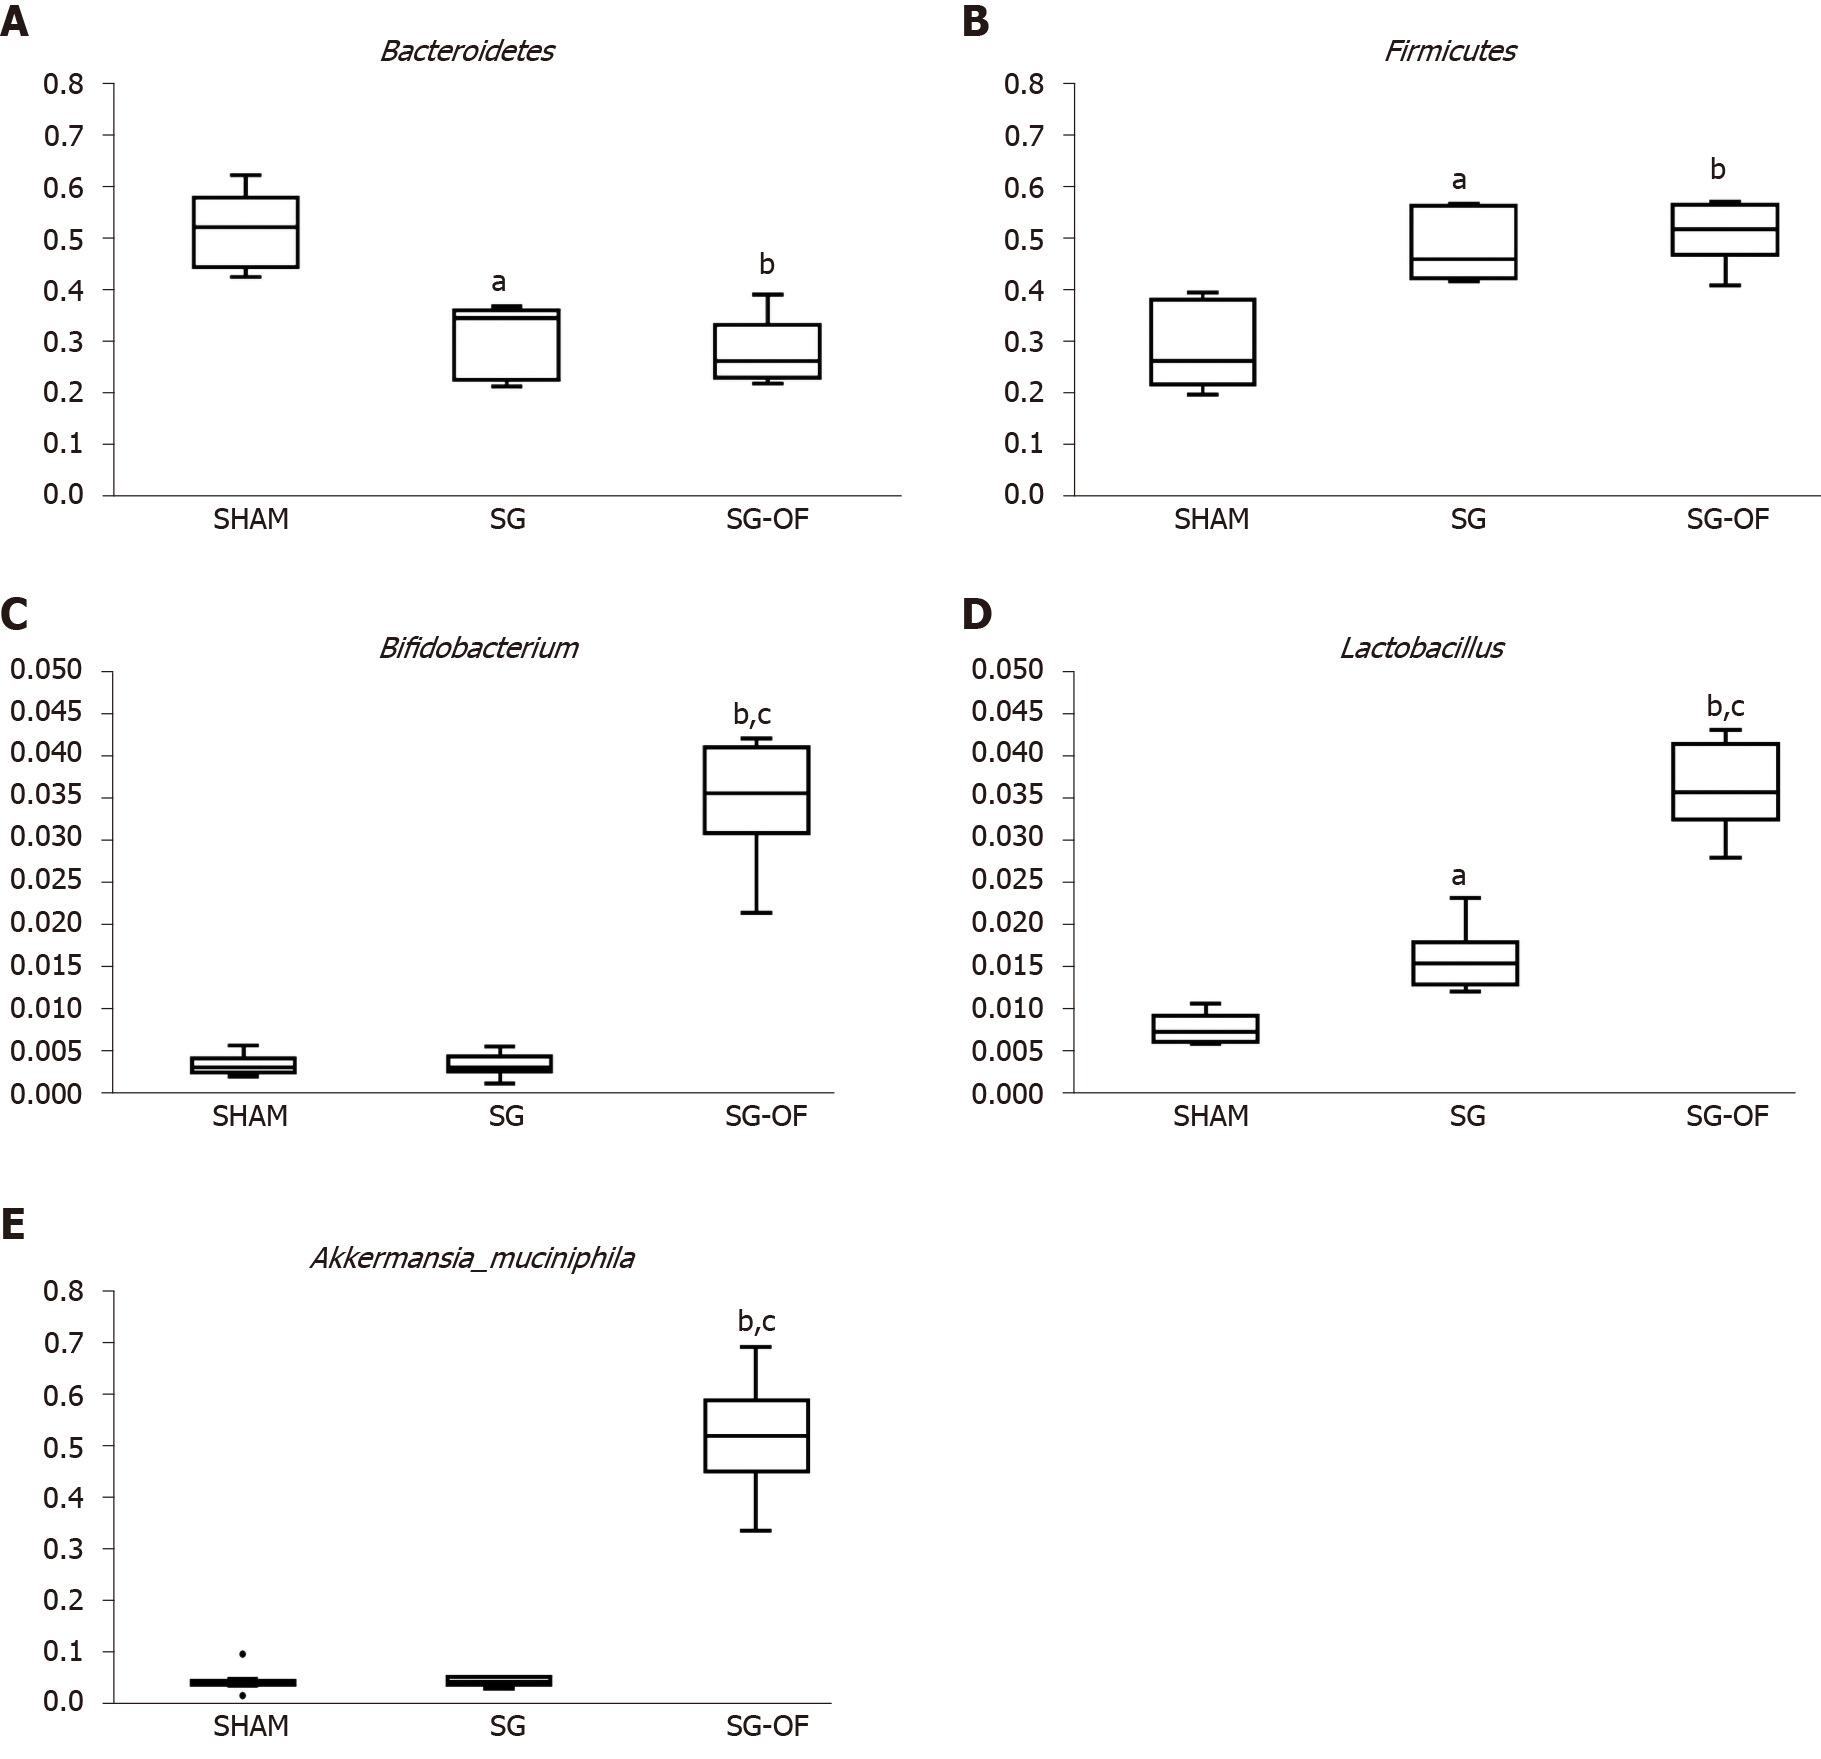
Figure 5 Gut microbiota.
A: Bacteroidetes; B: Firmicutes; C: Bifidobacterium; D: Lactobacillus; E: Akkermansia_muciniphila. The relative abundances of Bacteroidetes, Firmicutes, Bifidobacterium, Lactobacillus, and Akkermansia_muciniphila between groups were analyzed using the ANOVA and a statistically significant difference was considered at P < 0.05 (aP < 0.001, SHAM vs sleeve gastrectomy (SG); bP < 0.001, SHAM vs SG-oligofructose (SG-OF); cP < 0.001, SG vs SG-OF). SG-OF: Sleeve gastrectomy-oligofructose.
- Citation: Zhong MW, Li Y, Cheng YG, Liu QR, Hu SY, Zhang GY. Effect of oligofructose on resistance to postoperative high-fat diet-induced damage of metabolism in diabetic rats after sleeve gastrectomy. World J Diabetes 2021; 12(4): 453-465
- URL: https://www.wjgnet.com/1948-9358/full/v12/i4/453.htm
- DOI: https://dx.doi.org/10.4239/wjd.v12.i4.453


