Copyright
©The Author(s) 2021.
World J Diabetes. Dec 15, 2021; 12(12): 2050-2057
Published online Dec 15, 2021. doi: 10.4239/wjd.v12.i12.2050
Published online Dec 15, 2021. doi: 10.4239/wjd.v12.i12.2050
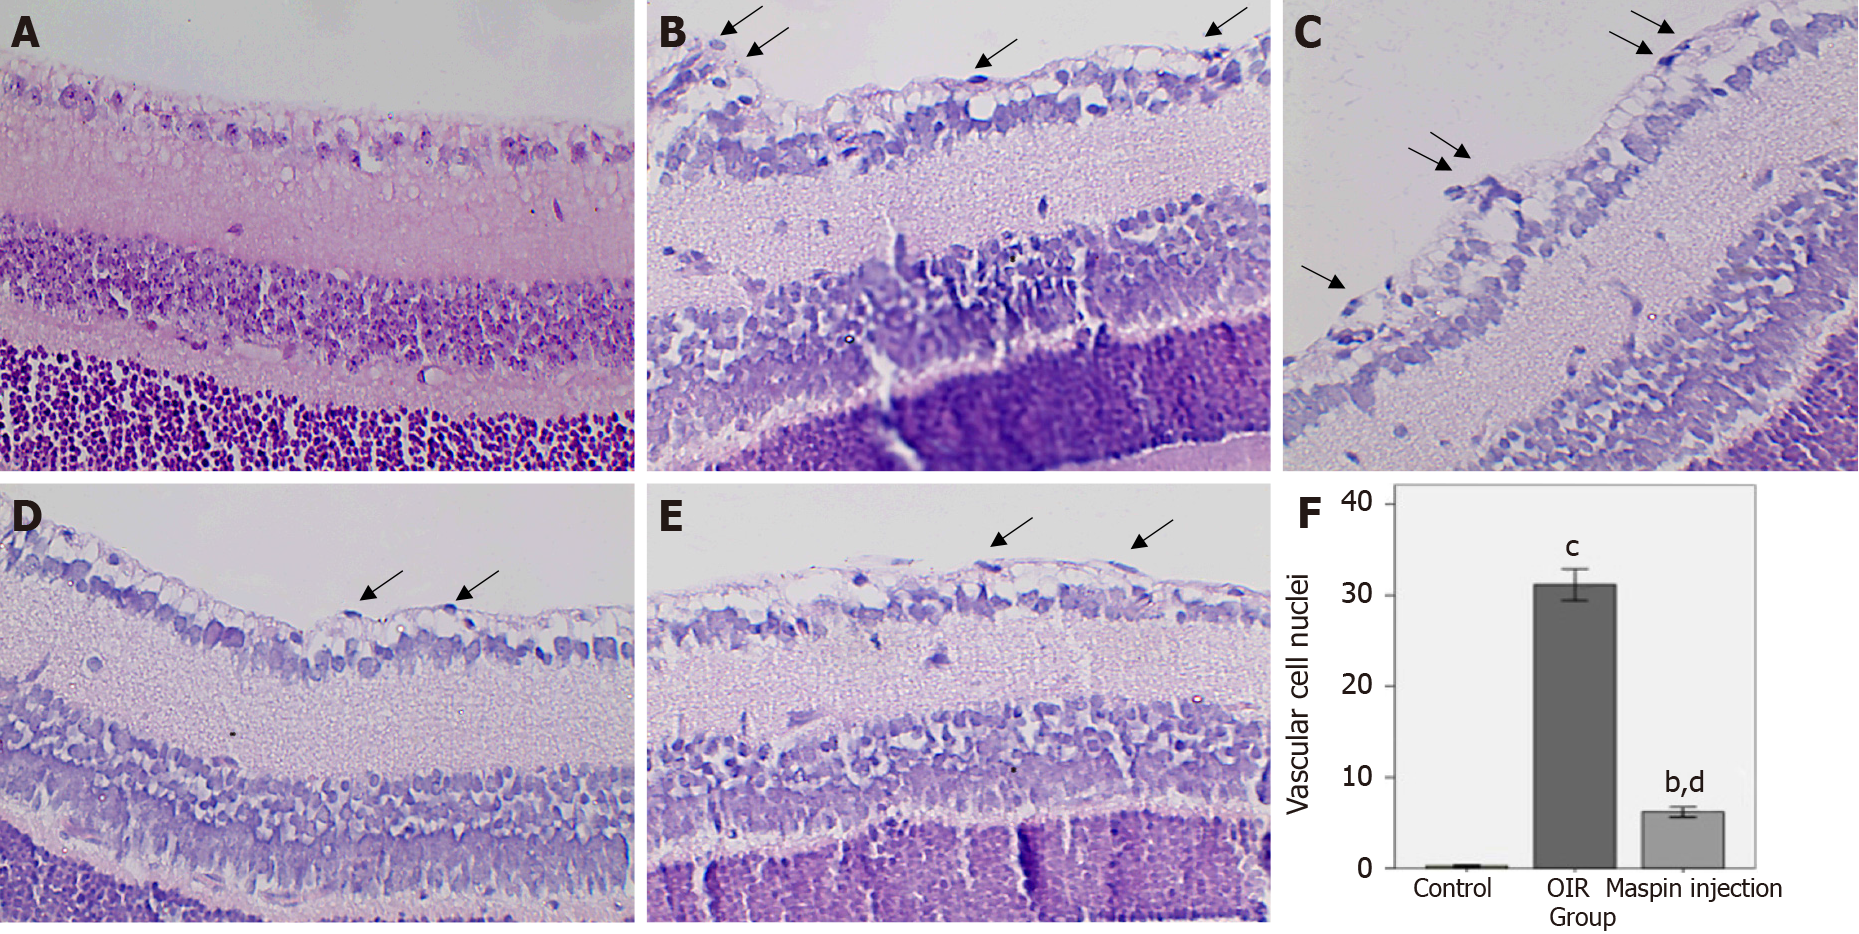
Figure 1 Retinal neovascularization was determined by counting the vascular cell nuclei (arrow) breaking through the inner limiting membrane on postnatal day 17.
A: No nuclei were detected in the normal control group; B, C: There were many pathologic neovascular tufts beyond the inner limiting membrane (ILM) in the oxygen-induced retinopathy (OIR) group; D, E: Fewer vascular cell nuclei broke through the ILM in the maspin injection OIR group than in the OIR group but more than that in the normal control group. Magnification ×400; F: Data are means ± SD. bP < 0.01 vs normal control group; cP < 0.001 vs normal control group; dP < 0.01 vs the OIR group. OIR: Oxygen-induced retinopathy.
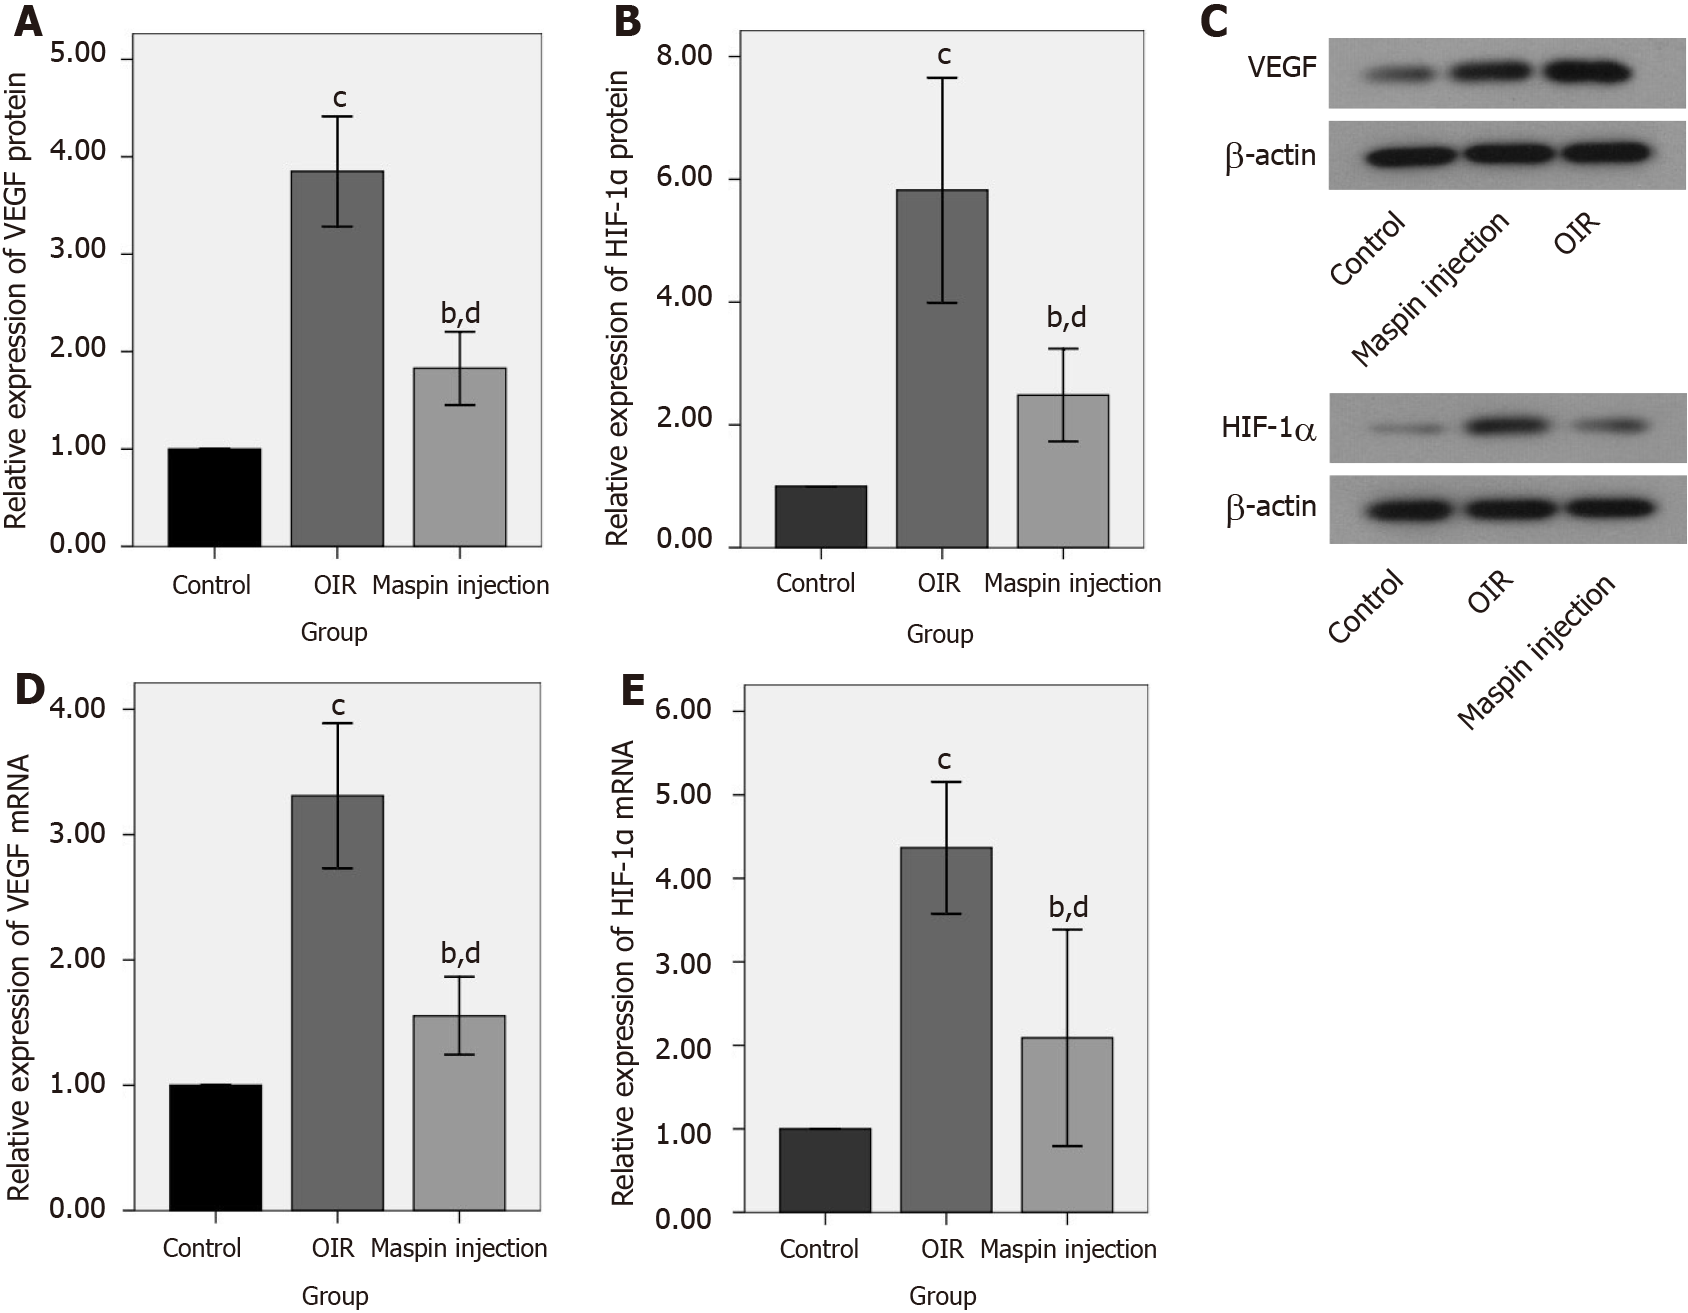
Figure 2 Maspin downregulated vascular endothelial growth factor and hypoxia-inducible factor 1-alpha expression in the maspin injection oxygen-induced retinopathy group.
A, B, C: Relative protein expression of vascular endothelial growth factor (VEGF) and hypoxia-inducible factor 1-alpha (HIF-1α) were determined by western blotting; D, E: Relative mRNA expression of VEGF and HIF-1α were assayed by real-time polymerase chain reaction. Data are means ± SD. bP < 0.01 vs normal control group; cP < 0.001 vs normal control group; dP < 0.01 vs oxygen-induced retinopathy group. VEGF: Vascular endothelial growth factor; HIF-1α: Hypoxia-inducible factor 1-alpha; OIR: Oxygen-induced retinopathy.
- Citation: Qiu F, Tong HJ. Inhibitory effect of maspinon neovascularization in diabetic retinopathy. World J Diabetes 2021; 12(12): 2050-2057
- URL: https://www.wjgnet.com/1948-9358/full/v12/i12/2050.htm
- DOI: https://dx.doi.org/10.4239/wjd.v12.i12.2050


