Published online Sep 15, 2024. doi: 10.4251/wjgo.v16.i9.4014
Revised: July 19, 2024
Accepted: July 30, 2024
Published online: September 15, 2024
Processing time: 80 Days and 2.6 Hours
Cholangiocarcinoma (CCA) is a lethal malignancy with limited treatment options and poor prognosis. The PEA3 subfamily of E26 transformation specific genes: ETV1, ETV4, and ETV5 are known to play significant roles in various cancers by influencing cell proliferation, invasion, and metastasis.
To analyze PEA3 subfamily gene expression levels in CCA and their correlation with clinical parameters to determine their prognostic value for CCA.
The expression levels of PEA3 subfamily genes in pan-cancer and CCA data in the cancer genome atlas and genotype-tissue expression project databases were an
ETV1, ETV4, and ETV5 expression levels were significantly increased in CCA. There were significant differences in ETV1, ETV4, and ETV5 expression levels among the different subtypes of CCA, and predictive analysis revealed that only high ETV1 and ETV4 expression levels were significantly associated with shorter overall survival in patients with CCA. GO/KEGG analysis revealed that PEA3 subfamily genes were closely related to transcriptional misregulation in cancer. In vitro and in vivo experiments revealed that PEA3 silencing inhibited the invasion and metastasis of CCA cells.
The expression level of ETV4 may be a predictive biomarker of survival in patients with CCA.
Core Tip: This study investigates the expression of the PEA3 subfamily genes (ETV1, ETV4, ETV5) in cholangiocarcinoma (CCA) and their clinical relevance. Using data from cancer genome atlas and genotype-tissue expression project databases, we identified significantly elevated levels of ETV1, ETV4 and ETV5 in CCA. High expression of ETV1 and ETV4 was explicitly correlated with shorter overall survival in CCA patients. Functional assays demonstrated that silencing PEA3 genes reduces invasion and metastasis in CCA cells in vitro and in vivo. These findings suggest that ETV4 may be a valuable prognostic biomarker for survival of CCA patients.
- Citation: Wang L, Zhang Z, Ma HZ. Prognostic value of PEA3 subfamily gene expression in cholangiocarcinoma. World J Gastrointest Oncol 2024; 16(9): 4014-4027
- URL: https://www.wjgnet.com/1948-5204/full/v16/i9/4014.htm
- DOI: https://dx.doi.org/10.4251/wjgo.v16.i9.4014
Cholangiocarcinoma (CCA) is a malignancy arising from bile duct epithelial cells. Although CCAs are rare, accounting for only 3% of gastrointestinal tumors, they are highly aggressive and have a poor prognosis[1,2]. CCAs can be divided into intrahepatic CCAs, perihilar CCAs, and distal CCAs according to anatomical location, with perihilar CCAs being the most common type, accounting for more than 60% of biliary tract tumors. Surgical resection is currently the treatment of choice and the treatment most likely to provide a cure. Most inoperable perihilar CCAs have a poor prognosis, with a median patient survival of less than one year[3].
Moreover, many CCAs are discovered at an advanced stage, which seriously affects patients’ survival rates. Therefore, early screening for CCAs is essential for increasing survival. Although several previous studies have established omics profiles to reveal the underlying pathogenesis of CCA, there is still a lack of biomarkers for early diagnosis and pre
The PEA3 subfamily, a subset of the E26 transformation-specific (ETS) family, comprises the protein-coding genes ETV1, ETV4, and ETV5. These genes are overexpressed in various cancers and function as transcription factors that re
Unfortunately, research on CCA is limited because of insufficient relevant data. However, with advances in informa
TCGA and GTEx Toil RNA-Seq data were downloaded from University of California Santa Cruz Xena (https://xenabrowser.net/data pages/). The expression data were first quantified in transcripts per kilobase million and then transformed[7]. There were 36 and 9 cancer and noncancer tissue samples in the CCA TCGA dataset. The R package “Limma” was used to compare the expression levels of PEA3 subfamily genes between pancancer and CCA. Visualization of the data was performed using the ggplot2 R package.
The CCA cell lines Rihoku bile duct epithelial (RBE) and human cholangiocarcinoma cells (HCCC)-9810 were purchased from the Cell Bank of the Chinese Academy of Sciences (Shanghai, China). The cells were all maintained in F-12K medium (Cytiva, China) supplemented with 100 mL/L fetal bovine serum (Cytiva, China), penicillin (100 μg/mL), and streptomycin (100 μg/mL). All the cells were incubated in a humidified incubator with 50 mL/L carbon dioxide (CO2) air at 37 °C. The medium was changed every 2 d, and the cells were passaged when they reached 70%-90% confluence.
In this experiment, 4-6 weeks BALB/c male nude mice (Shanghai BK Company, China) weighing 20-25 g were used, and all mice were raised in the specific pathogen-free animal room of Zhejiang University of Traditional Chinese Medicine. Zhejiang University of Traditional Chinese Medicine provided the feed and bedding used in the experiment. The feeding process followed the guidelines of the Animal Protection and Use Committee of Zhejiang University of Traditional Chinese Medicine. This study was approved by the Animal Ethics Committee of Zhejiang University of Traditional Chinese Medicine (ethical batch number: IACUC-20230410-21).
The number of HCCC-9810 cells transfected with the NC-vector or shRNA-PEA3 was adjusted to 5.0 × 10⁶ cells per milliliter in phosphate buffer saline (PBS). The cell suspension (100 μL) was then injected into the left armpit of BALB/c mice, and mice were regularly evaluated for tumor formation. Approximately six weeks after subcutaneous injection, the BALB/c mice were killed by cervical dislocation, and the size and weight of the subcutaneous tumors were measured.
Gene expression levels were validated based on information in the online database Oncomine[8]. The threshold parame
The level-3 expression, clinicopathological, and prognostic information from the TCGA-cholesterol project were downloaded from the TCGA database. The R packages Survminer (version 0.4.6) and Survival were used for survival analysis[12]. Receiver operating characteristic (ROC) curve analysis was performed using pROC (v1.10.0).
Functional enrichment analysis was performed using the Web Gestalt program. The screening criteria for GO and KEGG analyses were |log fold change| > 0.45, adjusted P consistency < 0.05, and |log fold change| > 0.2, revised P < 0.05, respectively.
Network interaction analysis data related to the three genes in the PEA3 subfamily were obtained from the STRING online database. Homo sapiens ETV1, ETV4, and ETV5 was used as the analysis object, with the minimum interaction requirement score set to 0.400. Text mining was performed, and the database and experiments were used as active interaction sources.
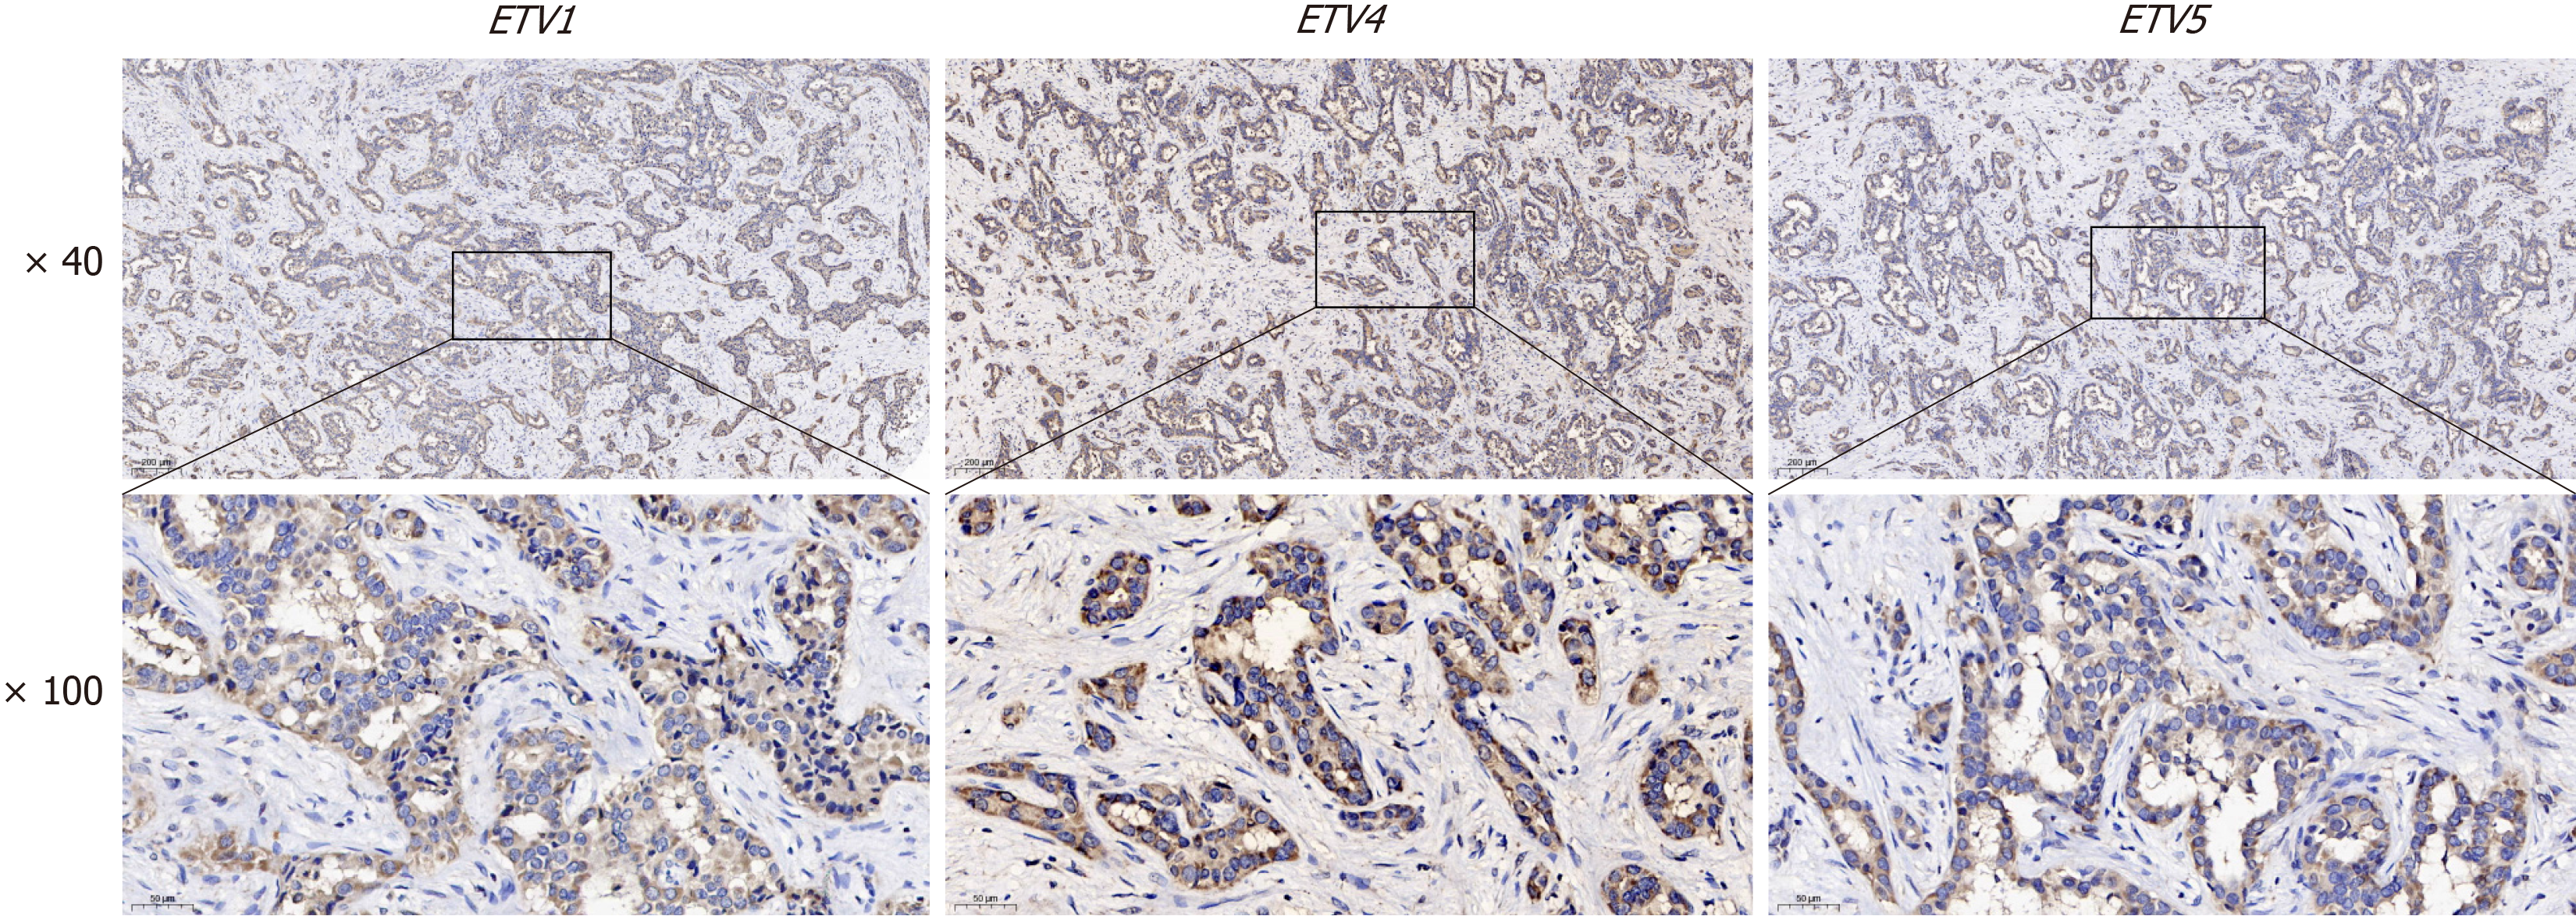
Paraffin sections (5 μm thick) were dewaxed in xylene I and II every 10 min, gradually dehydrated in 100%, 95%, 90%, 80%, and 70% absolute ethanol solutions every 5 min, and then boiled in distilled water for 15 min. After blocking the sections with 100 mL/L serum-containing blocking solution at room temperature for 1 hour, anti-PEA3 (1: 1000; ab189826; Abcam; United States) was added, and sections were incubated with the anti-PEA3 overnight at 4 °C. Sections were then incubated with secondary antibodies at room temperature for 30 min. The horseradish peroxidase-labeled antibodies were developed with diaminobenzidine. After counterstaining with hematoxylin, the sections were dehy
In the top chamber of the Transwell system (8-μm pore), 200 μL of a suspension of CCA cells (5 × 10⁴ cells) was seeded and incubated for 24 hours at 37 °C in the air with 50 mL/L CO2. The bottom of the Transwell chamber was filled with F-12K media supplemented with 200 mL/L fetal bovine serum. Cotton swabs were used to remove nonmigrating cells carefully. The cells were fixed in methanol for 5 min before being stained for 30 min with crystal violet (Beyotime, China). The chambers were gently rinsed with deionized water to remove floating color, and the number of invading cells was counted using a microscope.
CCA cells were plated at a low density (5000 cells/100-mm plate) and incubated for 10 d at 37 °C in 50 mL/L CO2. The medium was removed, and the cells were washed with PBS before fixation with 40 g/L paraformaldehyde at 37 °C for 10 min. After incubation with 5 mL/L crystal violet for 15 min at 37 °C, the wells were washed 3 times with PBS, air dried, and examined for colony morphology. Statistical analysis was performed, and a histogram was constructed after the data from three separate repetitions were analyzed.
The suspension of CCA cells was lysed for 30 min on ice in radio immunoprecipitation assay buffer containing 1 mL/L phenylmethanesulfonyl fluoride (Solarbio, China) and then centrifuged for 10 min (12000 × g, 4 °C). Sodium dodecyl sulfate-polyacrylamide gel electrophoresis (Beyotime, China) was used to resolve total protein, and samples were electro transferred onto polyvinylidene difluoride (PVDF) membranes (Millipore, United States) in transfer buffer. The PVDF membrane was blocked with 5 mL/L skim milk at 37 °C for 2 hours, and the membranes were treated with anti-PEA3 (1: 1000; ab189826; Abcam; United States) at 4 °C overnight. The membranes were subsequently incubated with Horseradish Peroxidase-conjugated goat anti-rabbit IgG (Servicebio, China) at 37 °C for 2 hours. β-actin was used as a loading control for Western blots. A sensitive enhanced chemiluminescence kit (Meilunbio, China) was used to measure the immunoreactivity of the bands, which were visualized with the General Electric AI800 gel imaging system.
CCA cells were transfected with standard control shRNA or PEA3-shRNA from Shandong Weizhen Co., Ltd (Shandong province, China) using Lipofectamine 2000 reagent (Thermo Fisher Scientific, Invitrogen, United States) according to the manufacturer’s instructions. Transfection efficiency was examined by Western blot.
R version 4.0.3 from the R Studio software package and statistical product and service solutions (SPSS) 19.0 software (SPSS, Inc., Chicago, IL, United States) were used for statistical analysis. The R packages Survminerand Survival were used for survival analysis. ROC analysis was performed using pROC. The differences between shRNA-PEA3 and control cells in vivo and in vitro were evaluated using independent sample t-tests. P < 0.05 was considered statistically significant in all comparisons.
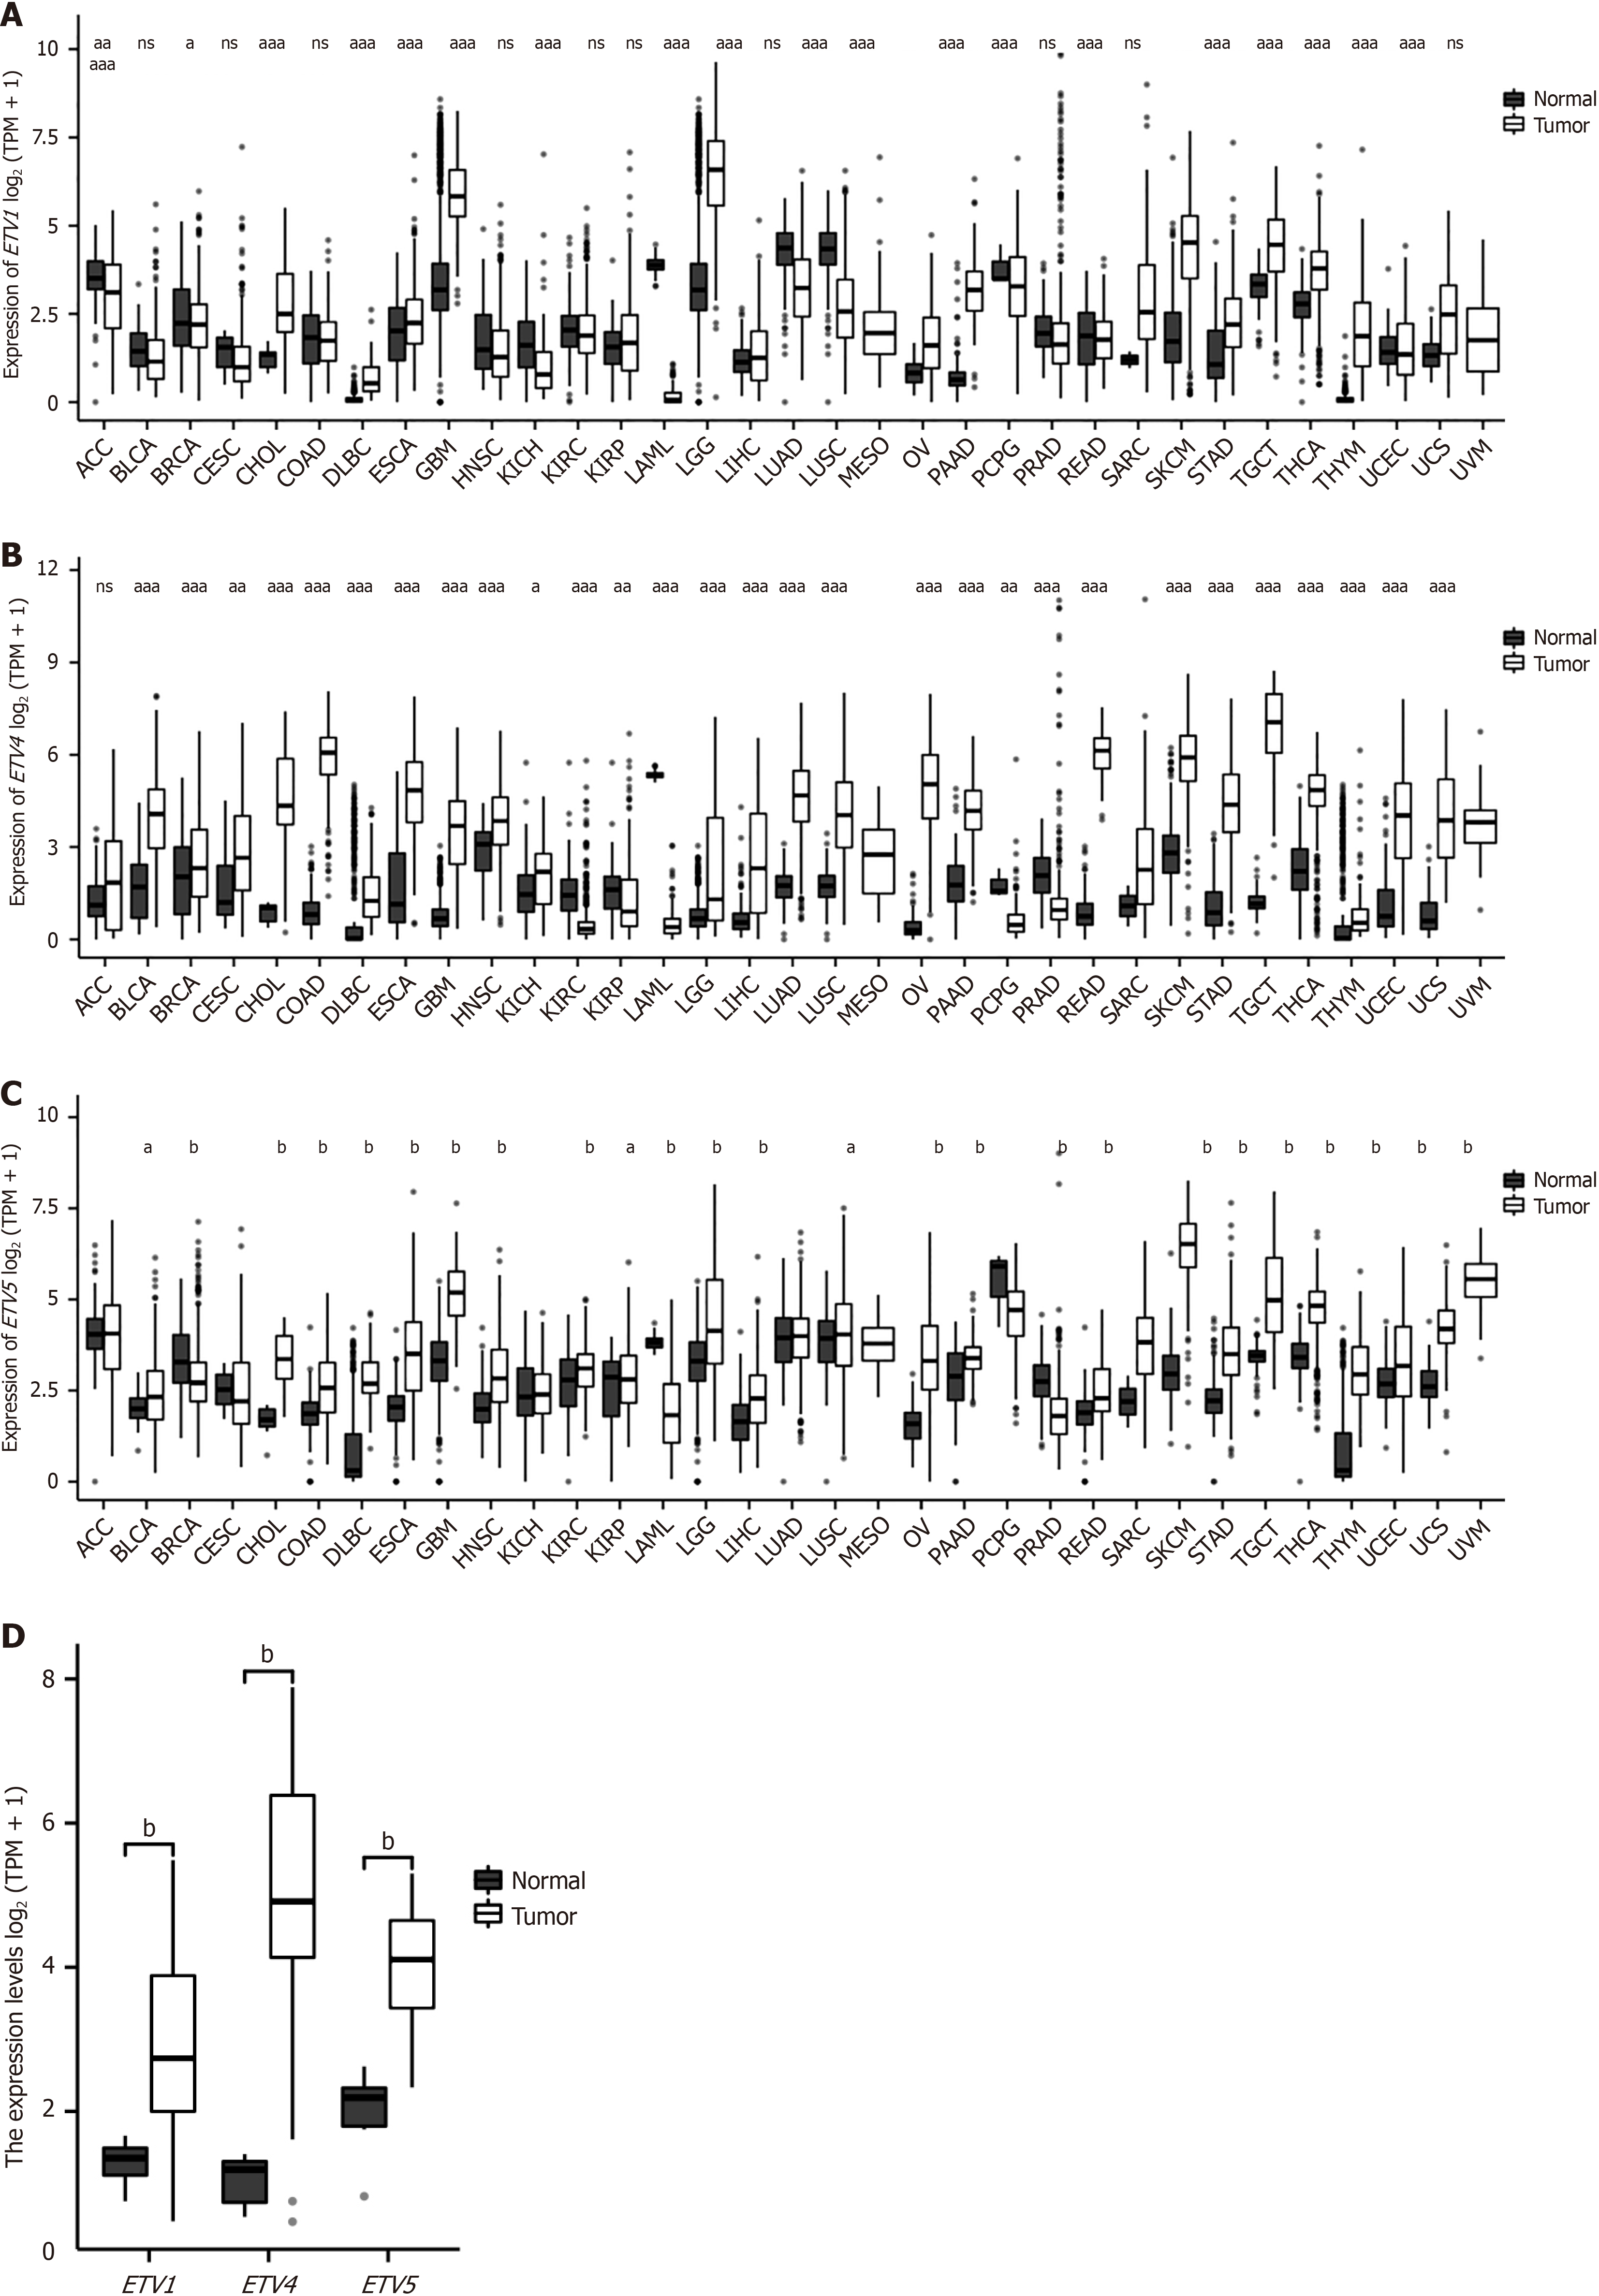
First, we compared the expression levels of PEA3 subfamily genes and found that these genes were overexpressed in many cancers, indicating that PEA3 subfamily genes primarily depend on cancer type (Figure 1A-C). Second, we confirmed that the Oncomine database showed the same results (Figure 1D). The results also revealed that ETV1, ETV4, and ETV5 were highly expressed in CCA (Figure 2).
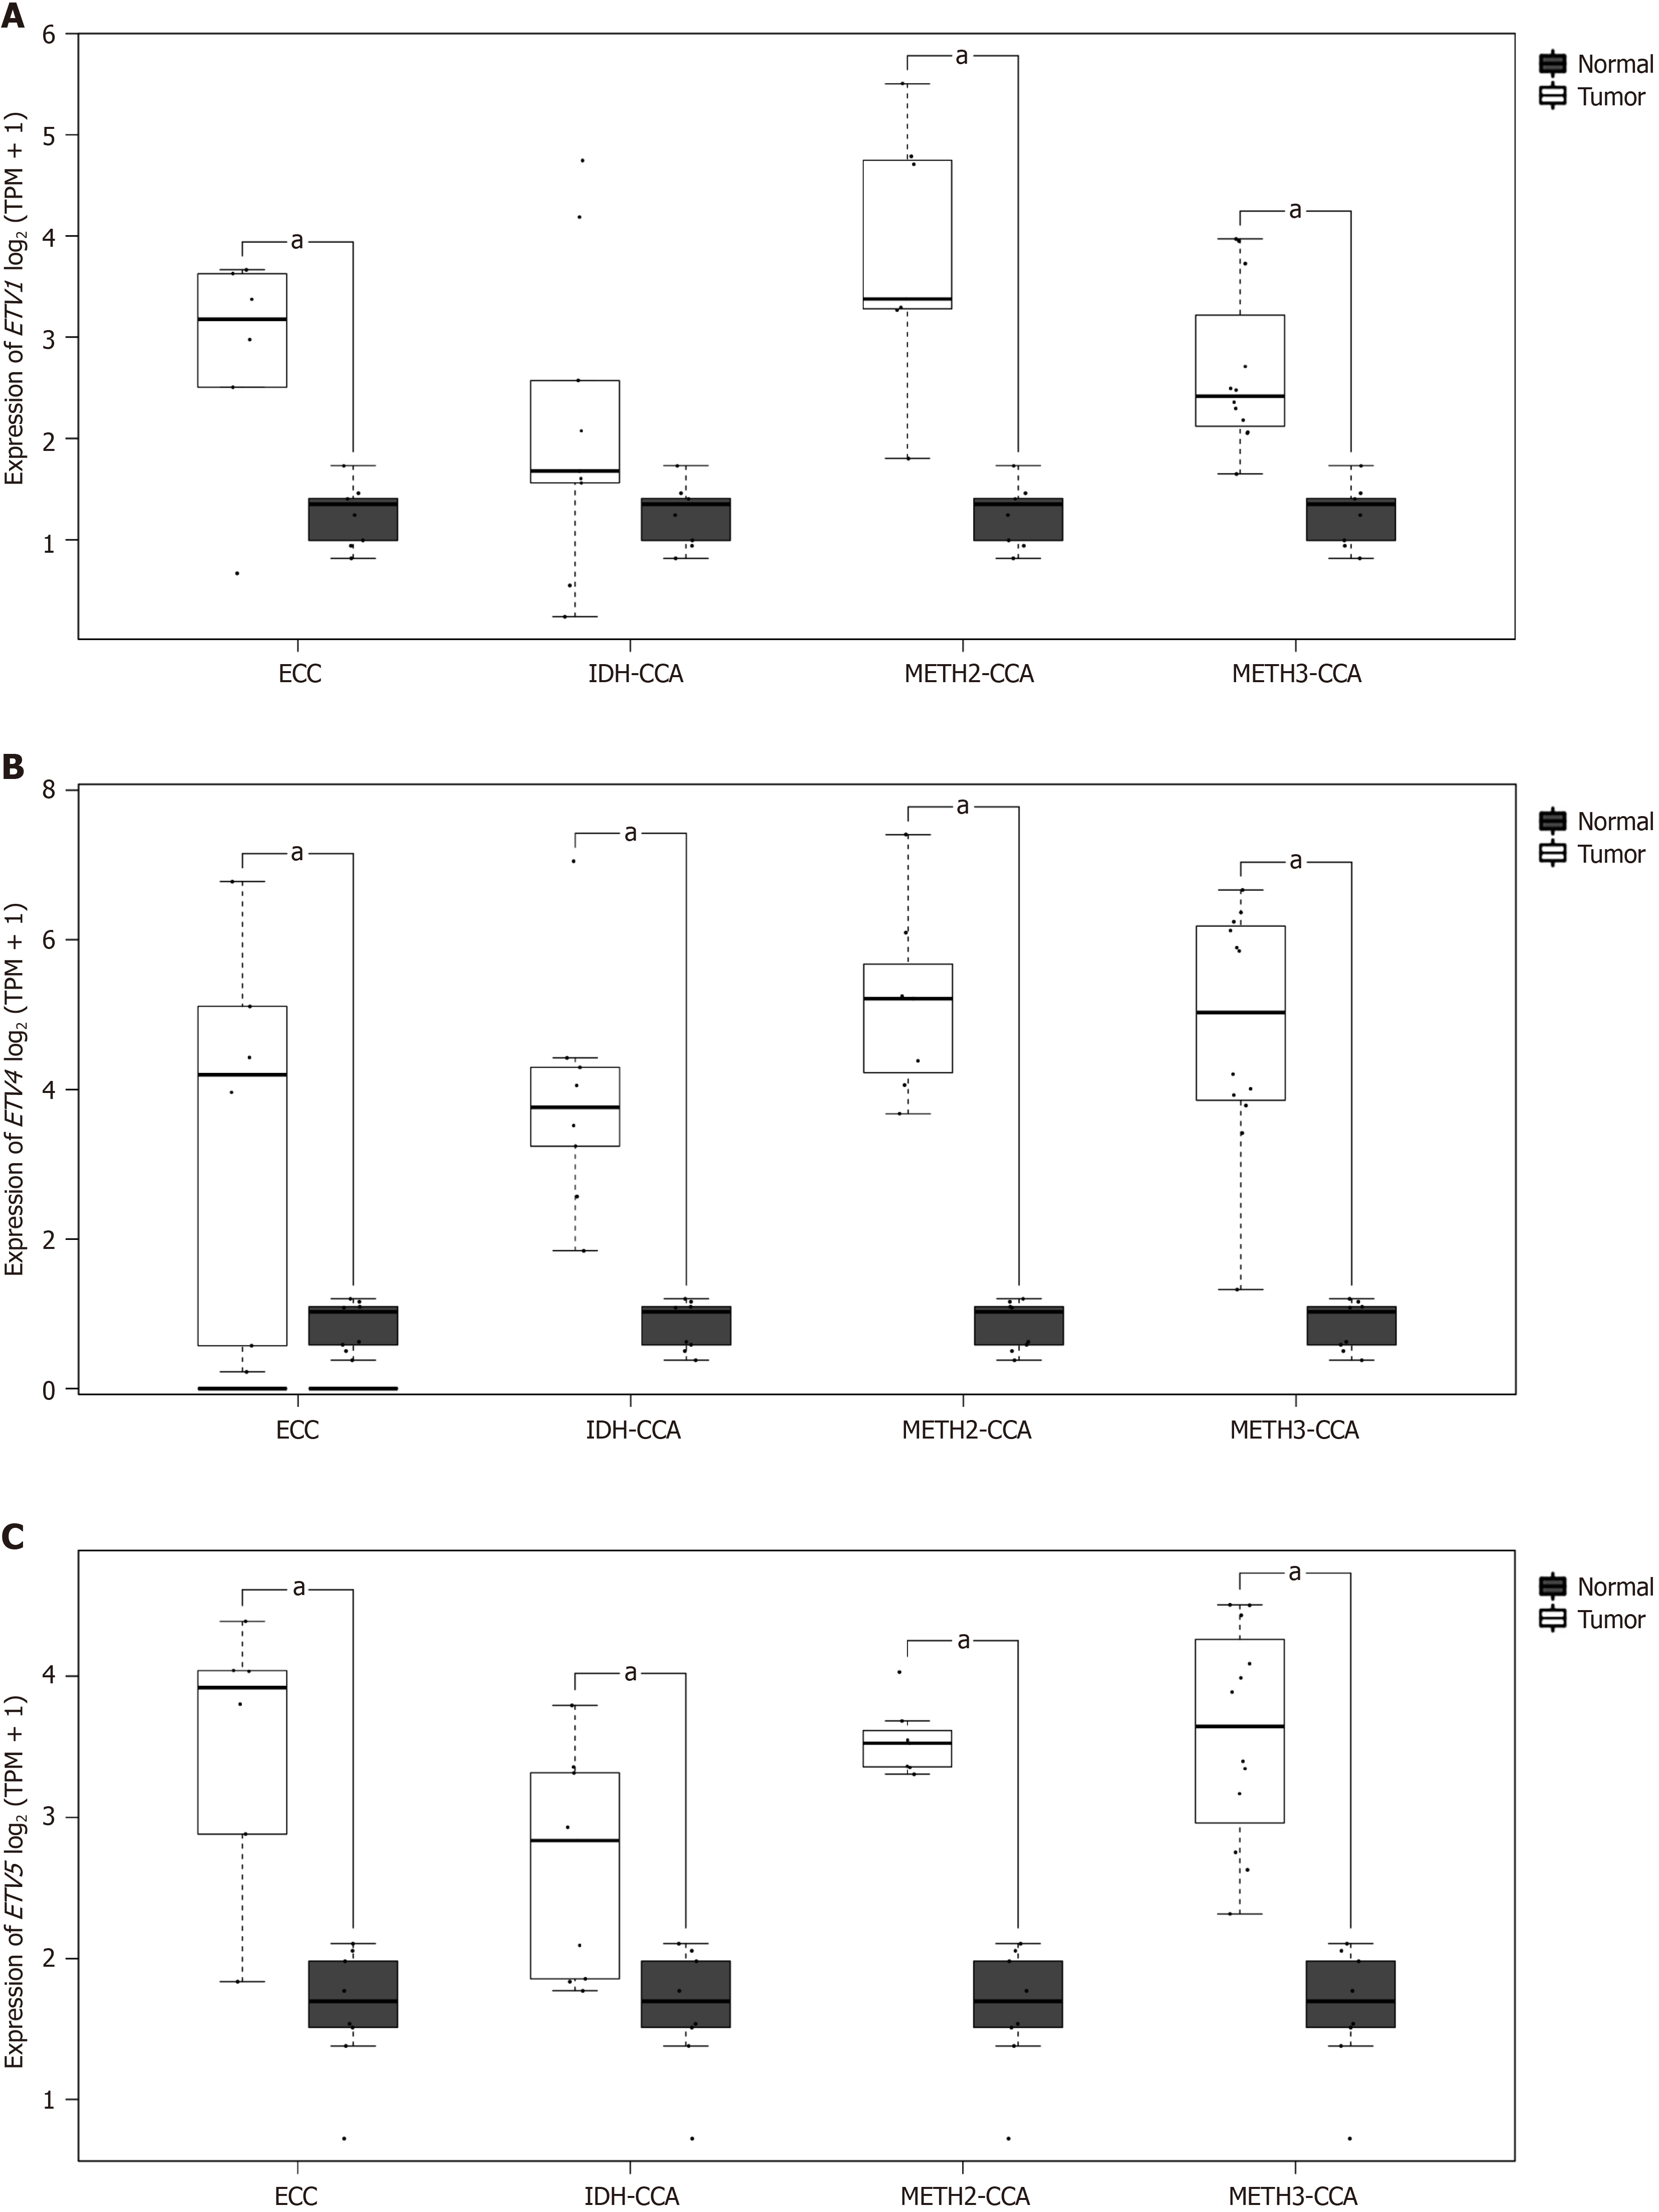
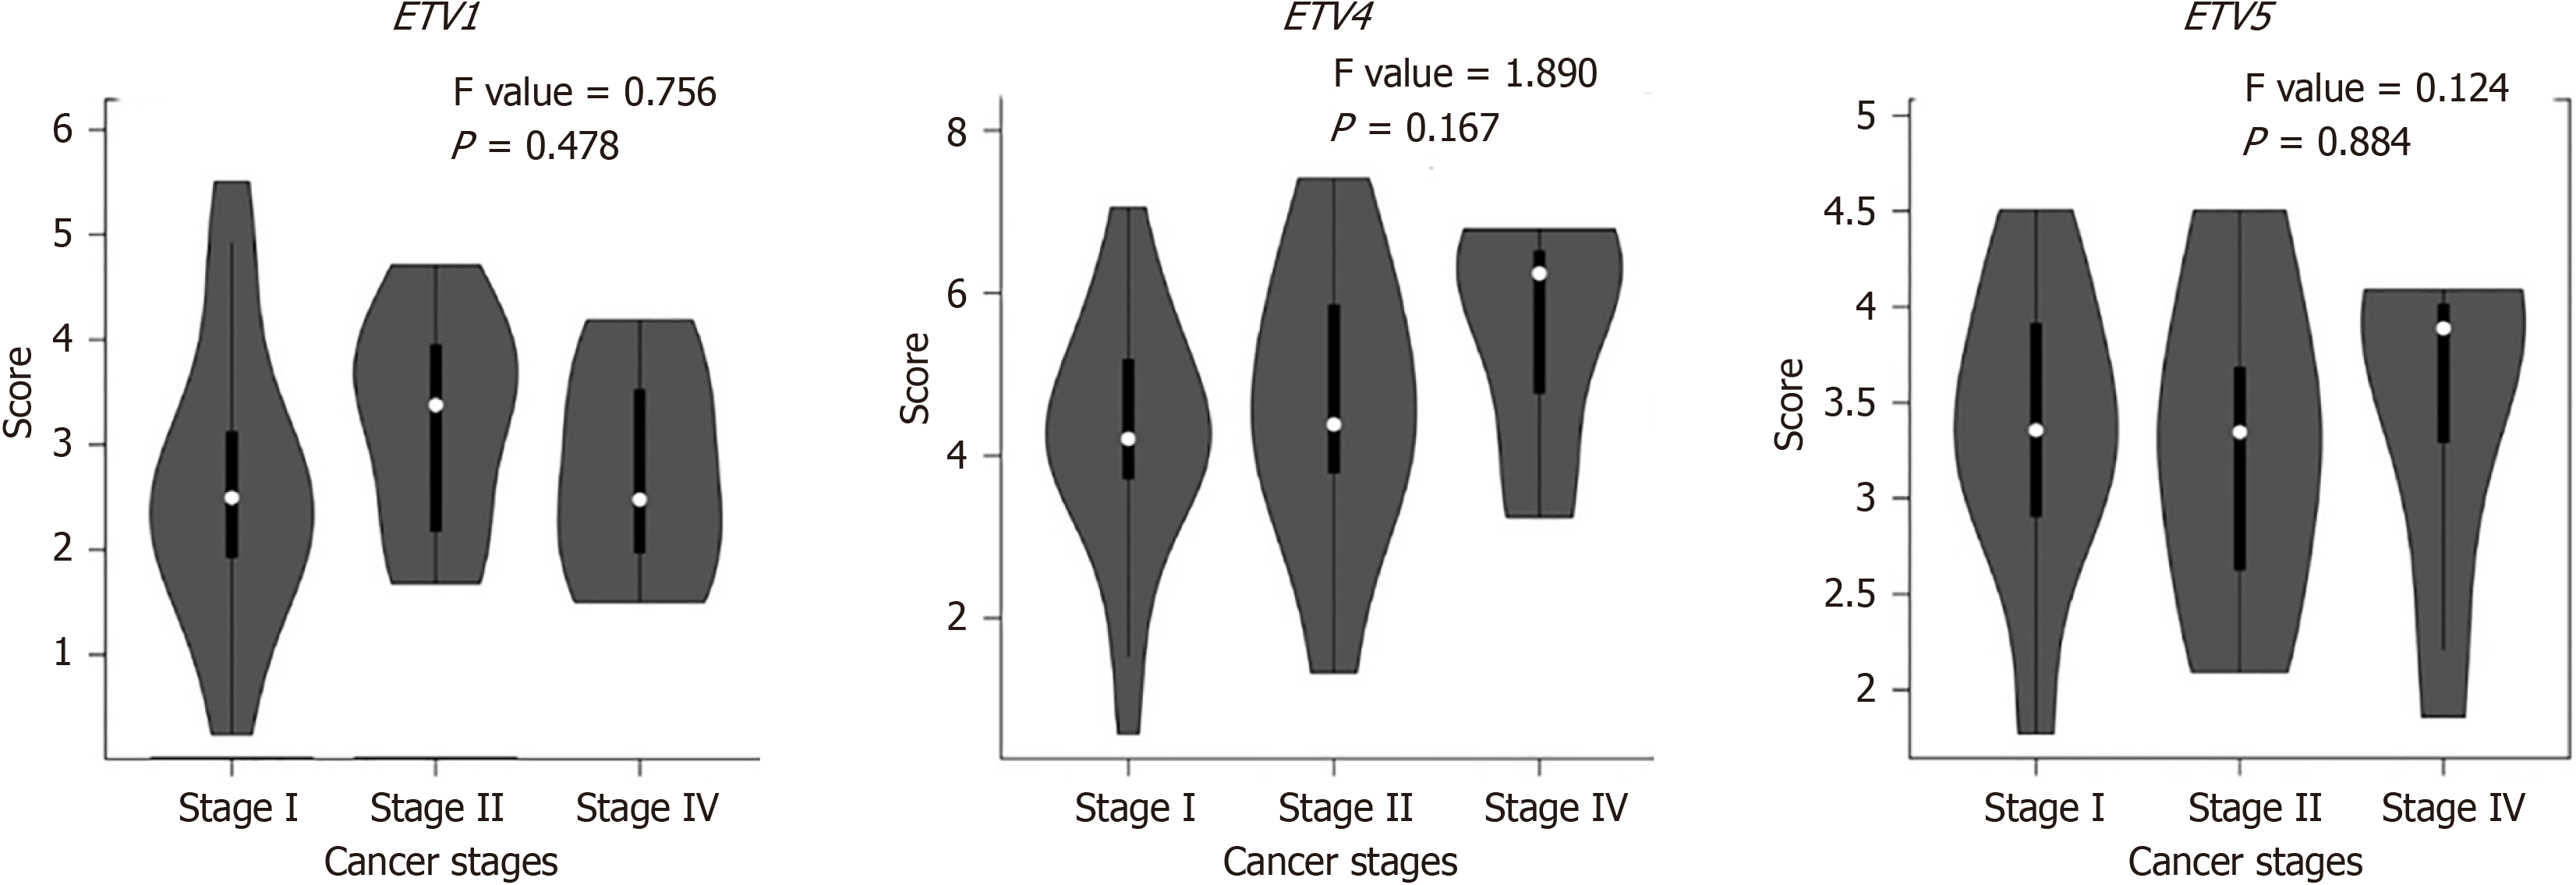
Compared with those in healthy controls, the expression levels of ETV1, ETV4, and ETV5 in patients with different tumor subtypes were significantly greater (all P < 0.05) (Figure 3). When the expression levels of PEA3 subfamily genes ac
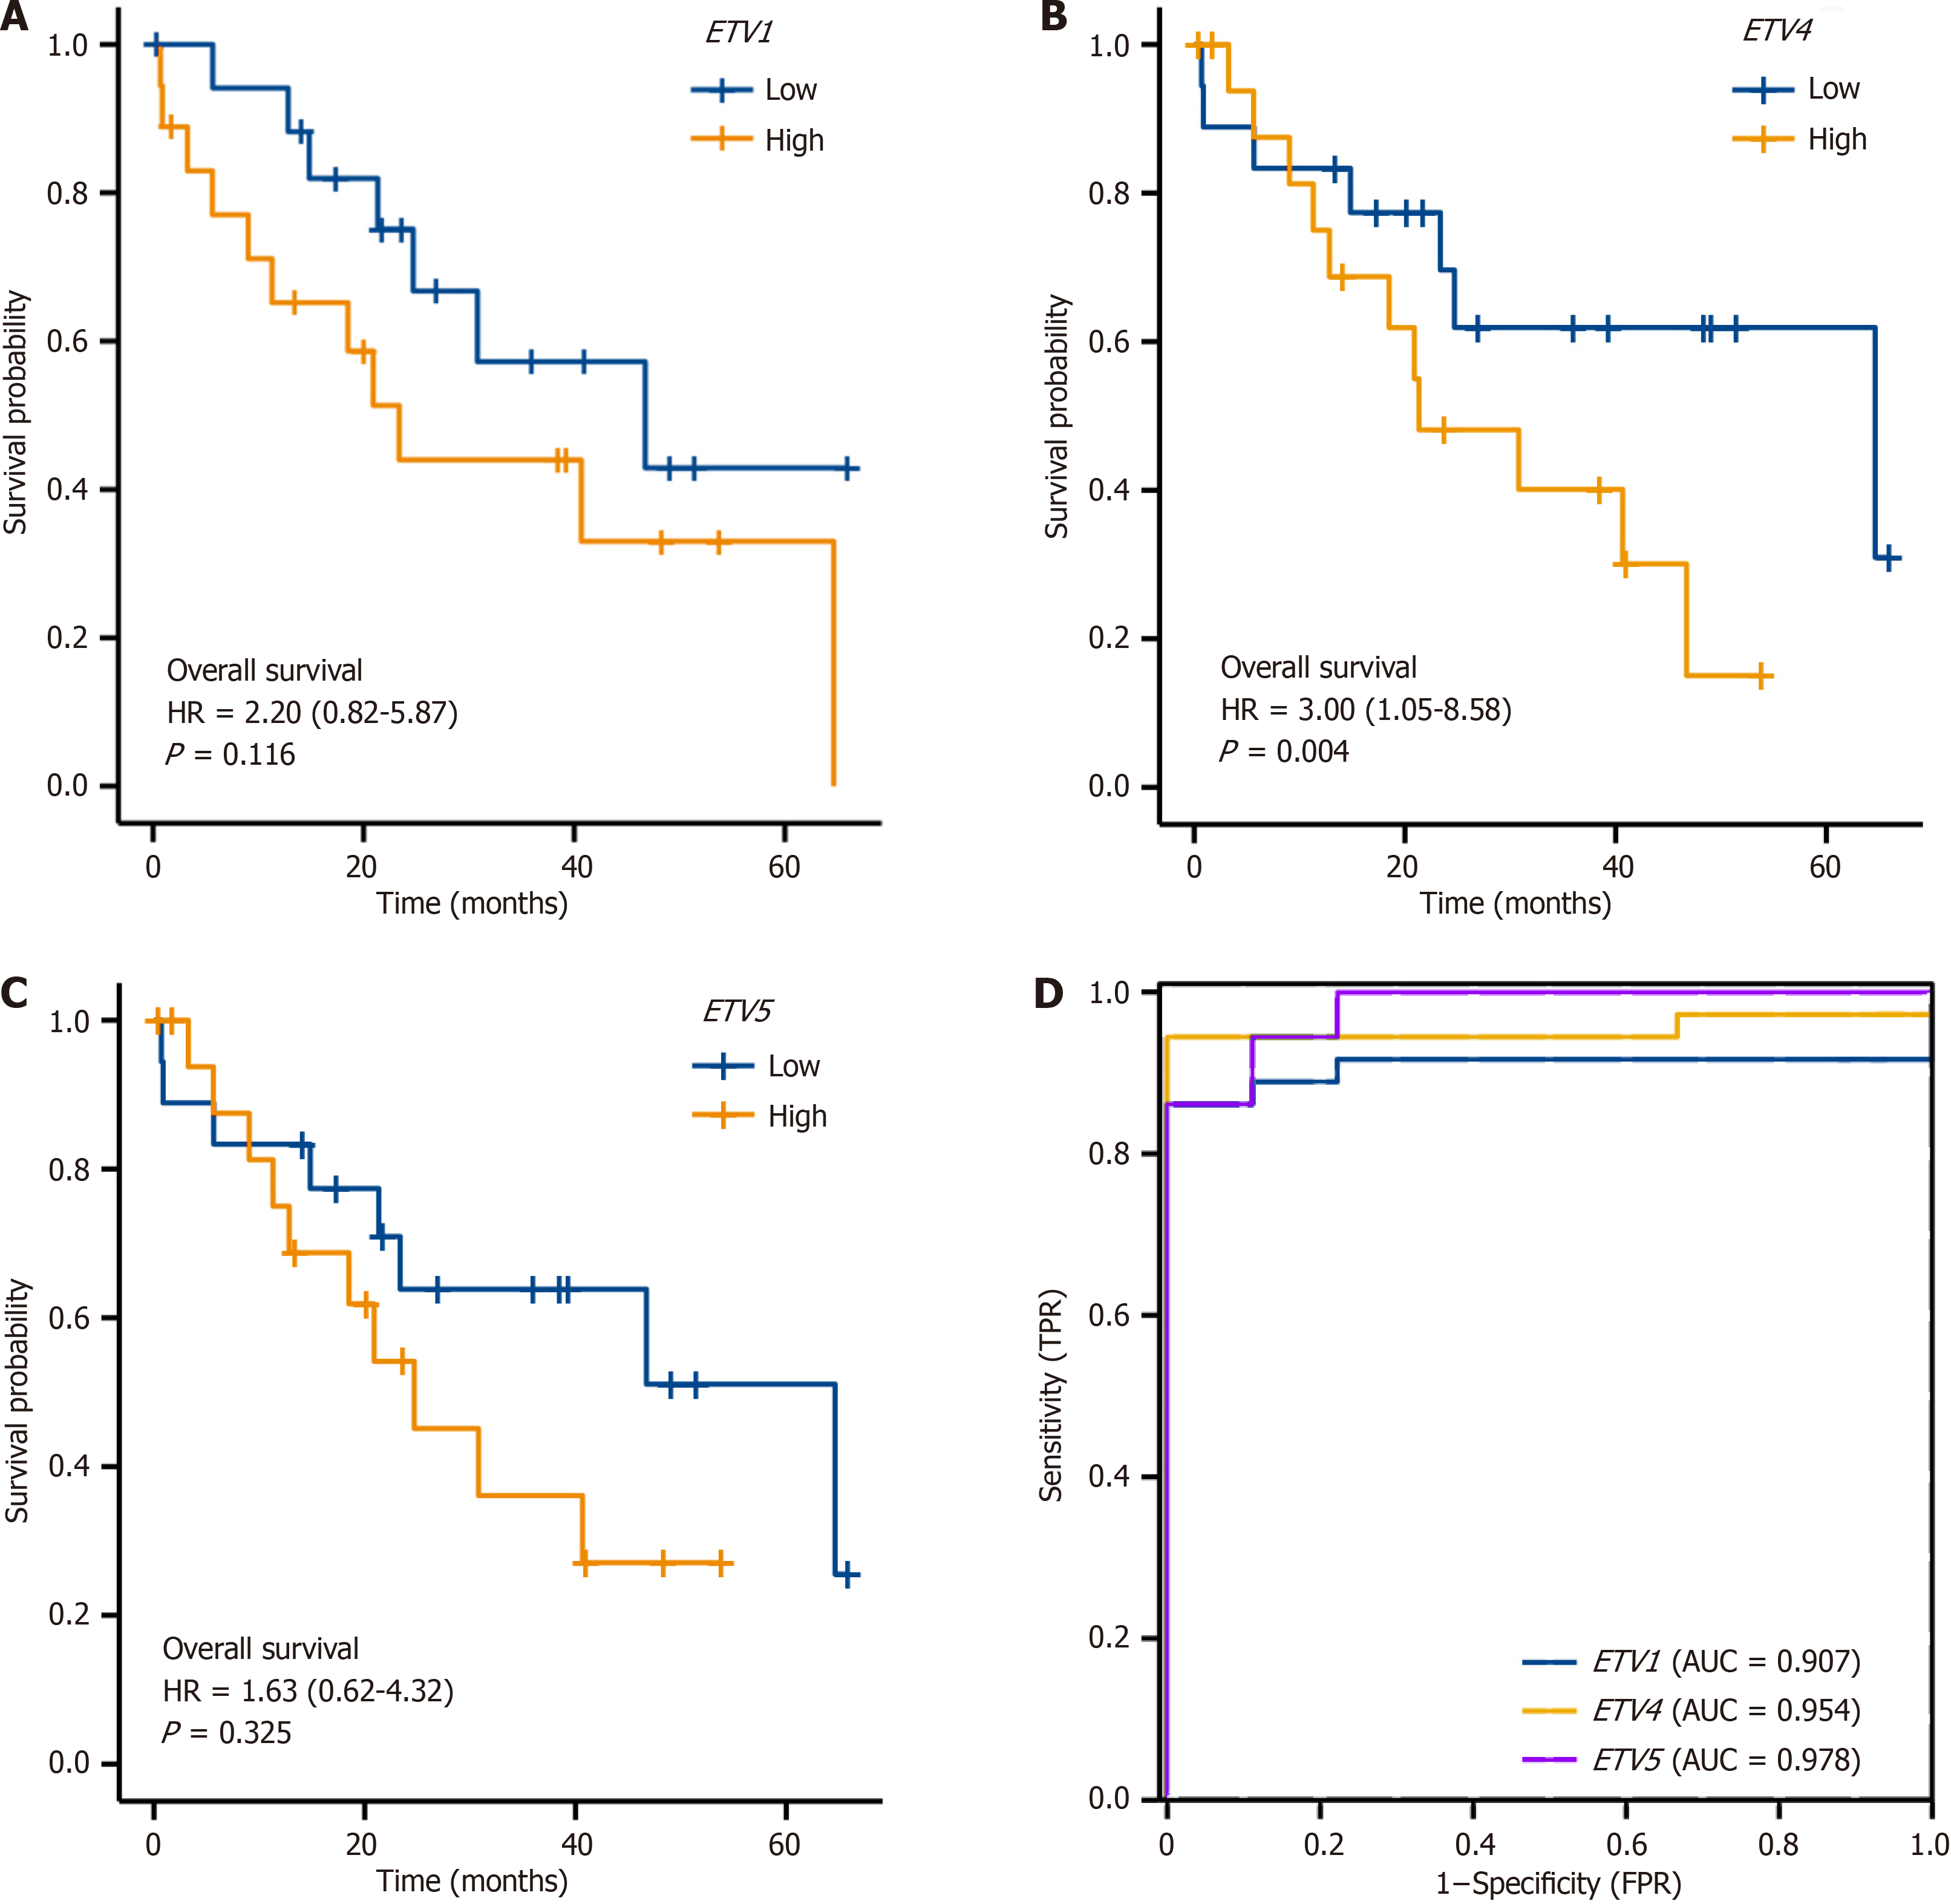
Cox regression revealed no significant difference in the survival time distribution between the high ETV1 and ETV5 expression group and the low ETV1 and ETV5 expression group (P > 0.05) (Figure 5A and C). However, the survival time of patients in the high ETV4 expression group was significantly shorter than that of patients in the low ETV4 expression group (P = 0.04) (Figure 5B). ROC curve analysis revealed that ETV1, ETV4, and ETV5 expression levels accurately predicted tumors (Area under the curve = 0.907, 0.954, 0.978) (Figure 5D).
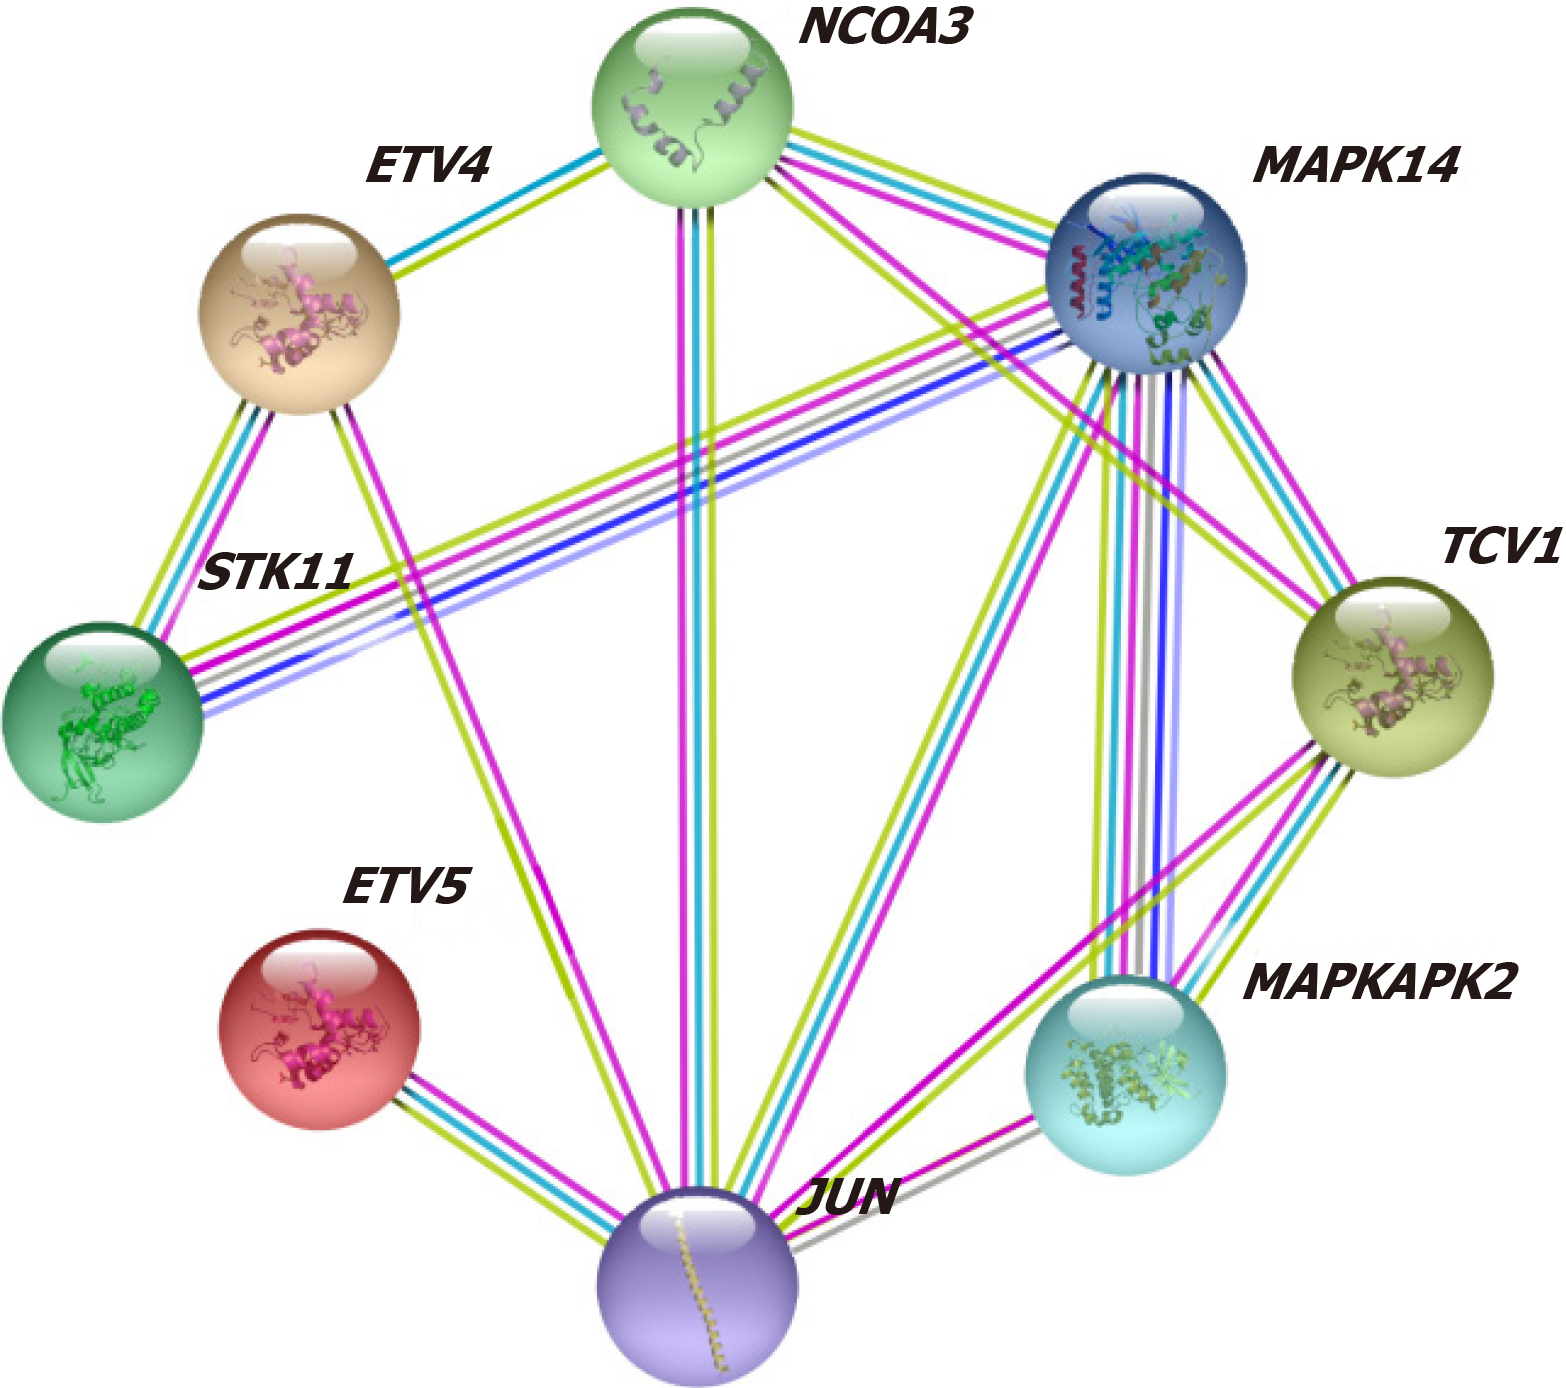
Co-expression analysis of data from the STRING database revealed that PEA3 subfamily genes were co-expressed with JUN, MAPK14, MAPKAPK2, NCOA3, and STK11 (Figure 6).
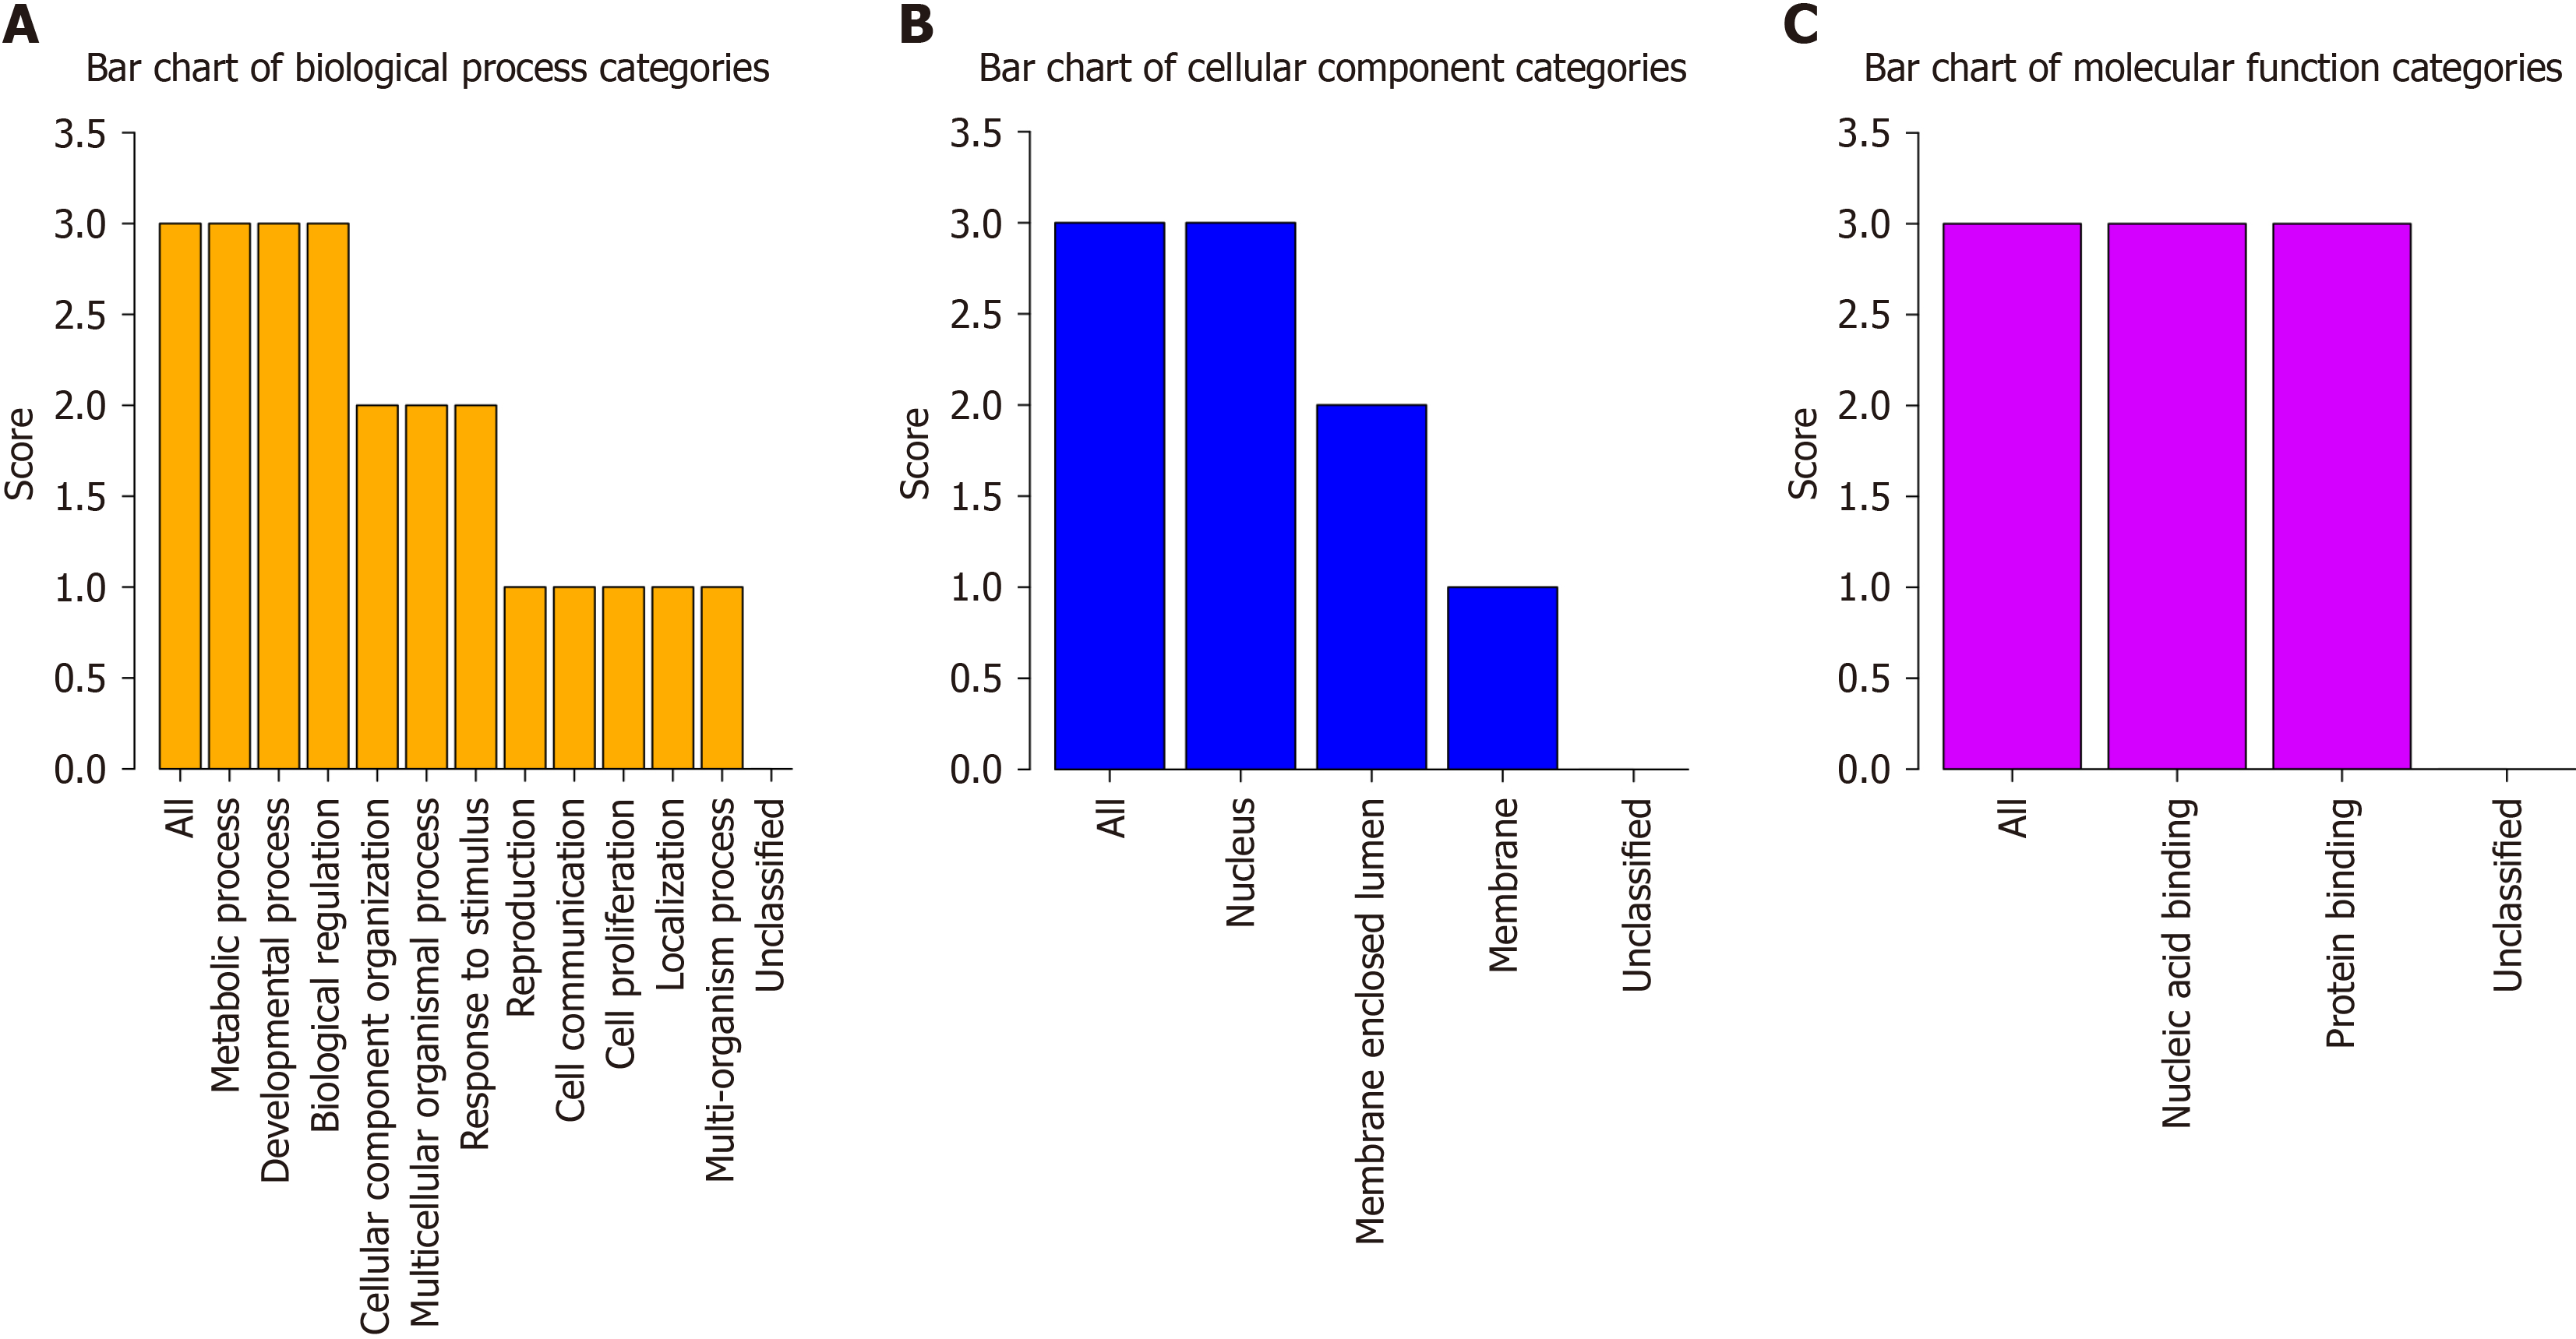
Biological process terms included: (1) GO: 0008152 (metabolic process); (2) GO: 0032502 (developmental process); (3) GO: 0065007 (biological regulation); (4) GO: 0016043 (cellular component organization); (5) GO: 0032501 (multicellular organismal process); (6) GO: 0050896 (response to stimulus); (7) GO: 0000003 (reproduction); (8) GO: 0007154 (cell communication); (9) GO: 0008283 (cell proliferation); (10) GO: 0051179 (localization); and (11) GO: 0051704 (multiorganism process) (Figure 7A).
The cellular component terms included: (1) GO: 0005634 (nucleus); (2) GO: 0031974 (membrane-enclosed lumen); and (3) GO: 0016020 (membrane) (Figure 7B). The molecular function terms included: (1) GO: 0003676 (nucleic acid binding); and (2) GO: 0005515 (protein binding) (Figure 7C).
KEGG analysis revealed that the PEA3 subfamily genes are related to hsa05202: Transcriptional misregulation in cancer.
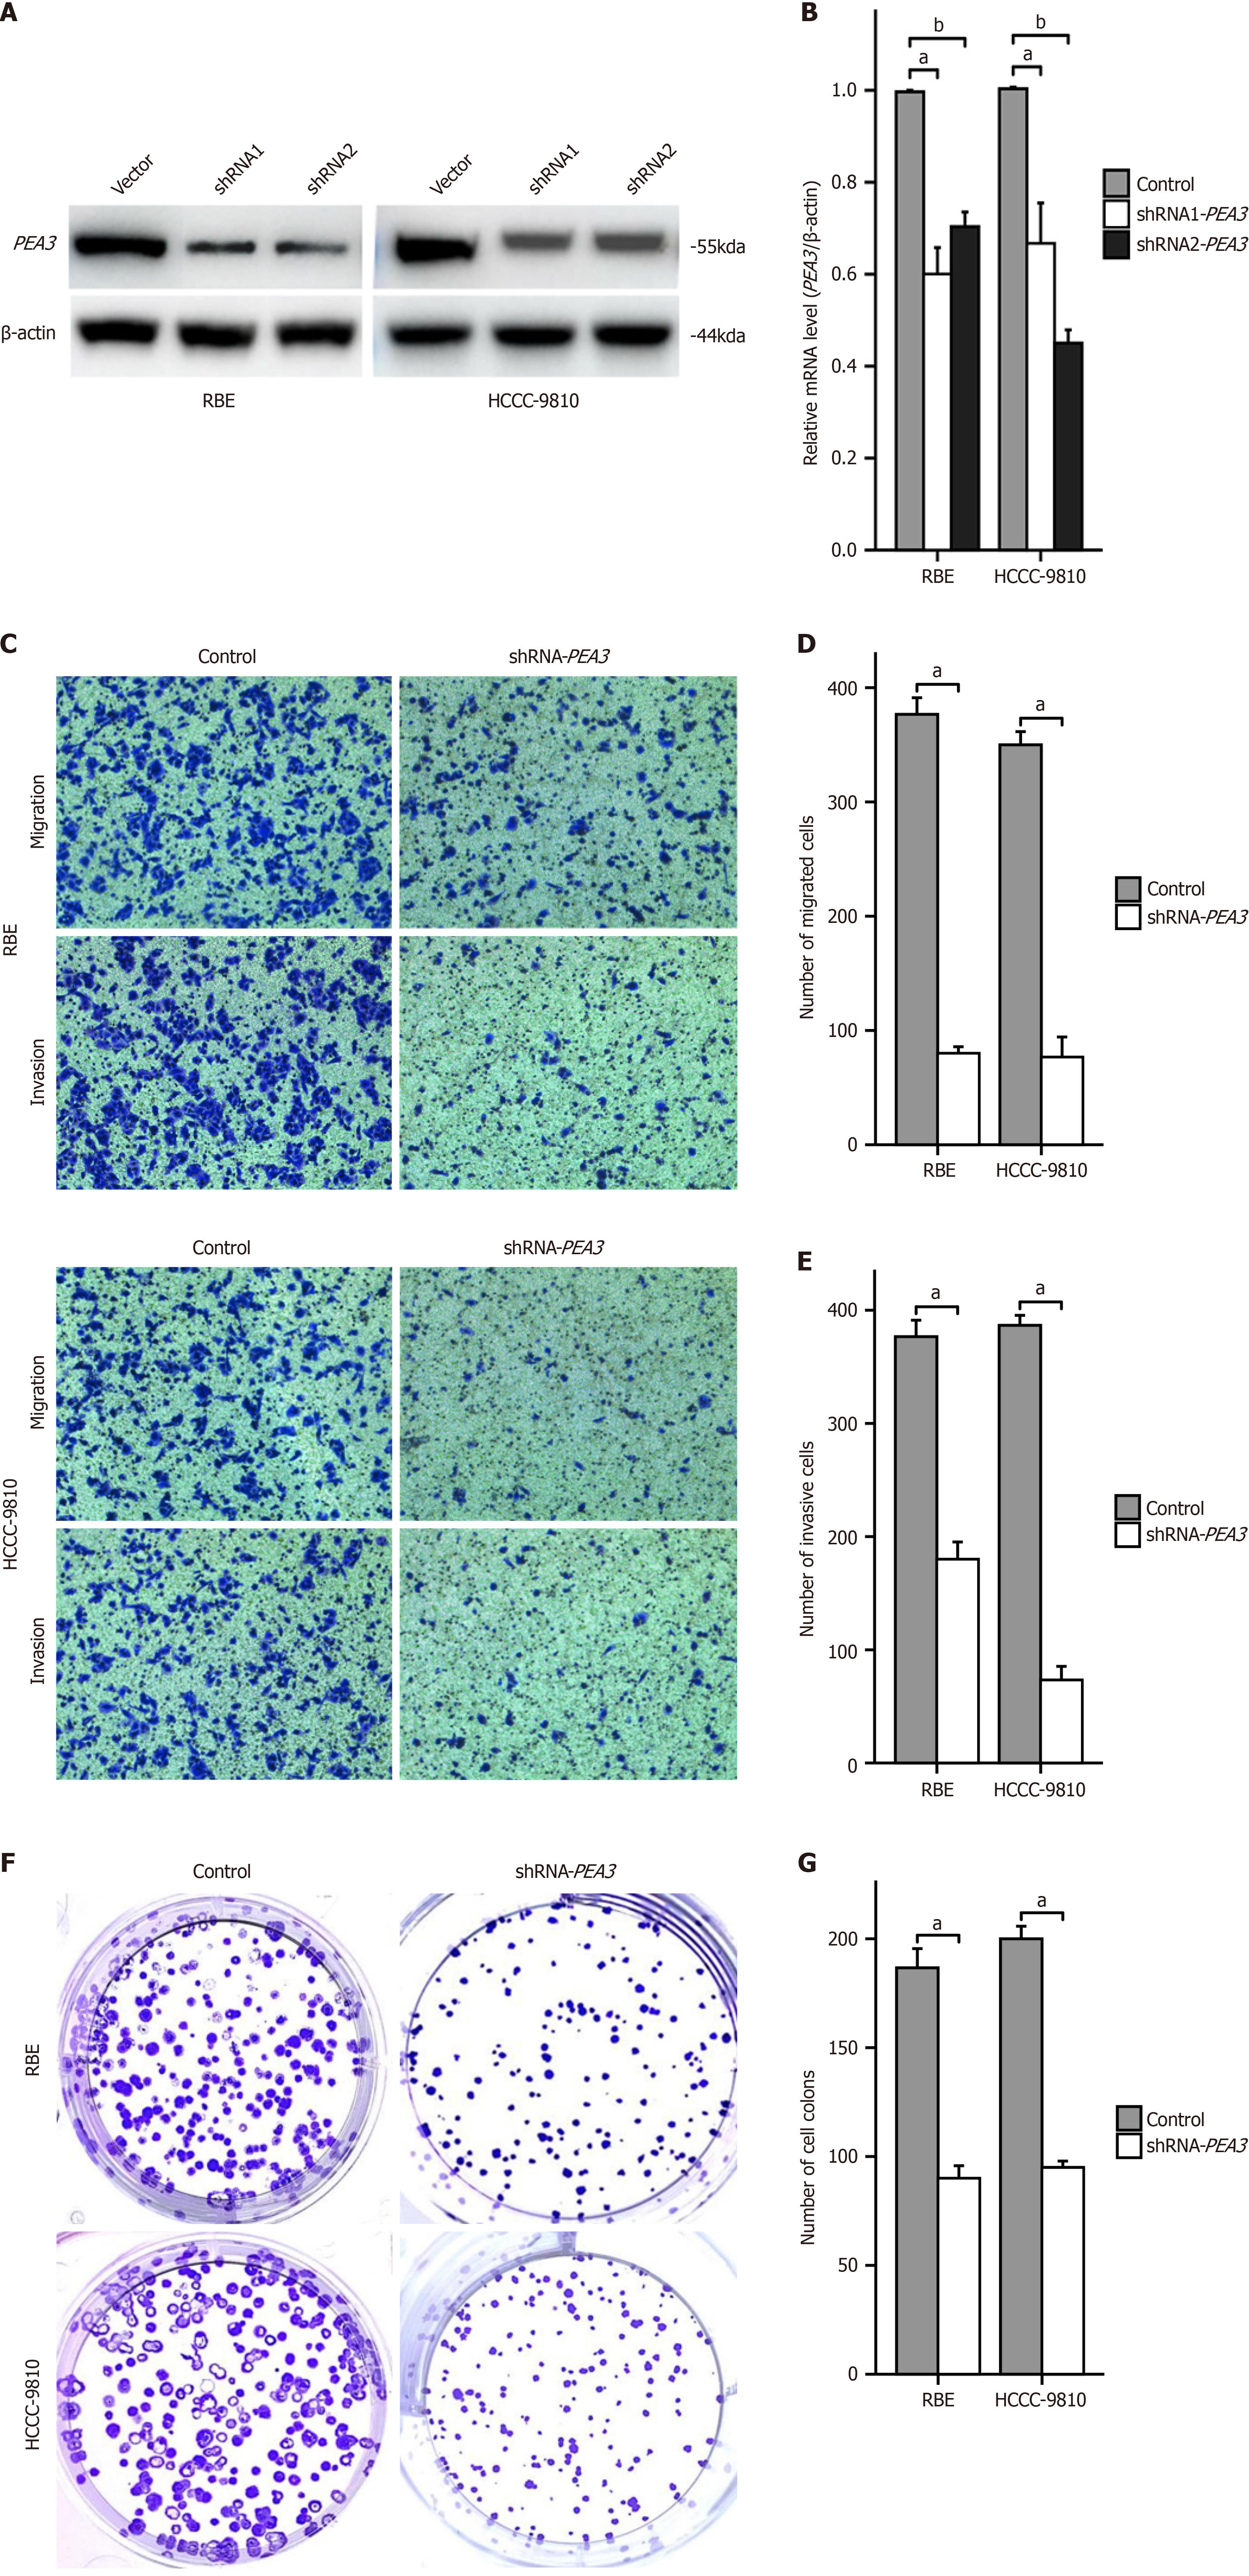
PEA3 subfamily gene expression levels decreased in RBE and HCCC-9810 cells following transfection with shRNA-PEA3 (Figure 8A and B).
After being transfected with shRNA-PEA3, the capacity of RBE and HCCC-9810 cells to proliferate and invade dramatically decreased in invasion and migration assays (Figure 8C-E) and colony formation experiments (Figure 8F and G).
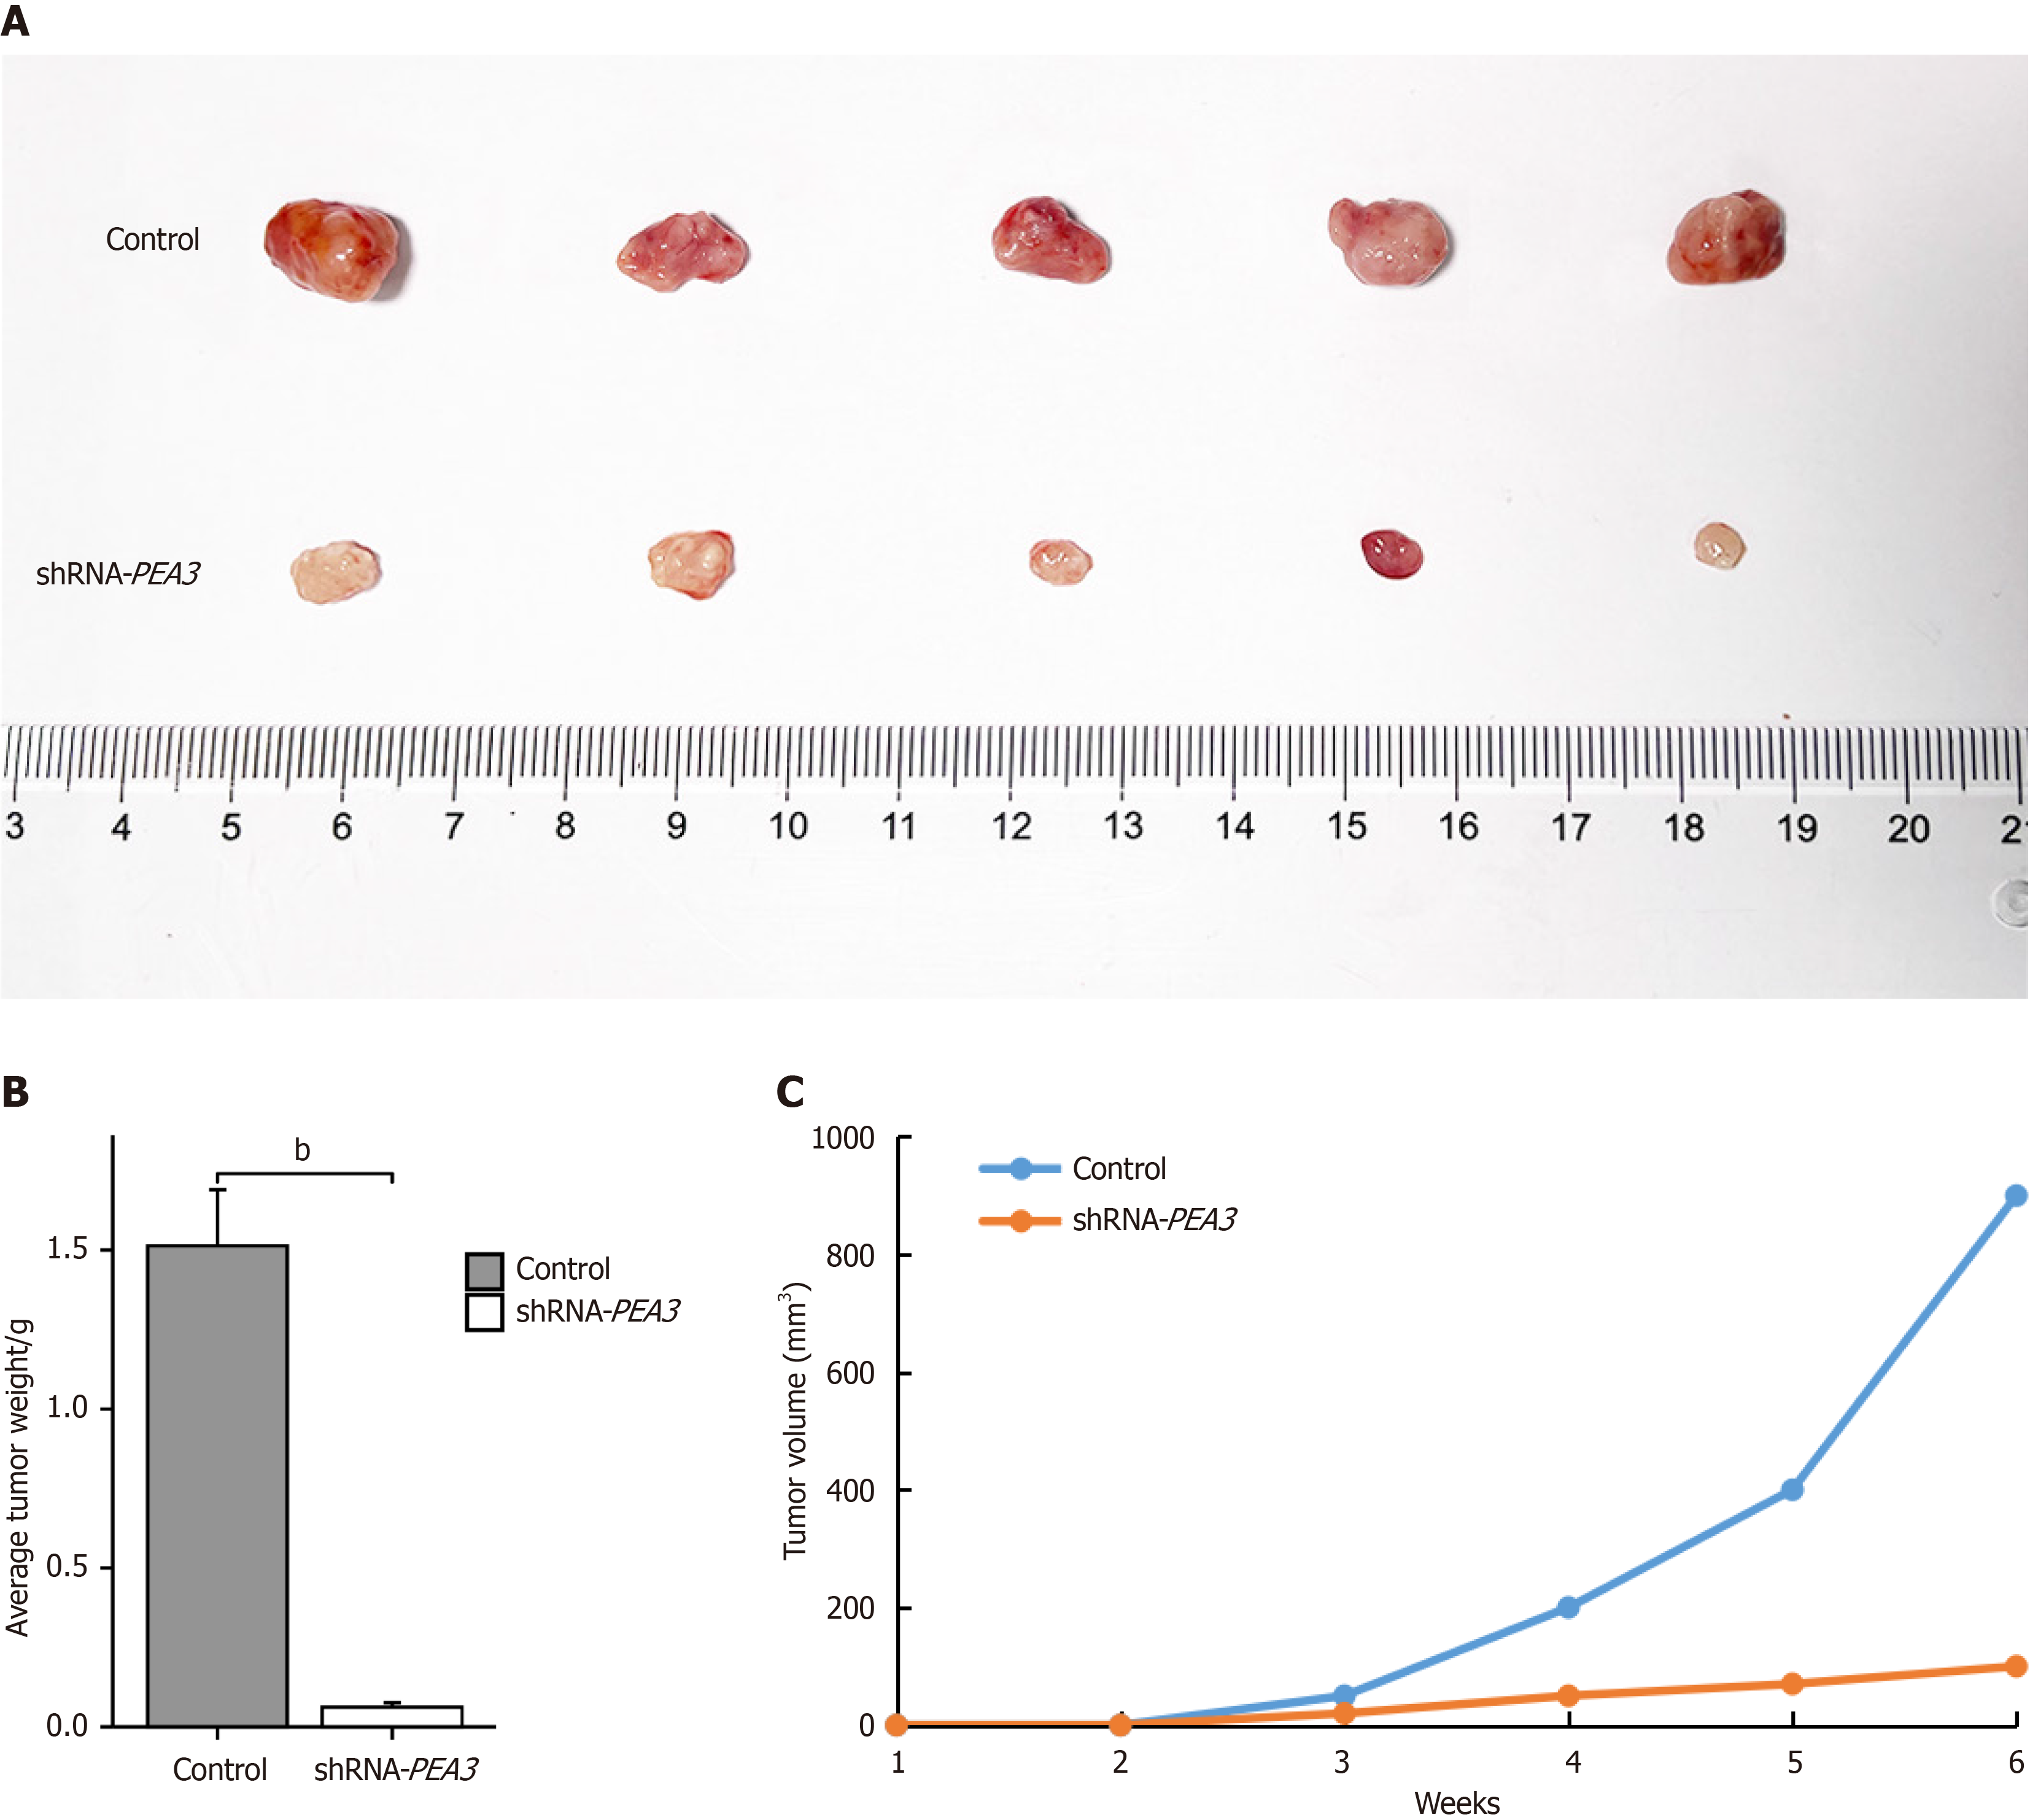
To verify that inhibition of PEA3 subfamily genes can inhibit the proliferation of CCA cells, nude mice were inoculated with shRNA-PEA3-transfected RBE cells or un transfected RBE cells and rate of subcutaneous tumor volume increase was significantly lower, and the tumor weight was lower in the shRNA-PEA3 group than the control group (Figure 9).
The ETS family represents one of the most prominent families of signal-dependent transcription factors[13]. ETS transcription factors are divided into several subfamilies on the basis of their degree of amino acid conservation and subgroup-specific amino acid sequence in the ETS domain[4]. As members of the PEA3 subfamily, ETV1, ETV4, and ETV5 share an ETS domain and an N-terminal domain of the PEA3-type ETS transcription factor. ETV1, ETV4, and ETV5 participate in tumorigenesis and development by regulating various biological processes (including cell proliferation, migration, apoptosis, epithelial-mesenchymal transition, and maintenance of the cancer stem cell phenotype)[4,14]. However, relatively few studies have investigated the expression of PEA3 subfamily genes in CCA. In this study, data from various bioinformatic databases were used to evaluate the correlation between PEA3 subfamily gene expression levels and CCA clinical parameters and to explore the prognostic value of PEA3 subfamily gene expression levels in CCA.
The results of the database analyses performed in this study revealed that the expression levels of the PEA3 subfamily genes mainly depended on cancer type, with high expression levels in most cancers. Previous studies revealed high ETV1, ETV4, and ETV5 expression levels in many cancers. For example, ETV1 is highly expressed in prostate cancer[15] and gastrointestinal stromal tumors[16]. ETV4 is frequently activated in gastric[17], lung[18], hepatocellular[19], and colore
While ROC curve analysis revealed that ETV1, ETV4, and ETV5 expression levels had value in predicting CCA, the predictive analysis revealed that only high ETV4 expression was significantly correlated with shorter overall survival (OS) in patients with CCA. Prior studies in various cancers have demonstrated that the expression levels of PEA3 sub
In our study, protein interaction network analysis revealed that PEA3 subfamily genes were co-expressed with JUN, MAPK14, MAPKAPK2, NCOA3, and STK11. GO/KEGG analysis revealed that the PEA3 subfamily genes were closely related to transcriptional mis-regulation in cancer. The N-terminus of the PEA3 transcription factor in the PEA3 subfamily has a conserved mitogen-activated protein kinase (MAPK) phosphorylation site. This site can increase transactivation through MAPK pathway activation and the inhibition of DNA binding, which results in the occurrence and development of tumors[14]. Among the posttranslational modifications of PEA3 subfamily genes are phosphorylation and acetylation for ETV1 and ETV4 and phosphorylation and ubiquitination for ETV5[5].
The molecular function of PEA3 subfamily genes is related mainly to nucleic acid and protein binding. PEA3 subfamily genes are closely related to biological processes such as metabolism, neural development, reproductive capacity, cell proliferation, motor coordination, axon guidance, hormone regulation, and tumorigenesis. Owing to the different exp
There are limitations to this study. First, further studies are needed to clarify the specific mechanism by which the silencing of PEA3 subfamily genes inhibits the invasion and metastasis of CCA cells. Second, previous studies have shown that targeting PEA3-related genes or pathways or directly targeting PEA3 subfamily genes can overcome drug resistance and increase the efficacy of cancer therapy[32], but this study did not evaluate the potential diagnostic and therapeutic value of the expression levels of PEA3 subfamily genes for CCA; thus, further studies should explore whether the expression of PEA3 subfamily genes could serve as a diagnostic marker or therapeutic target for CCA.
In summary, our results revealed that ETV1, ETV4, and ETV5 expression levels were significantly increased in CCA, and predictive analysis revealed that high ETV4 expression levels were particularly related to shorter OS in CCA patients. These results suggest that ETV4 expression levels can be prognostic biomarkers for CCA.
| 1. | Valle JW, Kelley RK, Nervi B, Oh DY, Zhu AX. Biliary tract cancer. Lancet. 2021;397:428-444. [RCA] [PubMed] [DOI] [Full Text] [Cited by in Crossref: 227] [Cited by in RCA: 625] [Article Influence: 156.3] [Reference Citation Analysis (2)] |
| 2. | de Jong MC, Marques H, Clary BM, Bauer TW, Marsh JW, Ribero D, Majno P, Hatzaras I, Walters DM, Barbas AS, Mega R, Schulick RD, Choti MA, Geller DA, Barroso E, Mentha G, Capussotti L, Pawlik TM. The impact of portal vein resection on outcomes for hilar cholangiocarcinoma: a multi-institutional analysis of 305 cases. Cancer. 2012;118:4737-4747. [RCA] [PubMed] [DOI] [Full Text] [Cited by in Crossref: 136] [Cited by in RCA: 150] [Article Influence: 11.5] [Reference Citation Analysis (0)] |
| 3. | Nassour I, Mokdad AA, Porembka MR, Choti MA, Polanco PM, Mansour JC, Minter RM, Wang SC, Yopp AC. Adjuvant Therapy Is Associated With Improved Survival in Resected Perihilar Cholangiocarcinoma: A Propensity Matched Study. Ann Surg Oncol. 2018;25:1193-1201. [RCA] [PubMed] [DOI] [Full Text] [Cited by in Crossref: 22] [Cited by in RCA: 38] [Article Influence: 5.4] [Reference Citation Analysis (0)] |
| 4. | Chang YC, Chen MH, Yeh CN, Hsiao M. Omics-Based Platforms: Current Status and Potential Use for Cholangiocarcinoma. Biomolecules. 2020;10. [RCA] [PubMed] [DOI] [Full Text] [Full Text (PDF)] [Cited by in Crossref: 3] [Cited by in RCA: 4] [Article Influence: 0.8] [Reference Citation Analysis (0)] |
| 5. | Qi T, Qu Q, Li G, Wang J, Zhu H, Yang Z, Sun Y, Lu Q, Qu J. Function and regulation of the PEA3 subfamily of ETS transcription factors in cancer. Am J Cancer Res. 2020;10:3083-3105. [PubMed] |
| 6. | Kim E, Kim D, Lee JS, Yoe J, Park J, Kim CJ, Jeong D, Kim S, Lee Y. Capicua suppresses hepatocellular carcinoma progression by controlling the ETV4-MMP1 axis. Hepatology. 2018;67:2287-2301. [RCA] [PubMed] [DOI] [Full Text] [Cited by in Crossref: 47] [Cited by in RCA: 71] [Article Influence: 10.1] [Reference Citation Analysis (0)] |
| 7. | Vivian J, Rao AA, Nothaft FA, Ketchum C, Armstrong J, Novak A, Pfeil J, Narkizian J, Deran AD, Musselman-Brown A, Schmidt H, Amstutz P, Craft B, Goldman M, Rosenbloom K, Cline M, O'Connor B, Hanna M, Birger C, Kent WJ, Patterson DA, Joseph AD, Zhu J, Zaranek S, Getz G, Haussler D, Paten B. Toil enables reproducible, open source, big biomedical data analyses. Nat Biotechnol. 2017;35:314-316. [RCA] [PubMed] [DOI] [Full Text] [Cited by in Crossref: 819] [Cited by in RCA: 865] [Article Influence: 108.1] [Reference Citation Analysis (0)] |
| 8. | Chen Z, Liu G, Hossain A, Danilova IG, Bolkov MA, Liu G, Tuzankina IA, Tan W. A co-expression network for differentially expressed genes in bladder cancer and a risk score model for predicting survival. Hereditas. 2019;156:24. [RCA] [PubMed] [DOI] [Full Text] [Full Text (PDF)] [Cited by in Crossref: 10] [Cited by in RCA: 21] [Article Influence: 3.5] [Reference Citation Analysis (0)] |
| 9. | Tang Z, Li C, Kang B, Gao G, Li C, Zhang Z. GEPIA: a web server for cancer and normal gene expression profiling and interactive analyses. Nucleic Acids Res. 2017;45:W98-W102. [RCA] [PubMed] [DOI] [Full Text] [Full Text (PDF)] [Cited by in Crossref: 5550] [Cited by in RCA: 7089] [Article Influence: 886.1] [Reference Citation Analysis (0)] |
| 10. | Liao Y, Wang J, Jaehnig EJ, Shi Z, Zhang B. WebGestalt 2019: gene set analysis toolkit with revamped UIs and APIs. Nucleic Acids Res. 2019;47:W199-W205. [RCA] [PubMed] [DOI] [Full Text] [Full Text (PDF)] [Cited by in Crossref: 1238] [Cited by in RCA: 2207] [Article Influence: 441.4] [Reference Citation Analysis (0)] |
| 11. | Szklarczyk D, Gable AL, Lyon D, Junge A, Wyder S, Huerta-Cepas J, Simonovic M, Doncheva NT, Morris JH, Bork P, Jensen LJ, Mering CV. STRING v11: protein-protein association networks with increased coverage, supporting functional discovery in genome-wide experimental datasets. Nucleic Acids Res. 2019;47:D607-D613. [RCA] [PubMed] [DOI] [Full Text] [Full Text (PDF)] [Cited by in Crossref: 10161] [Cited by in RCA: 11750] [Article Influence: 1958.3] [Reference Citation Analysis (1)] |
| 12. | Liu J, Lichtenberg T, Hoadley KA, Poisson LM, Lazar AJ, Cherniack AD, Kovatich AJ, Benz CC, Levine DA, Lee AV, Omberg L, Wolf DM, Shriver CD, Thorsson V; Cancer Genome Atlas Research Network, Hu H. An Integrated TCGA Pan-Cancer Clinical Data Resource to Drive High-Quality Survival Outcome Analytics. Cell. 2018;173:400-416.e11. [RCA] [PubMed] [DOI] [Full Text] [Full Text (PDF)] [Cited by in Crossref: 2534] [Cited by in RCA: 2364] [Article Influence: 337.7] [Reference Citation Analysis (0)] |
| 13. | Nicholas TR, Strittmatter BG, Hollenhorst PC. Oncogenic ETS Factors in Prostate Cancer. Adv Exp Med Biol. 2019;1210:409-436. [RCA] [PubMed] [DOI] [Full Text] [Cited by in Crossref: 20] [Cited by in RCA: 34] [Article Influence: 5.7] [Reference Citation Analysis (0)] |
| 14. | Currie SL, Lau DKW, Doane JJ, Whitby FG, Okon M, McIntosh LP, Graves BJ. Structured and disordered regions cooperatively mediate DNA-binding autoinhibition of ETS factors ETV1, ETV4 and ETV5. Nucleic Acids Res. 2017;45:2223-2241. [RCA] [PubMed] [DOI] [Full Text] [Full Text (PDF)] [Cited by in Crossref: 24] [Cited by in RCA: 27] [Article Influence: 3.4] [Reference Citation Analysis (0)] |
| 15. | Eid W, Abdel-Rehim W. Genome-wide analysis of ETV1 targets: Insights into the role of ETV1 in tumor progression. J Cell Biochem. 2019;120:8983-8991. [RCA] [PubMed] [DOI] [Full Text] [Cited by in Crossref: 1] [Cited by in RCA: 6] [Article Influence: 1.0] [Reference Citation Analysis (0)] |
| 16. | Jung M, Park SH, Jeon YK, Won JK, Yang HK, Kim WH. Gastrointestinal stromal tumor of unusual phenotype after imatinib treatment: A case report and diagnostic utility of ETV1 mRNA in situ hybridization. Medicine (Baltimore). 2017;96:e9031. [RCA] [PubMed] [DOI] [Full Text] [Full Text (PDF)] [Cited by in Crossref: 2] [Cited by in RCA: 3] [Article Influence: 0.4] [Reference Citation Analysis (0)] |
| 17. | Zhang X, Wang Y, Liu X, Zhao A, Yang Z, Kong F, Sun L, Yu Y, Jiang L. KIF2A promotes the progression via AKT signaling pathway and is upregulated by transcription factor ETV4 in human gastric cancer. Biomed Pharmacother. 2020;125:109840. [RCA] [PubMed] [DOI] [Full Text] [Cited by in Crossref: 14] [Cited by in RCA: 27] [Article Influence: 5.4] [Reference Citation Analysis (0)] |
| 18. | Cheng T, Zhang Z, Cheng Y, Zhang J, Tang J, Tan Z, Liang Z, Chen T, Liu Z, Li J, Zhao J, Zhou R. ETV4 promotes proliferation and invasion of lung adenocarcinoma by transcriptionally upregulating MSI2. Biochem Biophys Res Commun. 2019;516:278-284. [RCA] [PubMed] [DOI] [Full Text] [Cited by in Crossref: 12] [Cited by in RCA: 26] [Article Influence: 4.3] [Reference Citation Analysis (0)] |
| 19. | Yang QX, Zhong S, He L, Jia XJ, Tang H, Cheng ST, Ren JH, Yu HB, Zhou L, Zhou HZ, Ren F, Hu ZW, Gong R, Huang AL, Chen J. PBK overexpression promotes metastasis of hepatocellular carcinoma via activating ETV4-uPAR signaling pathway. Cancer Lett. 2019;452:90-102. [RCA] [PubMed] [DOI] [Full Text] [Cited by in Crossref: 39] [Cited by in RCA: 66] [Article Influence: 11.0] [Reference Citation Analysis (0)] |
| 20. | Eskandari E, Mahjoubi F, Motalebzadeh J. An integrated study on TFs and miRNAs in colorectal cancer metastasis and evaluation of three co-regulated candidate genes as prognostic markers. Gene. 2018;679:150-159. [RCA] [PubMed] [DOI] [Full Text] [Cited by in Crossref: 15] [Cited by in RCA: 21] [Article Influence: 3.0] [Reference Citation Analysis (0)] |
| 21. | Pedrola N, Devis L, Llauradó M, Campoy I, Martinez-Garcia E, Garcia M, Muinelo-Romay L, Alonso-Alconada L, Abal M, Alameda F, Mancebo G, Carreras R, Castellví J, Cabrera S, Gil-Moreno A, Matias-Guiu X, Iovanna JL, Colas E, Reventós J, Ruiz A. Nidogen 1 and Nuclear Protein 1: novel targets of ETV5 transcription factor involved in endometrial cancer invasion. Clin Exp Metastasis. 2015;32:467-478. [RCA] [PubMed] [DOI] [Full Text] [Cited by in Crossref: 33] [Cited by in RCA: 44] [Article Influence: 4.4] [Reference Citation Analysis (0)] |
| 22. | Zhou Y, Wang M, Shuang T, Liu Y, Zhang Y, Shi C. MiR-1307 influences the chemotherapeutic sensitivity in ovarian cancer cells through the regulation of the CIC transcriptional repressor. Pathol Res Pract. 2019;215:152606. [RCA] [PubMed] [DOI] [Full Text] [Cited by in Crossref: 14] [Cited by in RCA: 18] [Article Influence: 3.0] [Reference Citation Analysis (0)] |
| 23. | Degirmenci U, Wang M, Hu J. Targeting Aberrant RAS/RAF/MEK/ERK Signaling for Cancer Therapy. Cells. 2020;9. [RCA] [PubMed] [DOI] [Full Text] [Full Text (PDF)] [Cited by in Crossref: 257] [Cited by in RCA: 380] [Article Influence: 76.0] [Reference Citation Analysis (0)] |
| 24. | Chen Y, Sumardika IW, Tomonobu N, Kinoshita R, Inoue Y, Iioka H, Mitsui Y, Saito K, Ruma IMW, Sato H, Yamauchi A, Murata H, Yamamoto KI, Tomida S, Shien K, Yamamoto H, Soh J, Futami J, Kubo M, Putranto EW, Murakami T, Liu M, Hibino T, Nishibori M, Kondo E, Toyooka S, Sakaguchi M. Critical role of the MCAM-ETV4 axis triggered by extracellular S100A8/A9 in breast cancer aggressiveness. Neoplasia. 2019;21:627-640. [RCA] [PubMed] [DOI] [Full Text] [Full Text (PDF)] [Cited by in Crossref: 20] [Cited by in RCA: 41] [Article Influence: 6.8] [Reference Citation Analysis (0)] |
| 25. | Wang Q, Qiao W, Zhang H, Liu B, Li J, Zang C, Mei T, Zheng J, Zhang Y. Nomogram established on account of Lasso-Cox regression for predicting recurrence in patients with early-stage hepatocellular carcinoma. Front Immunol. 2022;13:1019638. [RCA] [PubMed] [DOI] [Full Text] [Full Text (PDF)] [Cited by in RCA: 77] [Reference Citation Analysis (0)] |
| 26. | Singsuksawat E, Thuwajit C, Charngkaew K, Thuwajit P. Increased ETV4 expression correlates with estrogen-enhanced proliferation and invasiveness of cholangiocarcinoma cells. Cancer Cell Int. 2018;18:25. [RCA] [PubMed] [DOI] [Full Text] [Full Text (PDF)] [Cited by in Crossref: 12] [Cited by in RCA: 19] [Article Influence: 2.7] [Reference Citation Analysis (0)] |
| 27. | Fontanet P, Irala D, Alsina FC, Paratcha G, Ledda F. Pea3 transcription factor family members Etv4 and Etv5 mediate retrograde signaling and axonal growth of DRG sensory neurons in response to NGF. J Neurosci. 2013;33:15940-15951. [RCA] [PubMed] [DOI] [Full Text] [Cited by in Crossref: 31] [Cited by in RCA: 45] [Article Influence: 3.8] [Reference Citation Analysis (0)] |
| 28. | Eo J, Han K, M Murphy K, Song H, Lim HJ. Etv5, an ETS transcription factor, is expressed in granulosa and cumulus cells and serves as a transcriptional regulator of the cyclooxygenase-2. J Endocrinol. 2008;198:281-290. [RCA] [PubMed] [DOI] [Full Text] [Cited by in Crossref: 26] [Cited by in RCA: 29] [Article Influence: 1.7] [Reference Citation Analysis (0)] |
| 29. | Zhang X, Wei R, Sun Y, Xia Q, Xie W, Song H, Wang W, Zou K. AKT3 Is a Pivotal Molecule of Cadherin-22 and GDNF Family Receptor-α1 Signal Pathways Regulating Self-Renewal in Female Germline Stem Cells. Stem Cells. 2019;37:1095-1107. [RCA] [PubMed] [DOI] [Full Text] [Cited by in Crossref: 8] [Cited by in RCA: 19] [Article Influence: 3.2] [Reference Citation Analysis (0)] |
| 30. | Zhao L, Sun X, Chen L, Feng X, Yang X, Zou P, Wang X, Zhang R. Hepatitis C Virus Core Protein Promotes the Metastasis of Human Hepatocytes by Activating the MAPK/ERK/PEA3-SRF/c-Fos/MMPs Axis. Arch Med Res. 2022;53:469-482. [RCA] [PubMed] [DOI] [Full Text] [Cited by in Crossref: 1] [Cited by in RCA: 6] [Article Influence: 2.0] [Reference Citation Analysis (0)] |
| 31. | Shia DW, Choi W, Vijayaraj P, Vuong V, Sandlin JM, Lu MM, Aziz A, Marin C, Aros CJ, Sen C, Durra A, Lund AJ, Purkayastha A, Rickabaugh TM, Graeber TG, Gomperts BN. Targeting PEA3 transcription factors to mitigate small cell lung cancer progression. Oncogene. 2023;42:434-448. [RCA] [PubMed] [DOI] [Full Text] [Cited by in Crossref: 5] [Cited by in RCA: 13] [Article Influence: 6.5] [Reference Citation Analysis (0)] |
| 32. | Cooper CD, Newman JA, Aitkenhead H, Allerston CK, Gileadi O. Structures of the Ets Protein DNA-binding Domains of Transcription Factors Etv1, Etv4, Etv5, and Fev: Determinants of DNA binding and redox regulation by disulfide bond formation. J Biol Chem. 2015;290:13692-13709. [RCA] [PubMed] [DOI] [Full Text] [Full Text (PDF)] [Cited by in Crossref: 29] [Cited by in RCA: 40] [Article Influence: 4.0] [Reference Citation Analysis (0)] |


