Published online Jun 15, 2022. doi: 10.4251/wjgo.v14.i6.1124
Peer-review started: December 18, 2021
First decision: April 17, 2022
Revised: April 22, 2022
Accepted: May 21, 2022
Article in press: May 21, 2022
Published online: June 15, 2022
Processing time: 173 Days and 19.7 Hours
The functions of infiltrating CD8+ T cells are often impaired due to tumor cells causing nutrient deprivation in the tumor microenvironment. Thus, the mechanisms of CD8+ T cell dysfunction have become a hot research topic, and there is increased interest on how changes in metabolomics correlate with CD8+ T cell dysfunction.
To investigate whether and how glutamine metabolism affects the function of infiltrating CD8+ T cells in hepatocellular carcinoma.
Immunohistochemical staining and immunofluorescence were performed on surgically resected liver tissues from patients. Differentially expressed genes in infiltrating CD8+ T cells in hepatocellular carcinoma were detected using RNA sequencing. Activated CD8+ T cells were co-cultured with Huh-7 cells for 3 d. The function and mitochondrial status of CD8+ T cells were analyzed by flow cytometry, quantitative real-time polymerase chain reaction, and transmission electron microscopy. Next, CD8+ T cells were treated with the mitochondrial protective and damaging agents. Functional alterations in CD8+ T cells were detected by flow cytometry. Then, complete medium without glutamine was used to culture cells and their functional changes and mitochondrial status were detected.
There were a large number of infiltrating PD-1+CD8+ T cells in liver cancer tissues. Next, we co-cultured CD8+ T cells and Huh-7 cells to explore the regulatory effect of hepatoma cells on CD8+ T cells. Flow cytometry results revealed increased PD-1 expression and decreased secretion of perforin (PRF1) and granzyme B (GZMB) by CD8+ T cells in the co-culture group. Meanwhile, JC-1 staining was decreased and the levels of reactive oxygen species and apoptosis were increased in CD8+ T cells of the co-culture group; additionally, the mitochondria of these cells were swollen. When CD8+ T cells were treated with the mitochondrial protective and damaging agents, their function was restored and inhibited, respectively, through the mitochondrial damage and apoptotic pathways. Subsequently, complete medium without glutamine was used to culture cells. As expected, CD8+ T cells showed functional downregulation, mitochondrial damage, and apoptosis.
Glutamine deprivation impairs the function of infiltrating CD8+ T cells in hepatocellular carcinoma through the mitochondrial damage and apoptotic pathways.
Core Tip: This study aimed to investigate whether and how glutamine metabolism affects the function of infiltrating CD8+ T cells in hepatocellular carcinoma. Experimental validation was performed by using liver cancer tissues and cell lines. We discovered that glutamine deprivation impaired the function of infiltrating CD8+ T cells in hepatocellular carcinoma through the mitochondrial damage and apoptotic pathways.
- Citation: Wang W, Guo MN, Li N, Pang DQ, Wu JH. Glutamine deprivation impairs function of infiltrating CD8+ T cells in hepatocellular carcinoma by inducing mitochondrial damage and apoptosis. World J Gastrointest Oncol 2022; 14(6): 1124-1140
- URL: https://www.wjgnet.com/1948-5204/full/v14/i6/1124.htm
- DOI: https://dx.doi.org/10.4251/wjgo.v14.i6.1124
CD8+ T cells are important effector immune cells in the tumor microenvironment that primarily kill tumor cells by secreting granzyme B (GZMB) and perforin (PRF1)[1]. Owing to factors that include chronic stimulation by tumor antigens, the physicochemical state of the tumor microenvironment is imbalanced, including low pH, hypoxia, and low nutrition availability[2,3], which trigger T cell dysfunction and ultimately result in cell depletion[4,5]. Exhausted T (Tex) cells are characterized by loss of effector functions, elevated and sustained expression of inhibitory receptors (IRs), and a distinct metabolic profile[6,7]. Recently, the mechanisms of CD8+ T cell exhaustion have become a hot research topic, and there is increased interest on how changes in metabolomics correlate with changes in immune cell functions.
Tumor cells consume high levels of energy sources such as glucose[8], resulting in nutrient depravation in the tumor microenvironment. This deprives the energy sources of immune cells, altering the phenotype and function of affected immune cells[9]. Glutamine (Gln) is the most abundant free amino acid in serum[10]. Gln is not only involved in the occurrence, development, and metastasis of tumors[11,12], but also regulates the growth and function of immune cells[13]. Gln has been reported to regulate the phenotype of CD4+ cells, and increasing Gln levels can skew regulatory CD4+ T cells toward more inflammatory subtypes[14,15]. However, whether Gln also regulates CD8+ T cells and the mechanism underlying this regulation have not been reported.
Mitochondria are important intracellular organelles that provide energy and biosynthetic substrates for cell survival through oxidative phosphorylation[16]. Mitochondria are also highly nutrient-sensitive. When cells are deficient in nutrients, their mitochondria undergo depolarization and appear damaged. Damaged mitochondria can release pro-apoptotic proteins such as cytochrome c and other substances to induce the formation of apoptotic complexes that activate caspase 9, which causes apoptosis. Recent research has demonstrated mitochondrial damage in tumor tissues that is closely related to remodeling of the tumor microenvironment. It has also been shown in the literature that after glucose deprivation, CD8+ T cells in the tumor microenvironment produce reactive oxygen species (ROS), which subse
Therefore, this study investigated whether Gln regulates CD8+ T cell function through the mitochondrial damage and apoptotic pathways to clarify the relationship between Gln metabolism and CD8+ T cell depletion, which will lay a foundation for developing new anti-tumor treatments.
Immunohistochemical staining was performed on surgically resected tissues from patients with clinicopathologically confirmed hepatocellular carcinoma (HCC) and adjacent non-cancerous tissues. The study was approved by the Medical Ethics Committee of North China University of Science and Technology (No. 2018109).
Immunofluorescence staining of paraffin-embedded human liver tissue sections was performed using anti-PD-1/CD279 (66220-1-Ig, Proteintech, Rosemont, IL, United States) and anti-CD8α (PB9249, Boster Bio, Pleasanton, CA, United States) antibodies. Antigen retrieval was performed with EDTA buffer (AR0023, Boster Bio). Tissue sections were blocked with 10% goat serum (AR1009, Boster Bio), and then incubated with rabbit anti-CD8α antibody (1:200 dilution) and mouse anti-PD-1 antibody (1:4000 dilution) at 4 °C overnight. Secondary antibodies including DyLight594 fluorescein goat anti-mouse (BA1141, Boster Bio) and fluorescein DyLight488 goat anti-rabbit (BA1127, Boster Bio) IgGs were then added and incubated for 45 min at 37 °C. DAPI staining solution (AR1176, Boster Bio) was used for counterstaining at room temperature for 3 min, and then washed with PBS (pH 7.2-7.6) (AR0030, Boster Bio). Slides were mounted using anti-fluorescent quench mounting medium (AR1109, Boster Bio). Finally, whole-slide scanning (APERIOVERSA8, Leica, Wetzlar, Germany) and image acquisition (BX51, Olympus, Tokyo, Japan) were performed.
First, 100 mL of peripheral blood was collected from healthy volunteers, from which peripheral blood mononuclear cells (PBMCs) were obtained by diluting peripheral blood with an equal volume of PBS followed by centrifugation (800 g, 20 min). The pellet was then washed with 5 × volume of PBS and centrifuged (200 g, 5 min). Cells were resuspended in x-vivo15 (SH30809.01B, Hyclone, Logan, UT, United States). PBMCs were stained with anti-human CD8 antibody (Biolegend, San Diego, CA, United States). Cell sorting was performed using a MofloXDP sorting flow cytometer (Beckman Coulter, Brea, CA, United States). The post-classification purity of all included samples was > 85%.
The hepatoma cell line HuH-7 (RRID: CVCL_0336) was confirmed via short tandem repeat markers by Procell Life Science & Technology Co., Ltd. (Hyderabad, India). The results showed that the DNA typing of this cell line matched 100% with other typing in the CRC cell bank, and no human cell cross-contamination was found. HuH-7 cells were cultured in Dulbecco’s modified eagle medium (DMEM) (Sigma-Aldrich, St. Louis, MO, United States), supplemented with 10% fetal bovine serum (FBS) (Gibco, Waltham, MA, United States) and 1% penicillin/streptomycin (Hyclone). CD8+ T cells were cultured in vitro using Roswell Park Memorial Institute (RPMI) 1640 medium (SH30809.01B; Hyclone), supplemented with 10% FBS (Gibco) and 1% penicillin/streptomycin (Hyclone). CD8+ T cells were stimulated with 10 μg/mL anti-human CD3 antibody (kx10-3A; Beijing Kexin Biological, Beijing, China) and 2.5 μg/mL anti-human CD28 antibody (kx10-28A; Beijing Kexin Biological) in medium containing 100 U/mL IL-2 (PeproTech, Rocky Hill, NJ, United States) for 2 d. Both cell types were maintained at 37 °C in an atmosphere containing 50 mL/L CO2.
HuH-7 and CD8+ T cells were co-cultured in transwell inserts for 3 d, and the initial number of both cell types used was equal.
Total RNA was extracted from CD8+ T cells, and total RNA sequencing (RNA-Seq) libraries were obtained by a three-step method: (1) RNA library construction and on-board sequencing were performed. Sequencing data were aligned to the reference genome of the project species to obtain comprehensive transcript information and to perform gene expression quantification; (2) The transcriptome sequencing project was completed on the Illumina sequencing platform (San Diego, CA, United States), and the IlluminaPE library (approximately 300 bp) was constructed for sequencing; and (3) The obtained sequencing data were analyzed by bioinformatics after performing quality control.
CD8+ T cells isolated from peripheral blood were cultured in groups and stained for intracellular markers. Analytical flow cytometry (NovoCyte, ACEA Biosciences Inc., San Diego, CA, United States) and a flow analyzer (CytoFLEXS, Beckman Coulter) were used for the analysis. CD8+ T cells were stained with an Annexin V-FITC Apoptosis Detection Kit (A211-02; Vazyme, Nanjing, China) to detect apoptosis. CD8+ T cells were stained with JC-1 fluorescent dye (J8030; Solarbio, Beijing, China) and a ROS Detection Kit (CA1410; Solarbio) to detect mitochondrial damage and ROS levels, respectively. Cells were fixed and permeabilized with Fixation/Permeabilization solution (554714; BD Biosciences, Franklin Lakes, NJ, United States), and then CD8+ T cells were stained with anti-GZMB (515403; Biolegend) and anti-PRF1 (154305; Biolegend) antibodies to detect their activation status. Finally, CD8+ T cells were stained with PE-conjugated anti-human CD279 (PD-1) antibody (329905; Biolegend) to detect their functional changes.
First, mRNA was extracted from sorted CD8+ T cells using the MiniBEST Universal RNA Extraction Kit (Cat.#9767; TaKaRa, Dalian, China) according to the manufacturer’s protocol. Extracted mRNA was reverse-transcribed into cDNA after mixing mRNA template with the Primescript RT Reagent Kit with gDNA Eraser (AK3920; TaKaRa) for quantitative polymerase chain reaction (qPCR). The qPCR reactions were run on a Light Cycler 480SYBRGreenIMaster (04887352001; Roche, Basel, Switzerland). The primer sequences are as follows: GZMB (forward: 5′-GGTGCGGTGGCTTCCTGAT-3′ and reverse: 5′-ACTGCTGGGTCGGCTCCTGT-3′); PRF1 (forward: 5′-TGCCGCTTCTACAGTTTCCA-3′ and reverse: 5′-CCACCTCGTTGTCCGTGAG-3′); and GAPDH (forward: 5′-TCAAGAAGGTGGTGAAGCAGG-3′ and reverse: 5′-TCAAAGGTGGAGGAGTGGGT-3′). The qPCR steps included initial denaturation at 95 °C for 10 min, and 40 cycles of denaturation at 95 °C for 10 s, annealing at 60 °C for 15 s, and extension at 72 °C for 20 s. All qPCR reactions were performed on a Bio-Rad real-time quantitative fluorescence PCR instrument (CFX Connect, Bio-Rad, Hercules, CA, United States). Relative gene expression was calculated with respect to the internal standard (GAPDH). Expression levels were normalized against GAPDH using the 2−ΔΔCt method.
Cells in each group were digested to prepare cell suspensions at a density of 1 × 10⁶ cells/mL. After discarding the supernatant, the cells were fixed with 3% glutaraldehyde fixative for 2 h and 1% osmic acid for 1 h. After dehydration with a graded ethanol series and acetone, the cells were embedded in epoxy resin, ultrathin sectioned, and double stained with uranium and lead. The ultrastructural changes of mitochondria in each group of cells were observed by transmission electron microscopy (TEM).
All analyses were performed with SPSS 21.0 software (IBM Corp., Armonk, NY, United States) and GraphPad Prism 8.0.2 (GraphPad Software, Inc., San Diego, CA, United States). Measurement data were first examined using the Kolmogorov-Smirnov test to check whether the measurement data of each group had a normal distribution. Results are expressed as the mean ± SE for measurement data with a normal distribution. Comparisons between two groups were performed using the two-tailed Student’s t test. One-way analysis of variance was used for multiple group comparisons, and the LSD-t test was used for pairwise comparisons. Significance was accepted at P < 0.05.
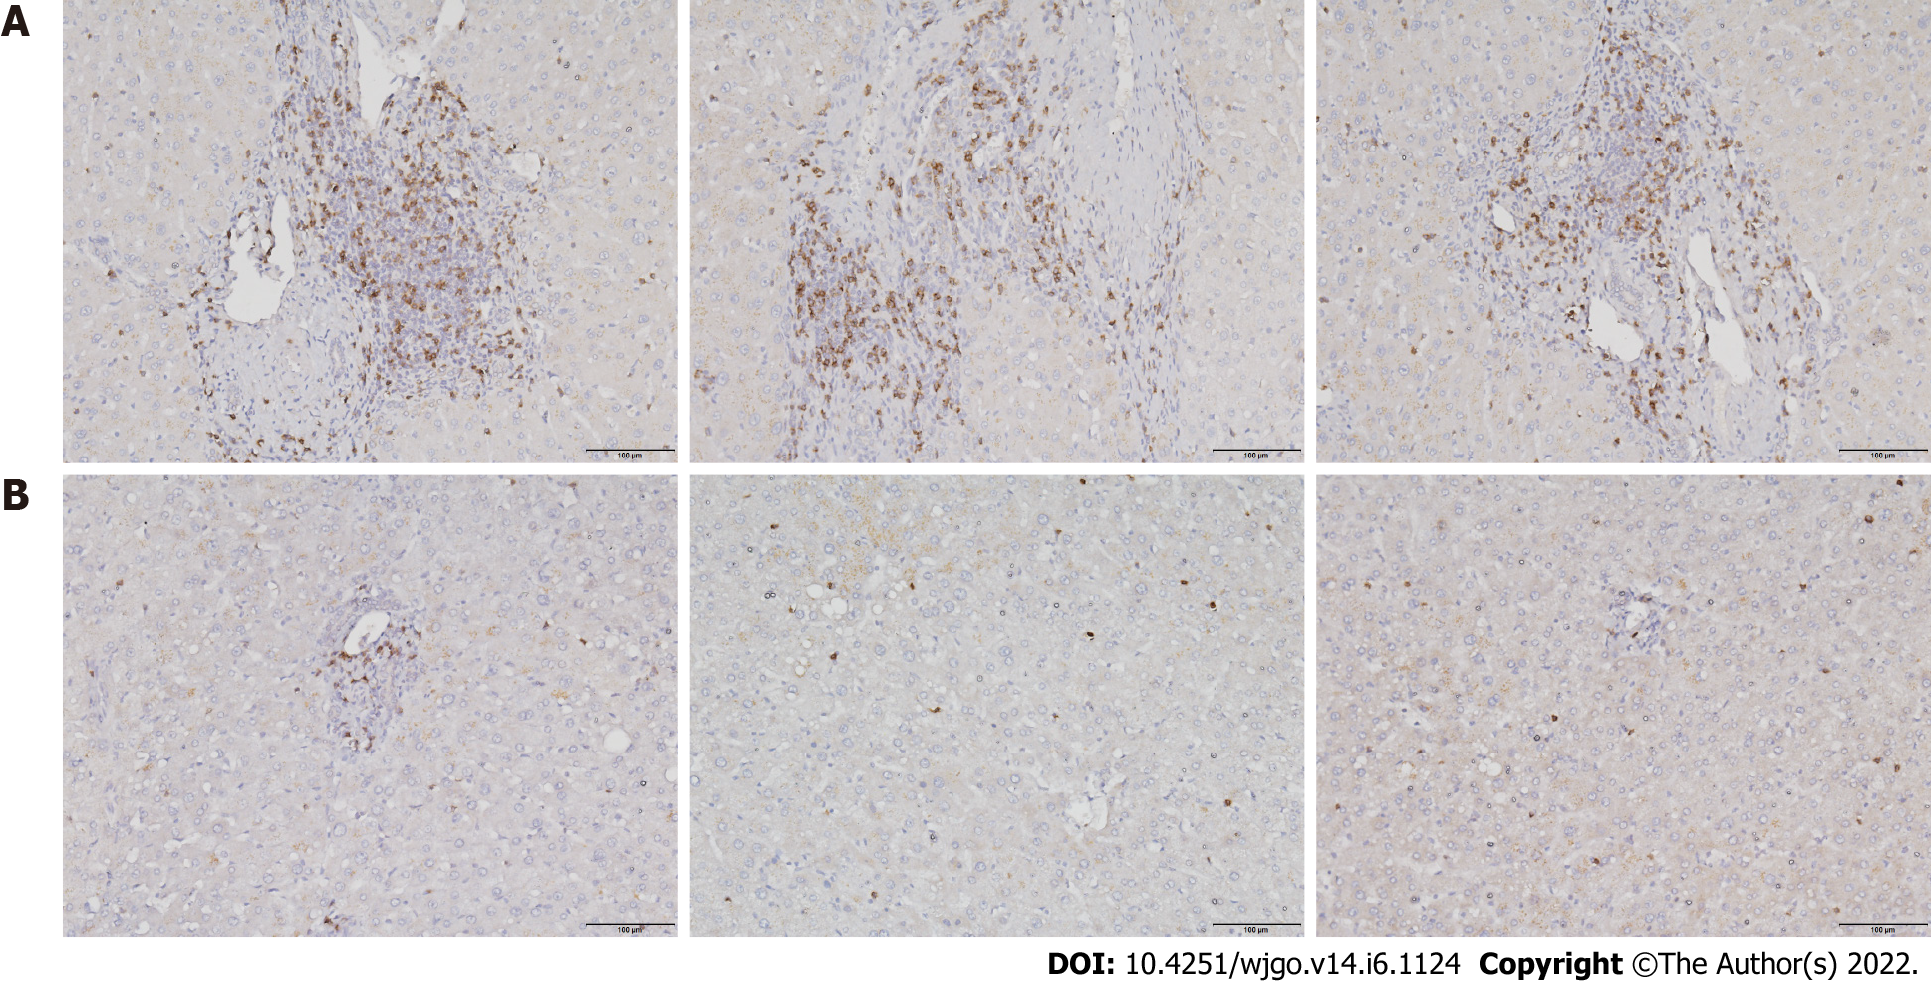
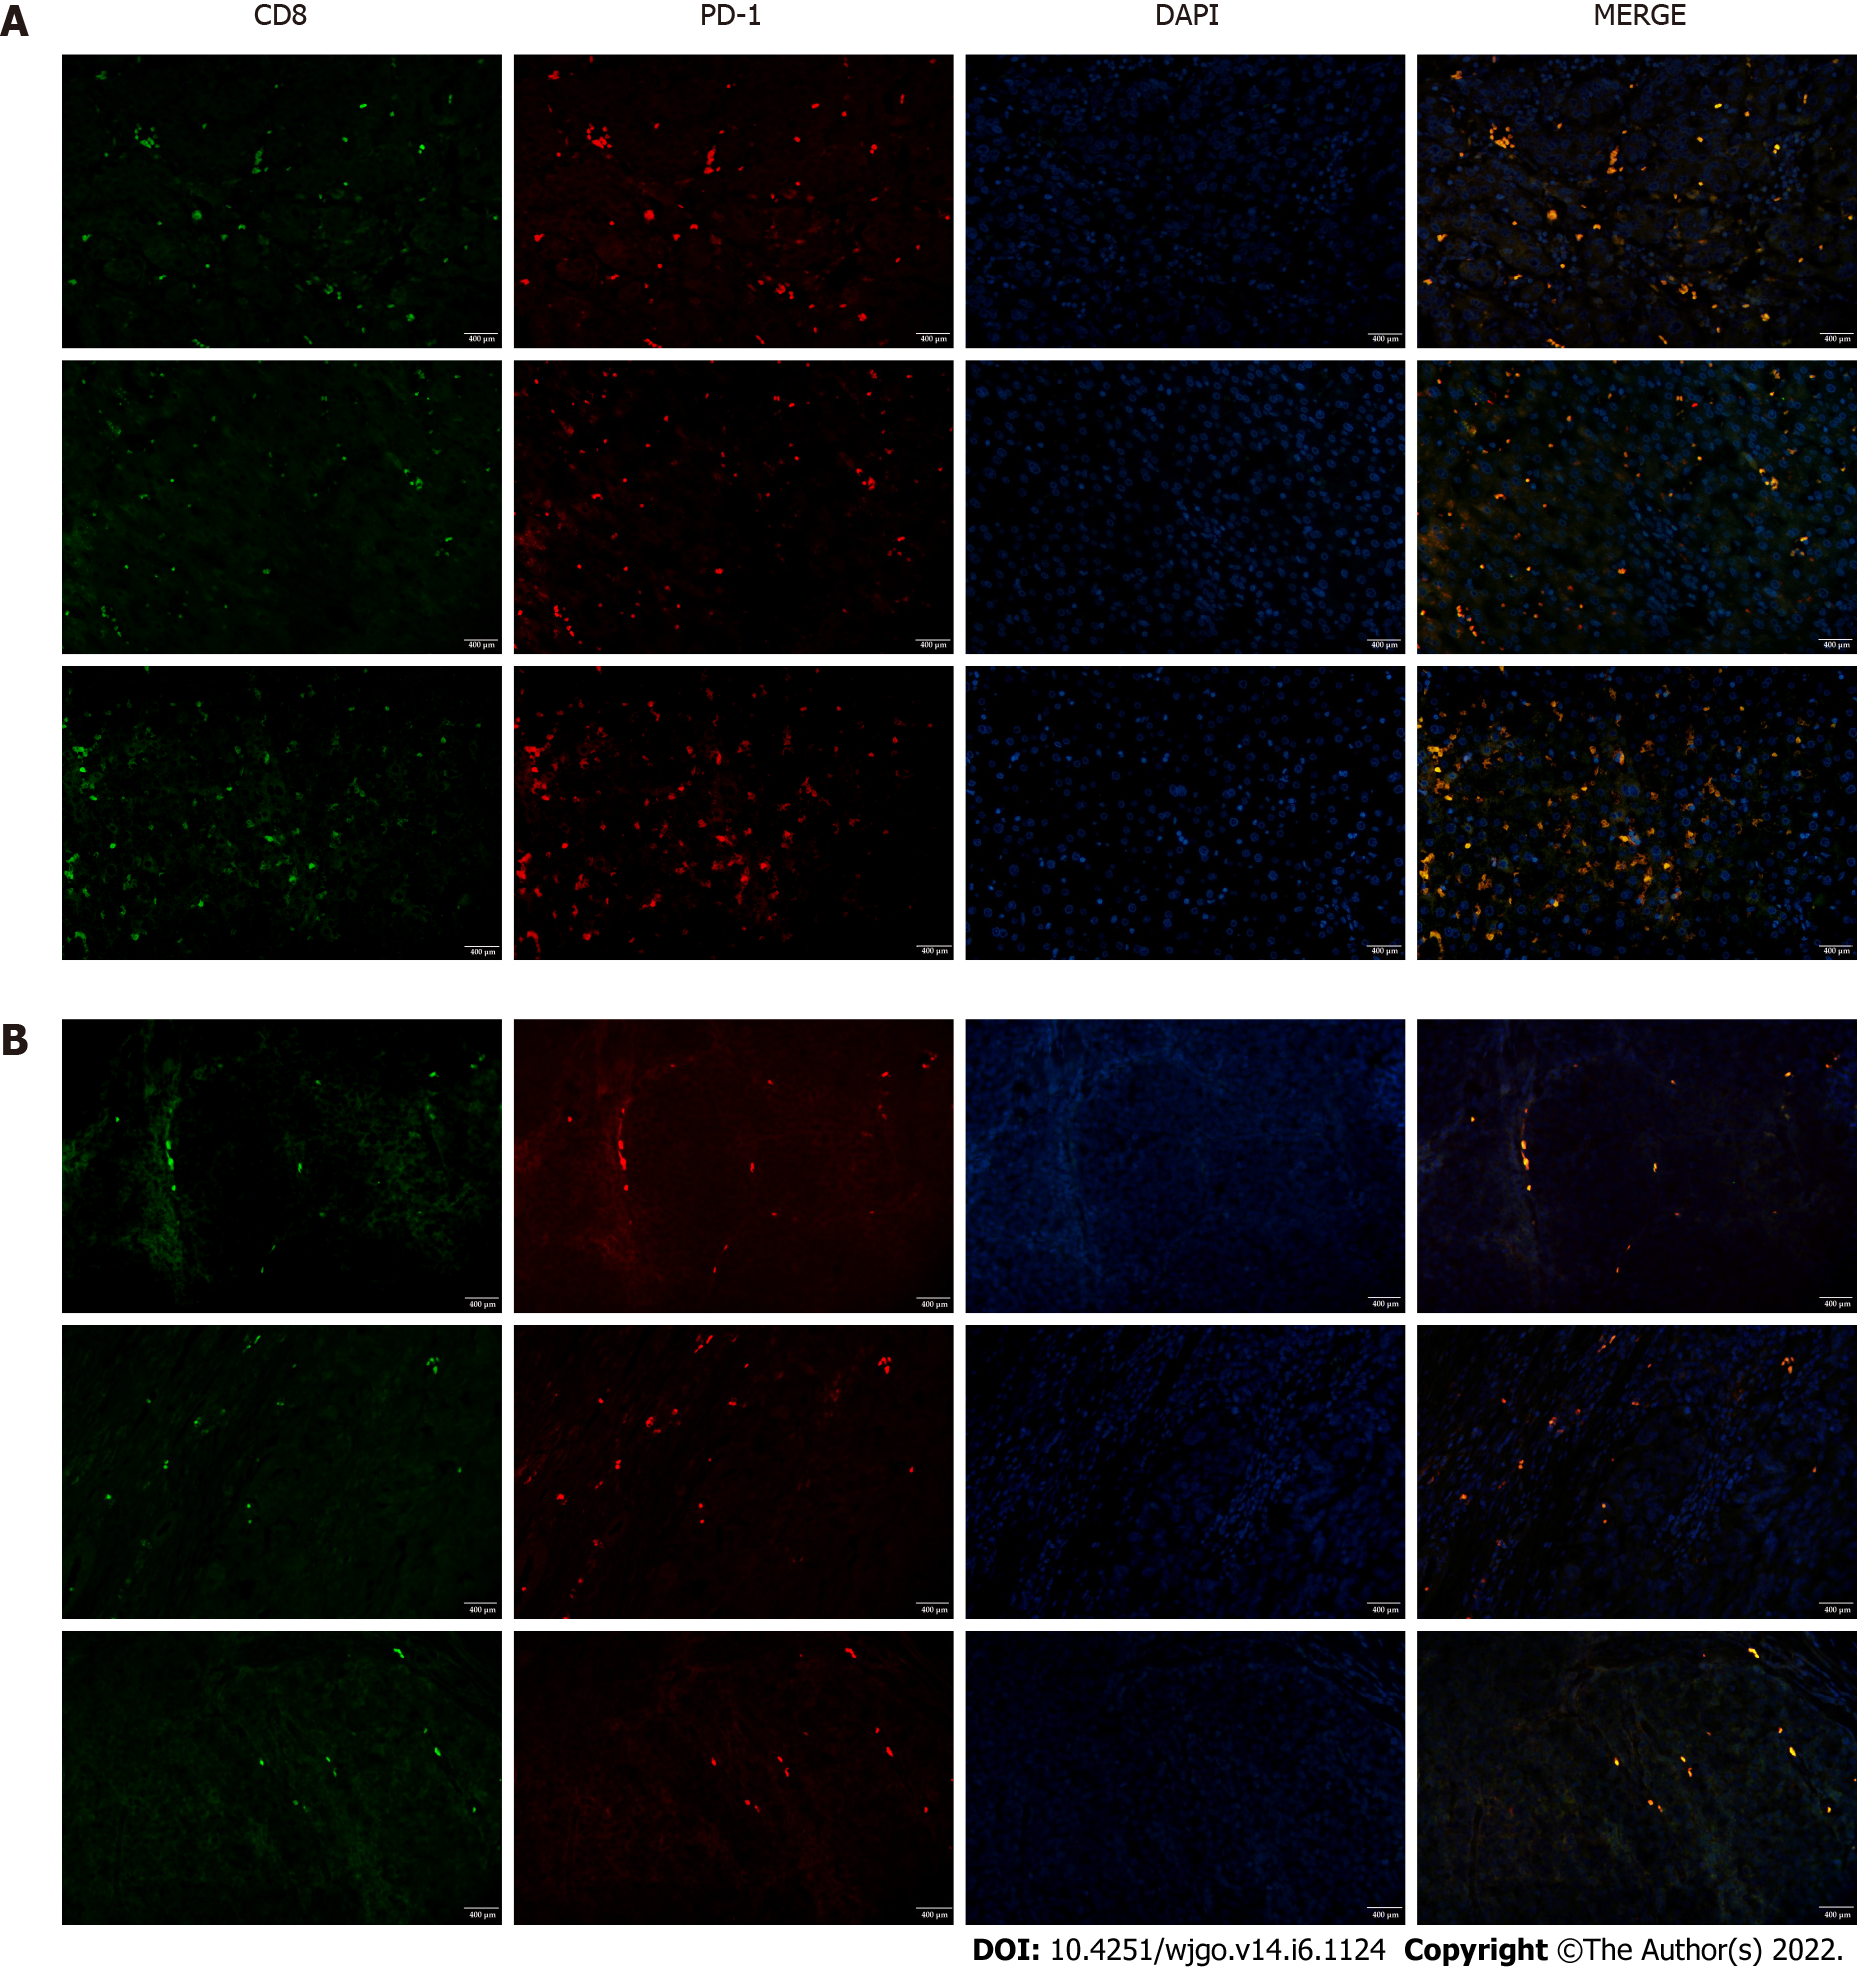
To investigate T cell infiltration in the tumor microenvironment, we performed immunohistochemical staining of resected liver tissues. The results showed significantly more CD8+ T cells in HCC tissues than in paracancerous tissues (Figure 1). Next, we used immunofluorescence staining to detect PD-1 expression on CD8+ T cells. Compared with paracancerous tissues, PD-1 was more abundantly expressed on the surface of CD8+ T cells in HCC tissues (Figure 2).
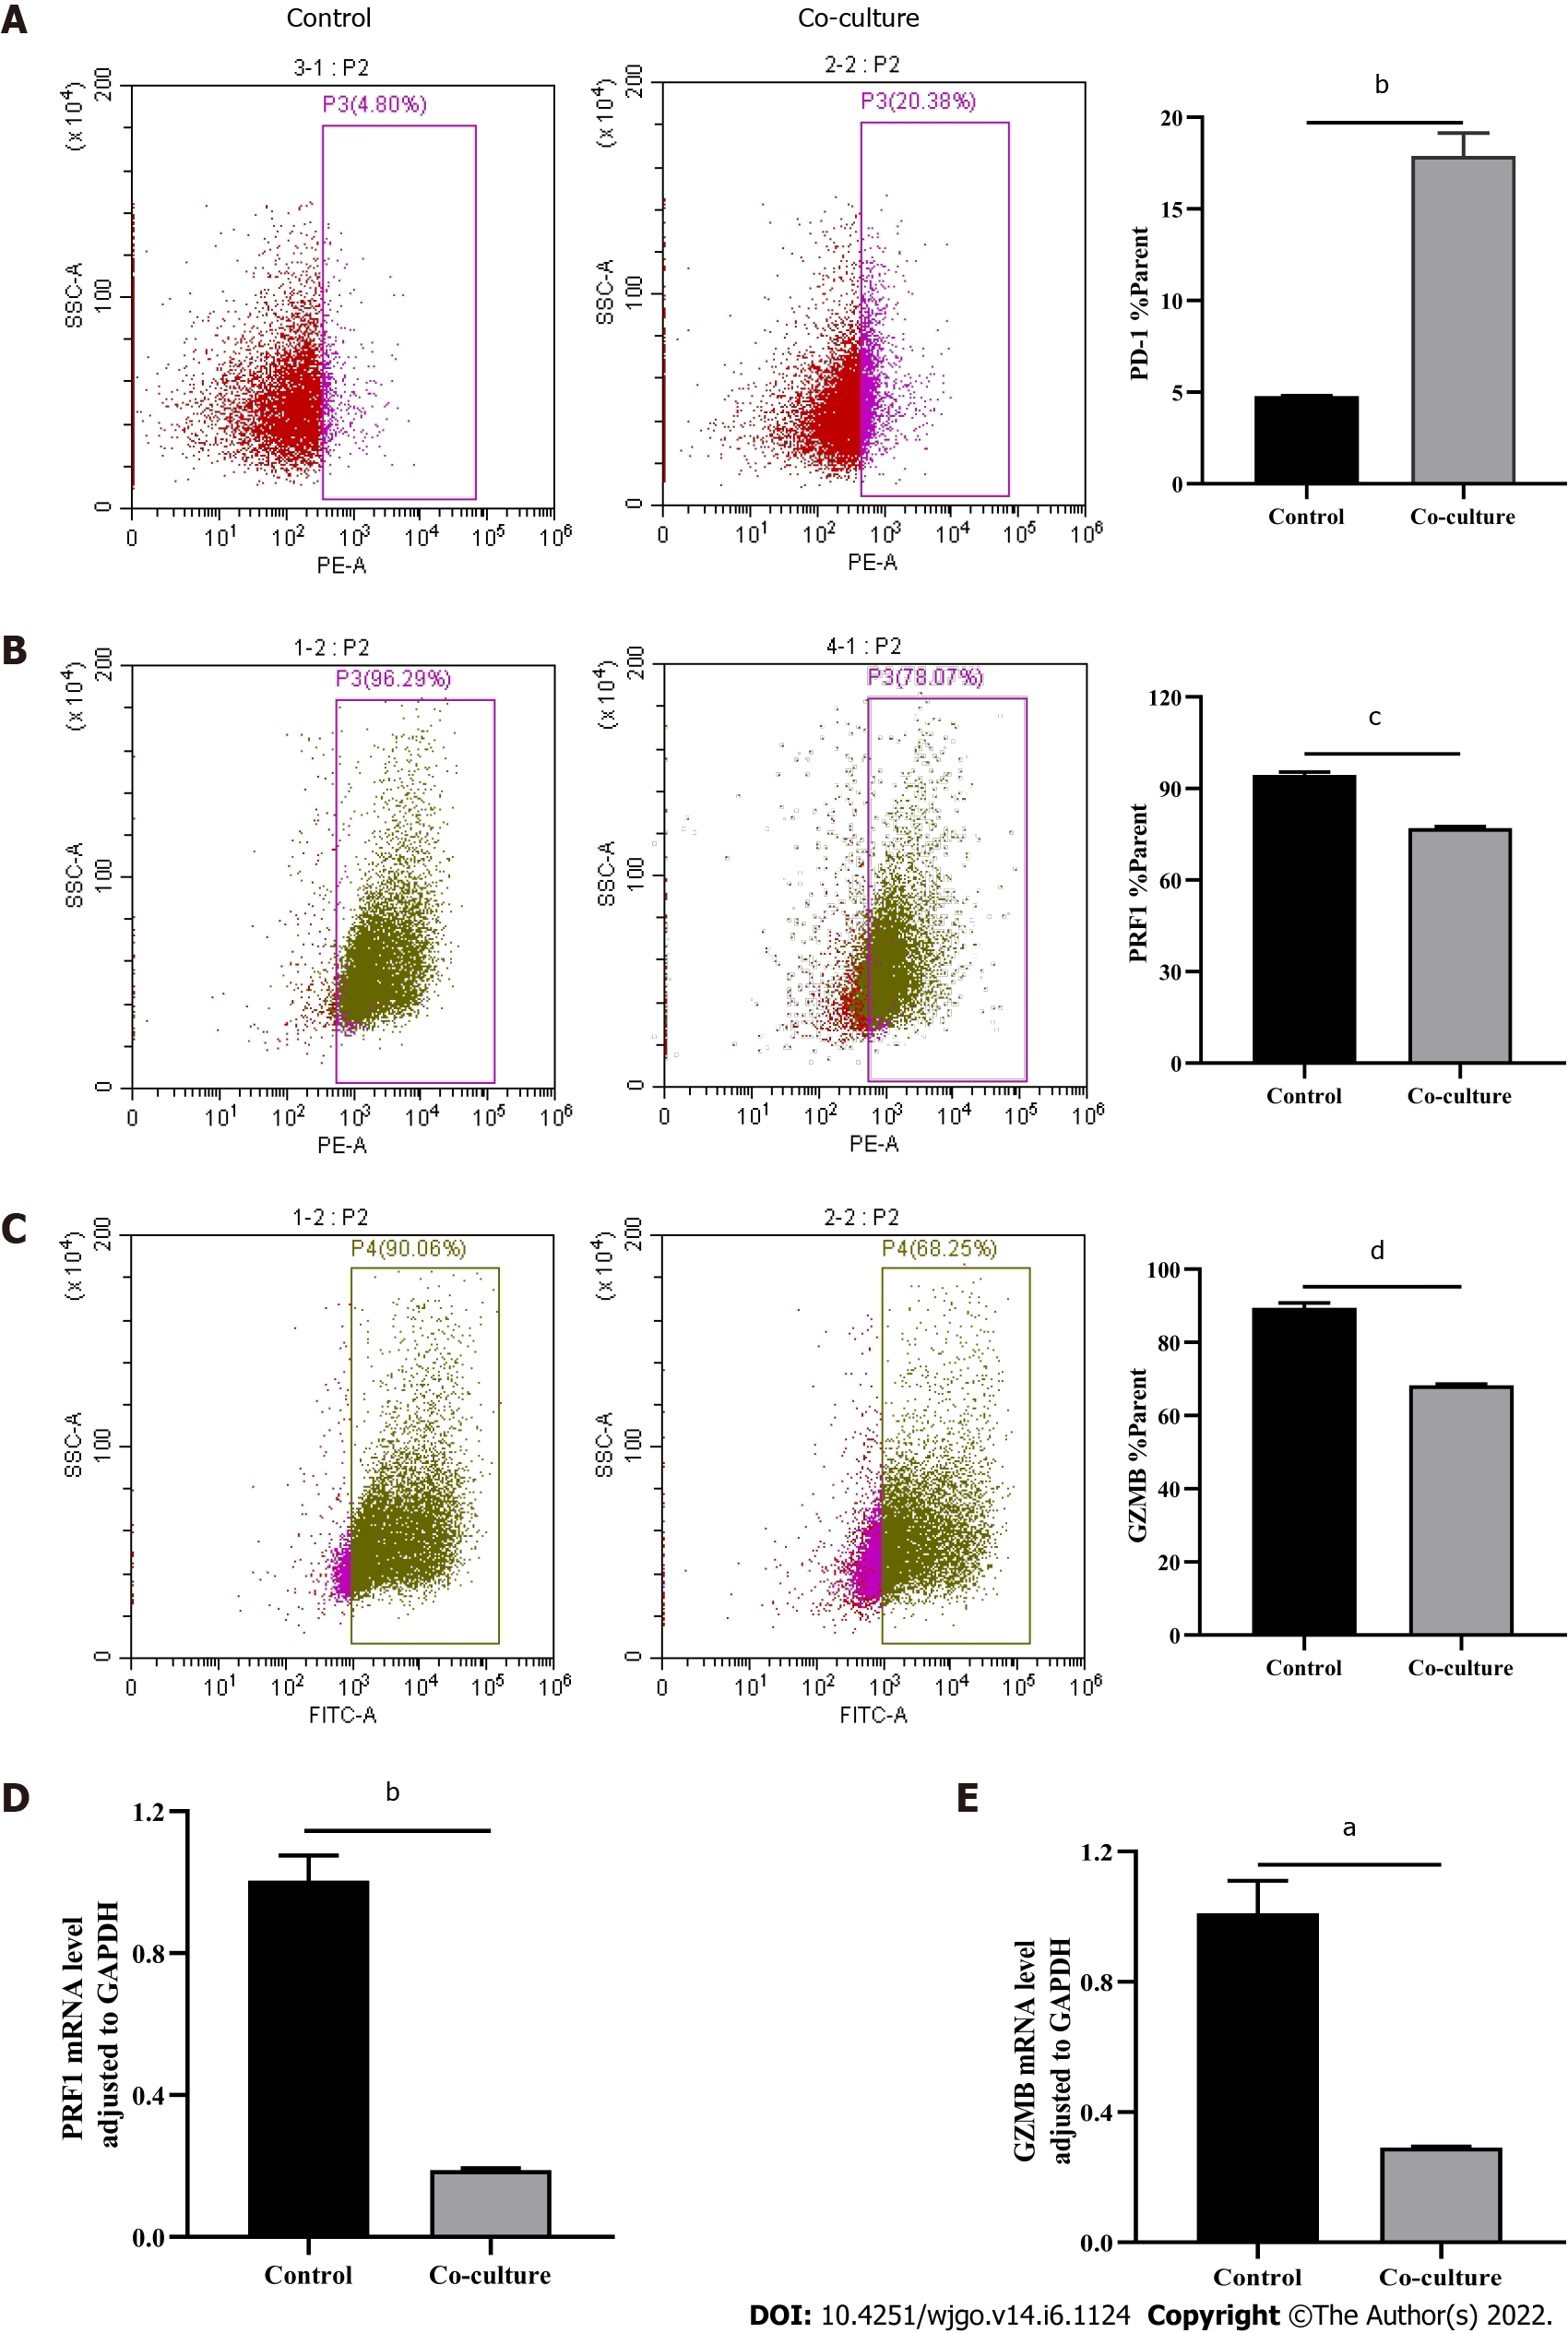
After observing a large number of infiltrating PD-1+CD8+ T cells in HCC tissues, we next co-cultured CD8+ T cells with Huh-7 cells to evaluate the functional alterations of CD8+ T cells. Flow cytometry and quantitative real-time PCR were used to examine the function of CD8+ T cells, which indicated that compared with the control group, CD8+ T cells in the co-culture group expressed higher levels of PD-1 (Figure 3A) and lower levels of GZMB and PRF1 (Figure 3B-E). Increased expression of IRs and reduced ability to secrete effector molecules suggested functional inhibition of CD8+ T cells; thus, hepatoma cells impaired the function of CD8+ T cells.
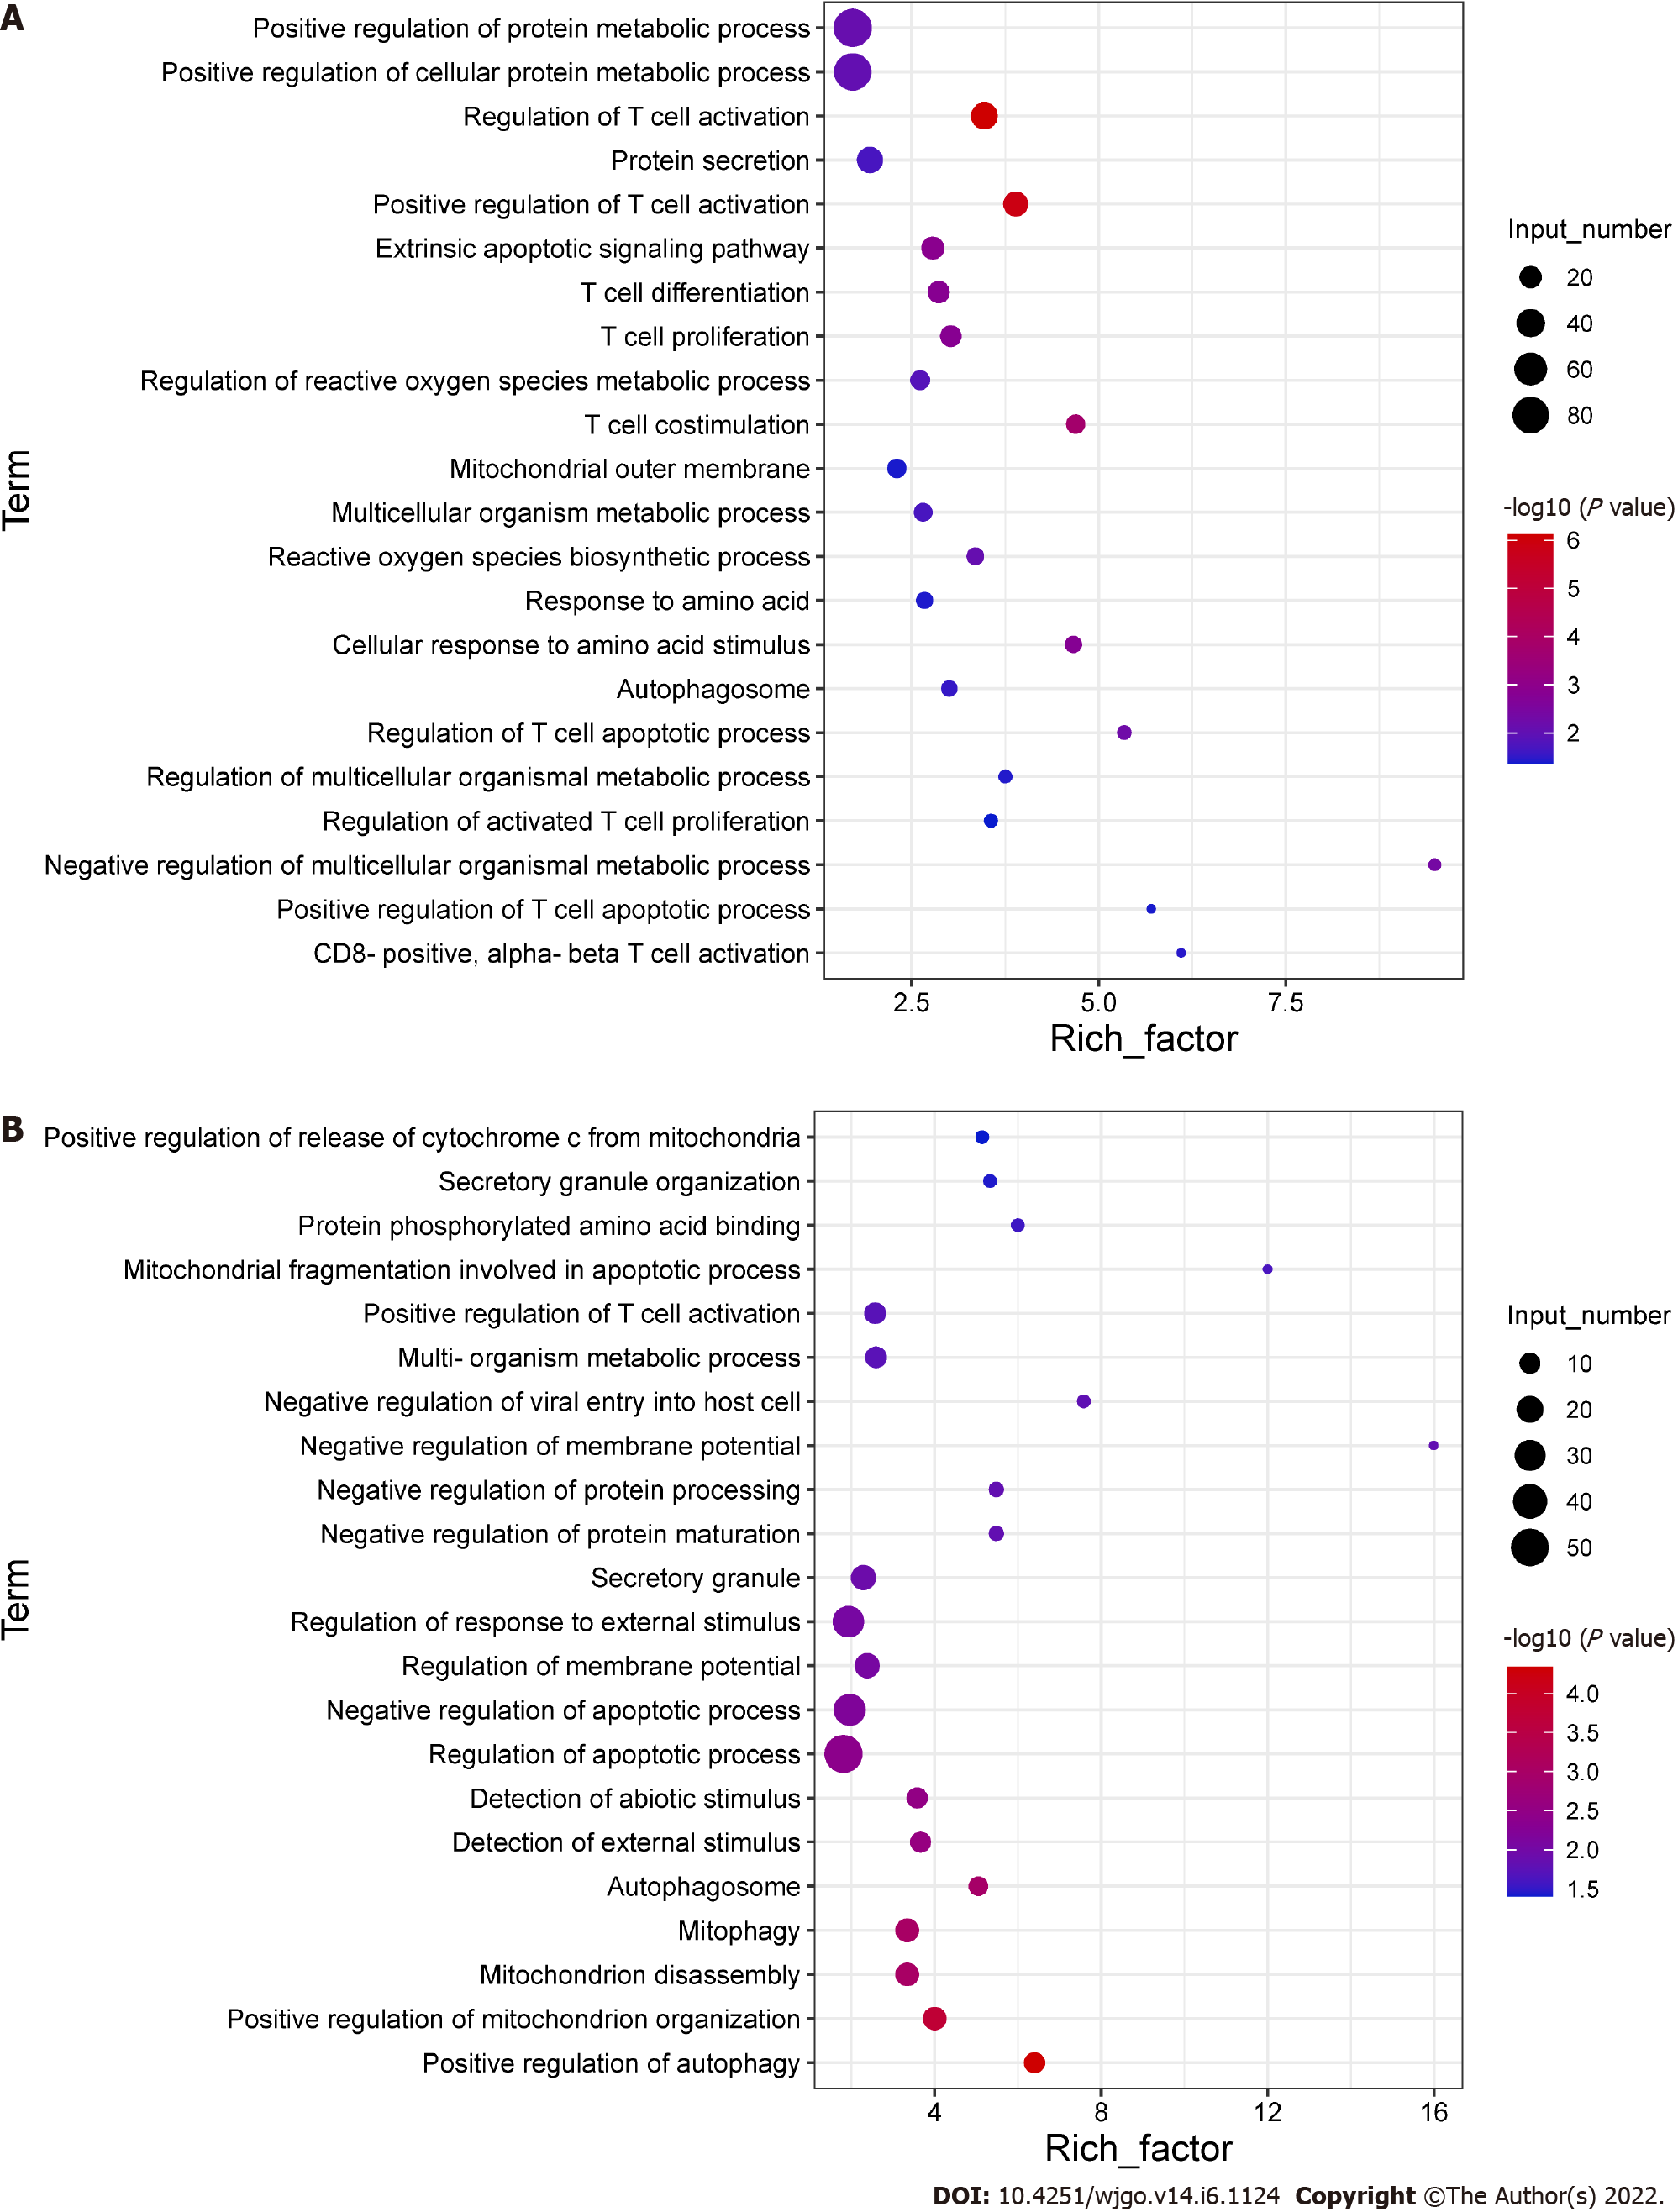
To explore the potential mechanisms of the functional impairment of T cells, we performed RNA-seq of CD8+ T cells co-cultured with Huh-7 cells. We found that genes related to mitochondrial damage (such as mitochondrion disassembly) and apoptosis (such as regulation of apoptotic pathways) were upregulated (Figure 4A). The expression of genes related to cell metabolism (such as multi-organism metabolic processes) and T cell function (such as T cell proliferation) was downregulated (Figure 4B). These data illustrated that CD8+ T cells co-cultured with hepatoma cells underwent alterations associated with cellular metabolism, mitochondrial damage, and apoptosis.
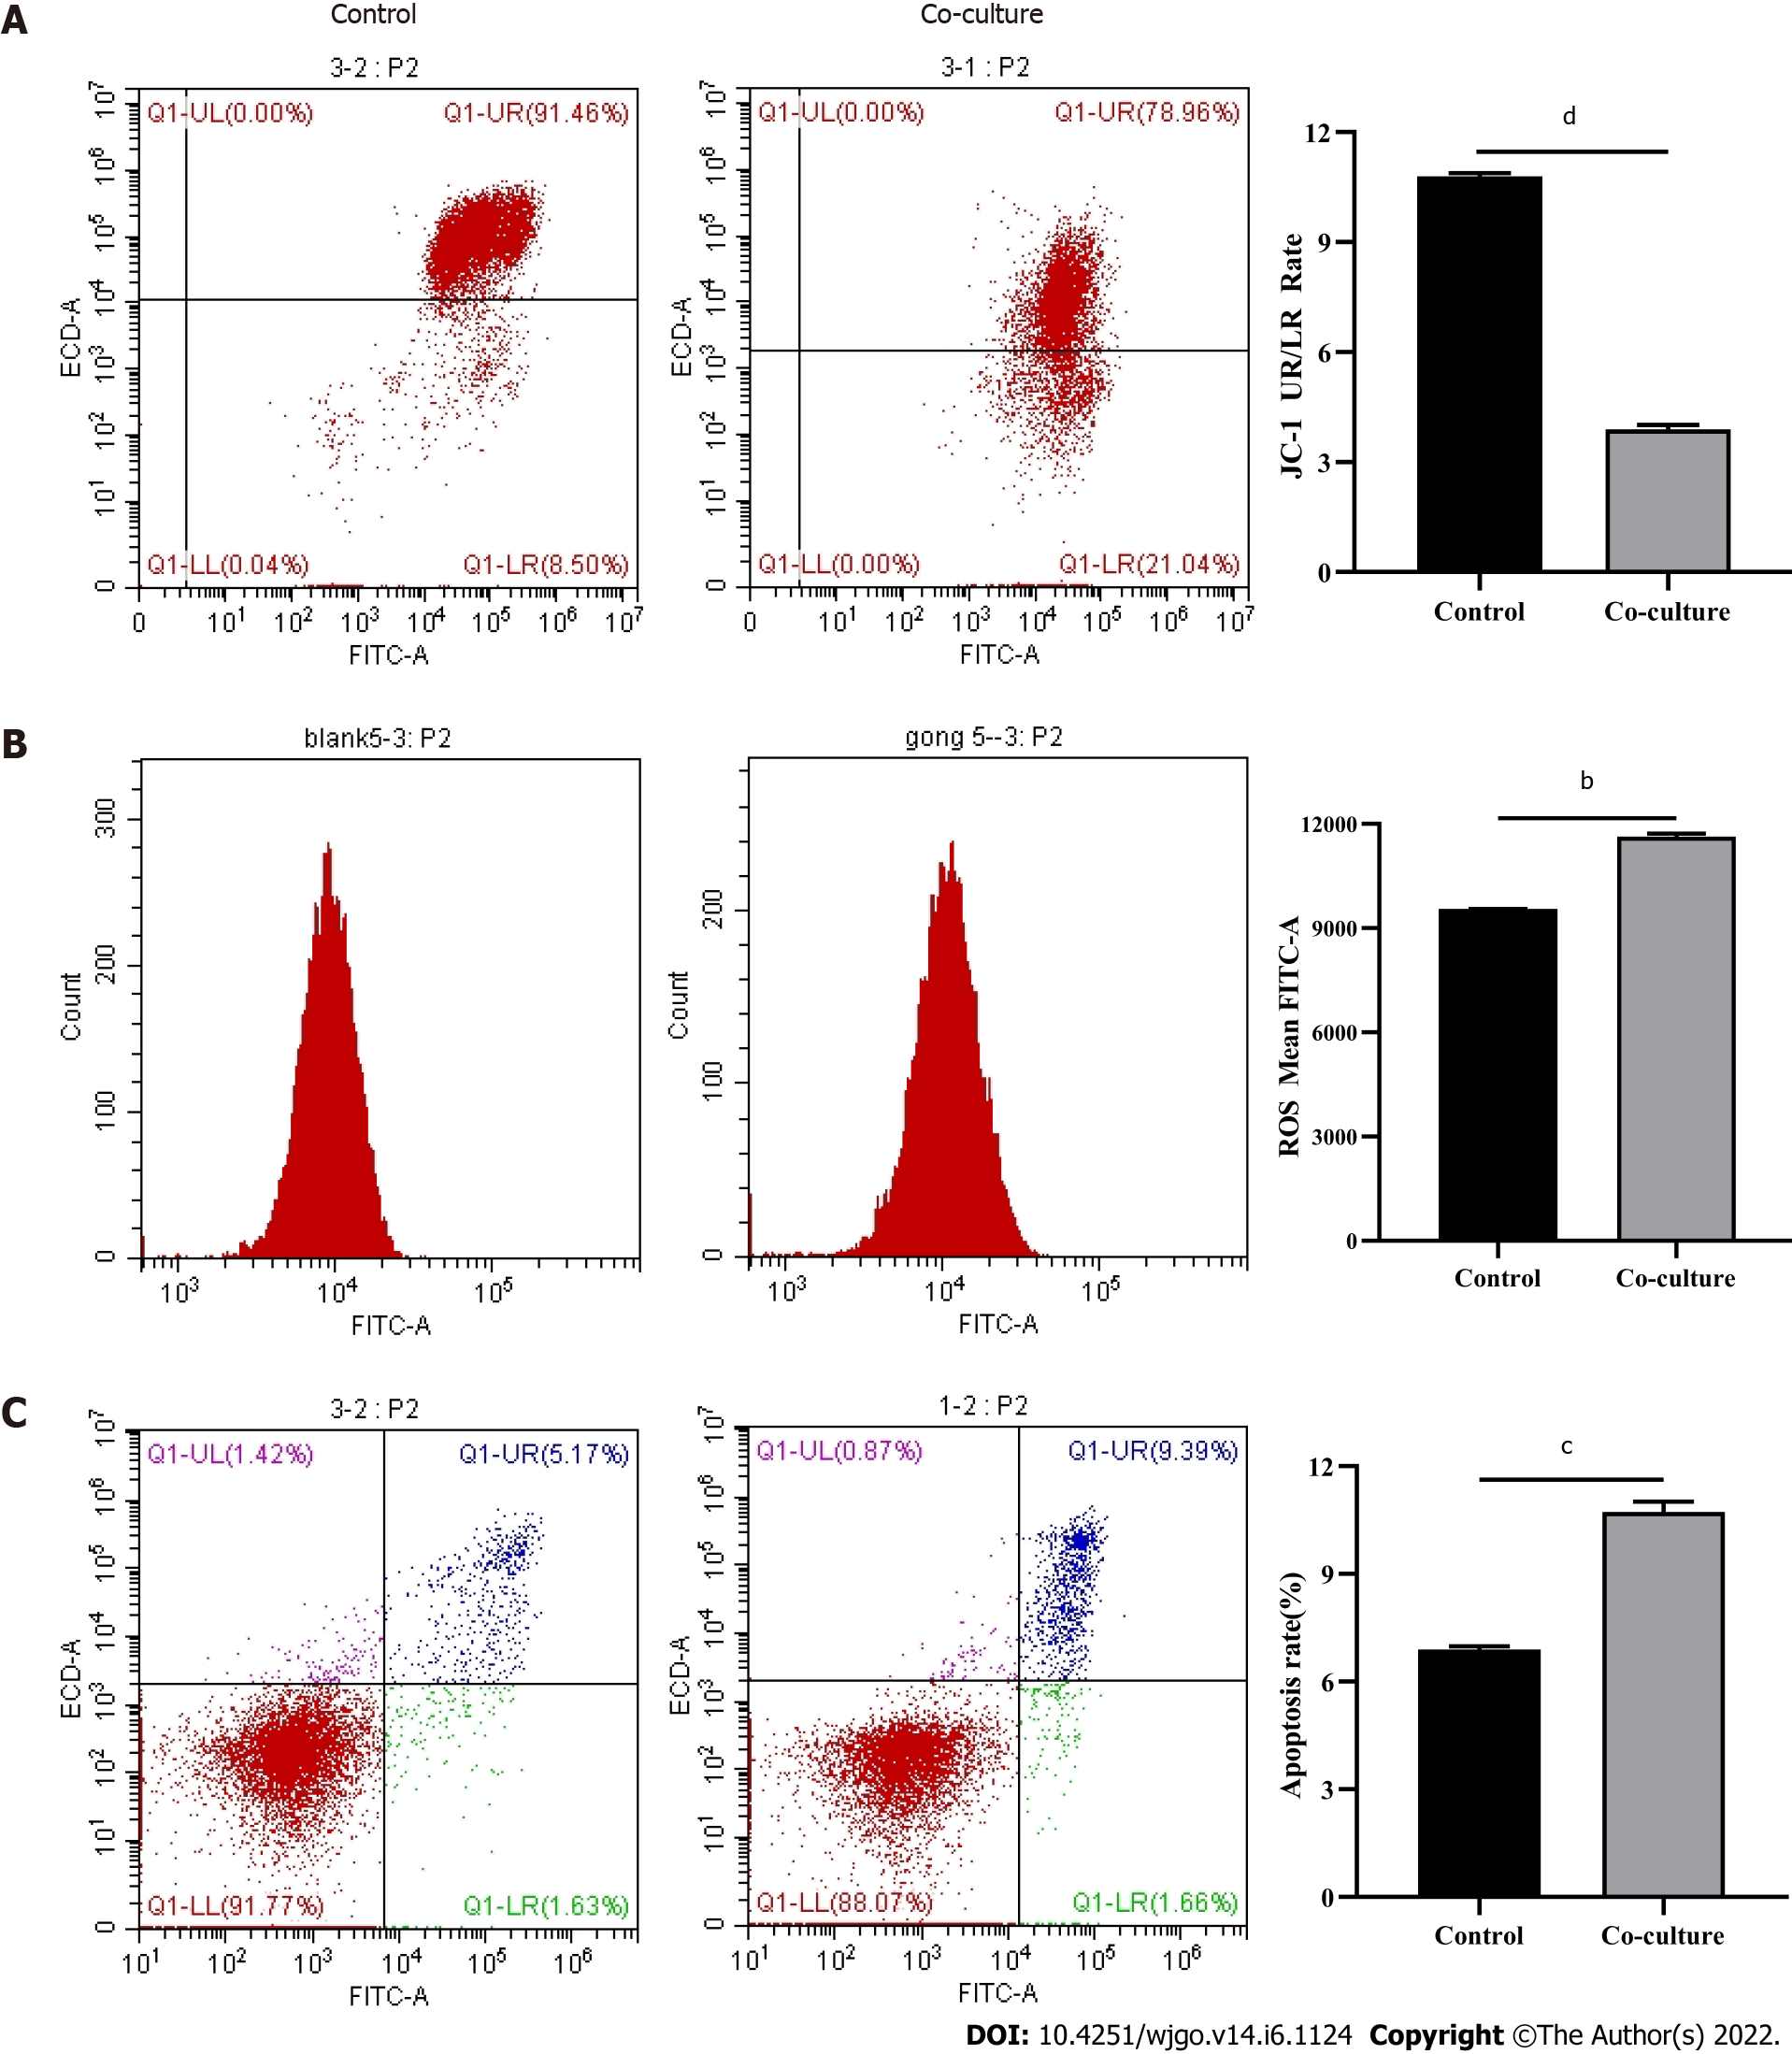
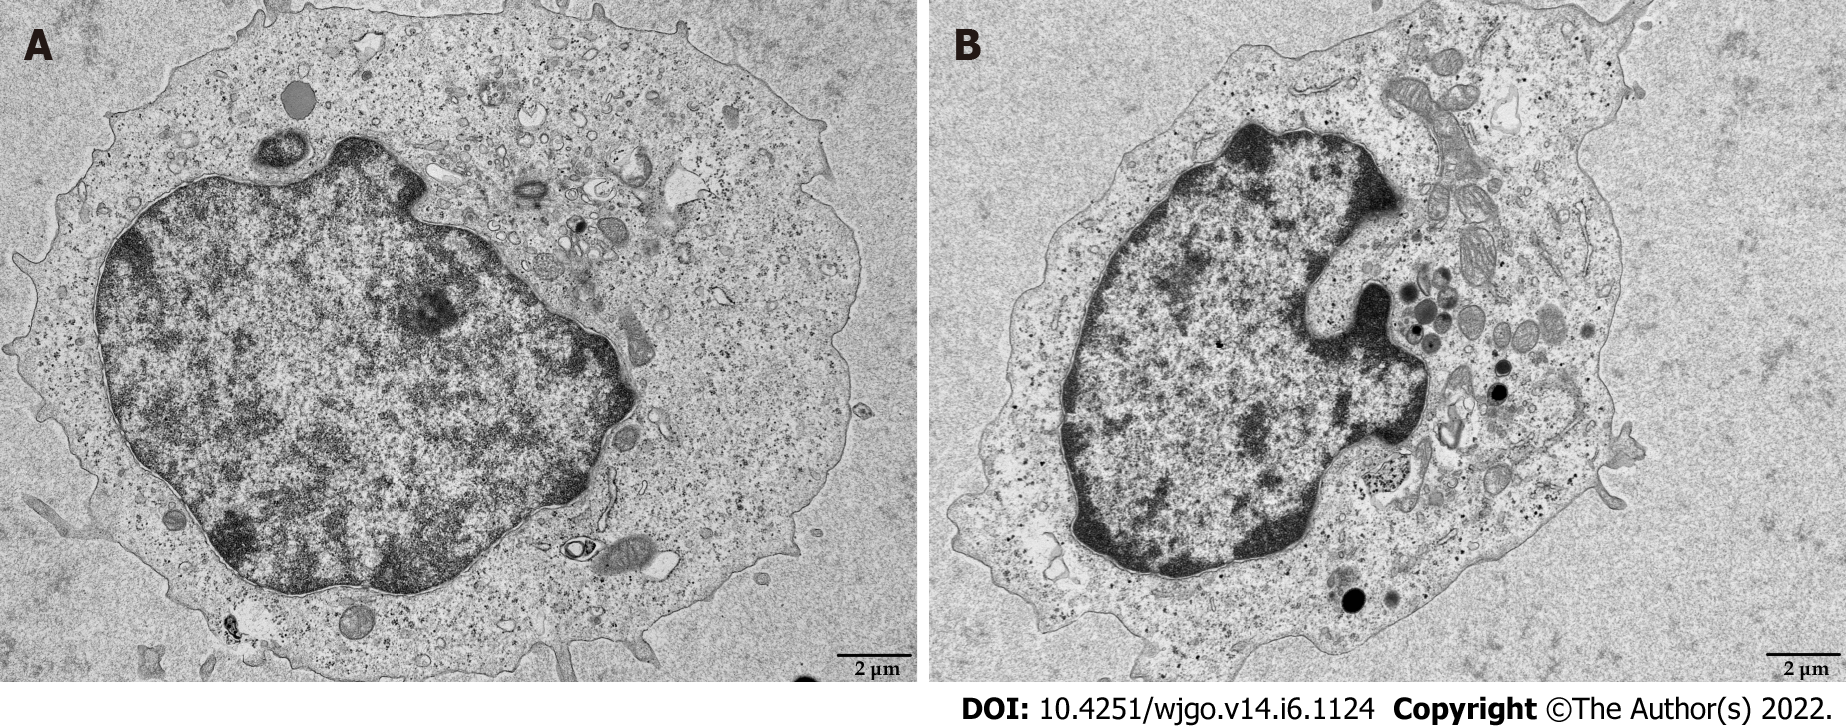
Mitochondria are the primary source of ROS production, and JC-1 is a dye used to reflect mitochondrial integrity. To examine whether hepatoma cells have a regulatory effect on CD8+ T cell mitochondria, CD8+ T cells were co-cultured with Huh-7 cells. Flow cytometry analysis revealed that CD8+ T cells from the co-culture group had decreased JC-1 staining (Figure 5A) and increased levels of ROS (Figure 5B) and apoptosis (Figure 5C) compared with the control group. Next, mitochondrial morphology was further studied by TEM to examine the ultrastructure of mitochondria. Mitochondria of CD8+ T cells from the control group were identified with well-defined integral two-layer membranes and regular cristae (Figure 6A). In contrast, mitochondria of CD8+ T cells in the co-culture group showed significant swelling (Figure 6B). In summary, co-culture with hepatoma cells induced damage to the mitochondria of CD8+ T cells and caused apoptosis.
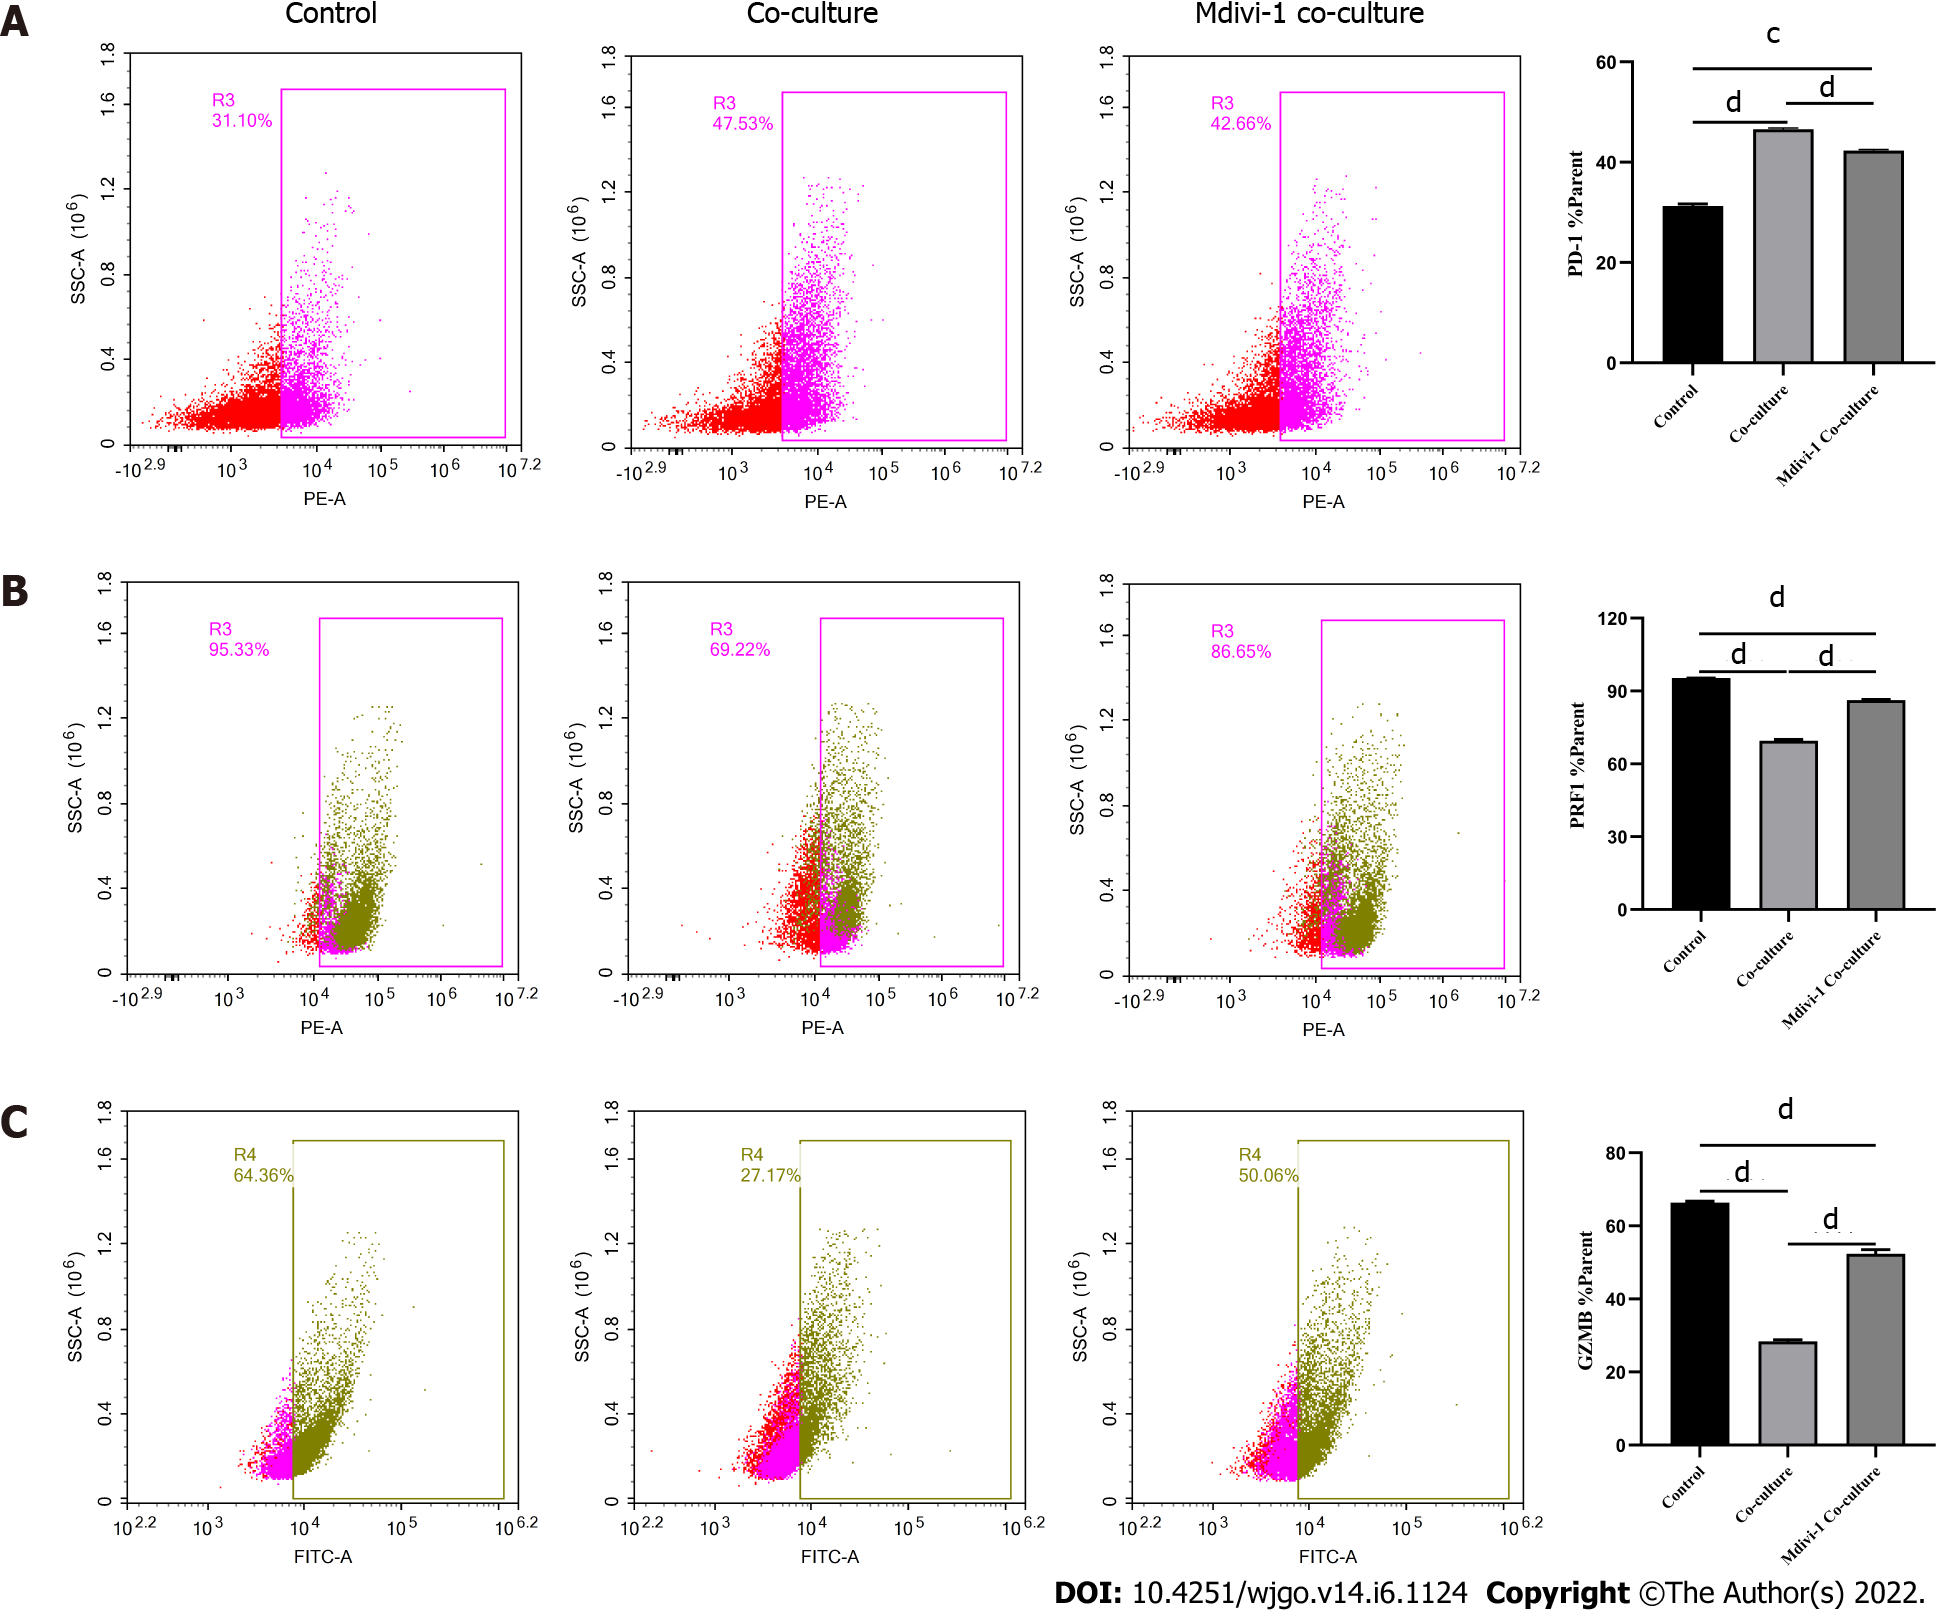
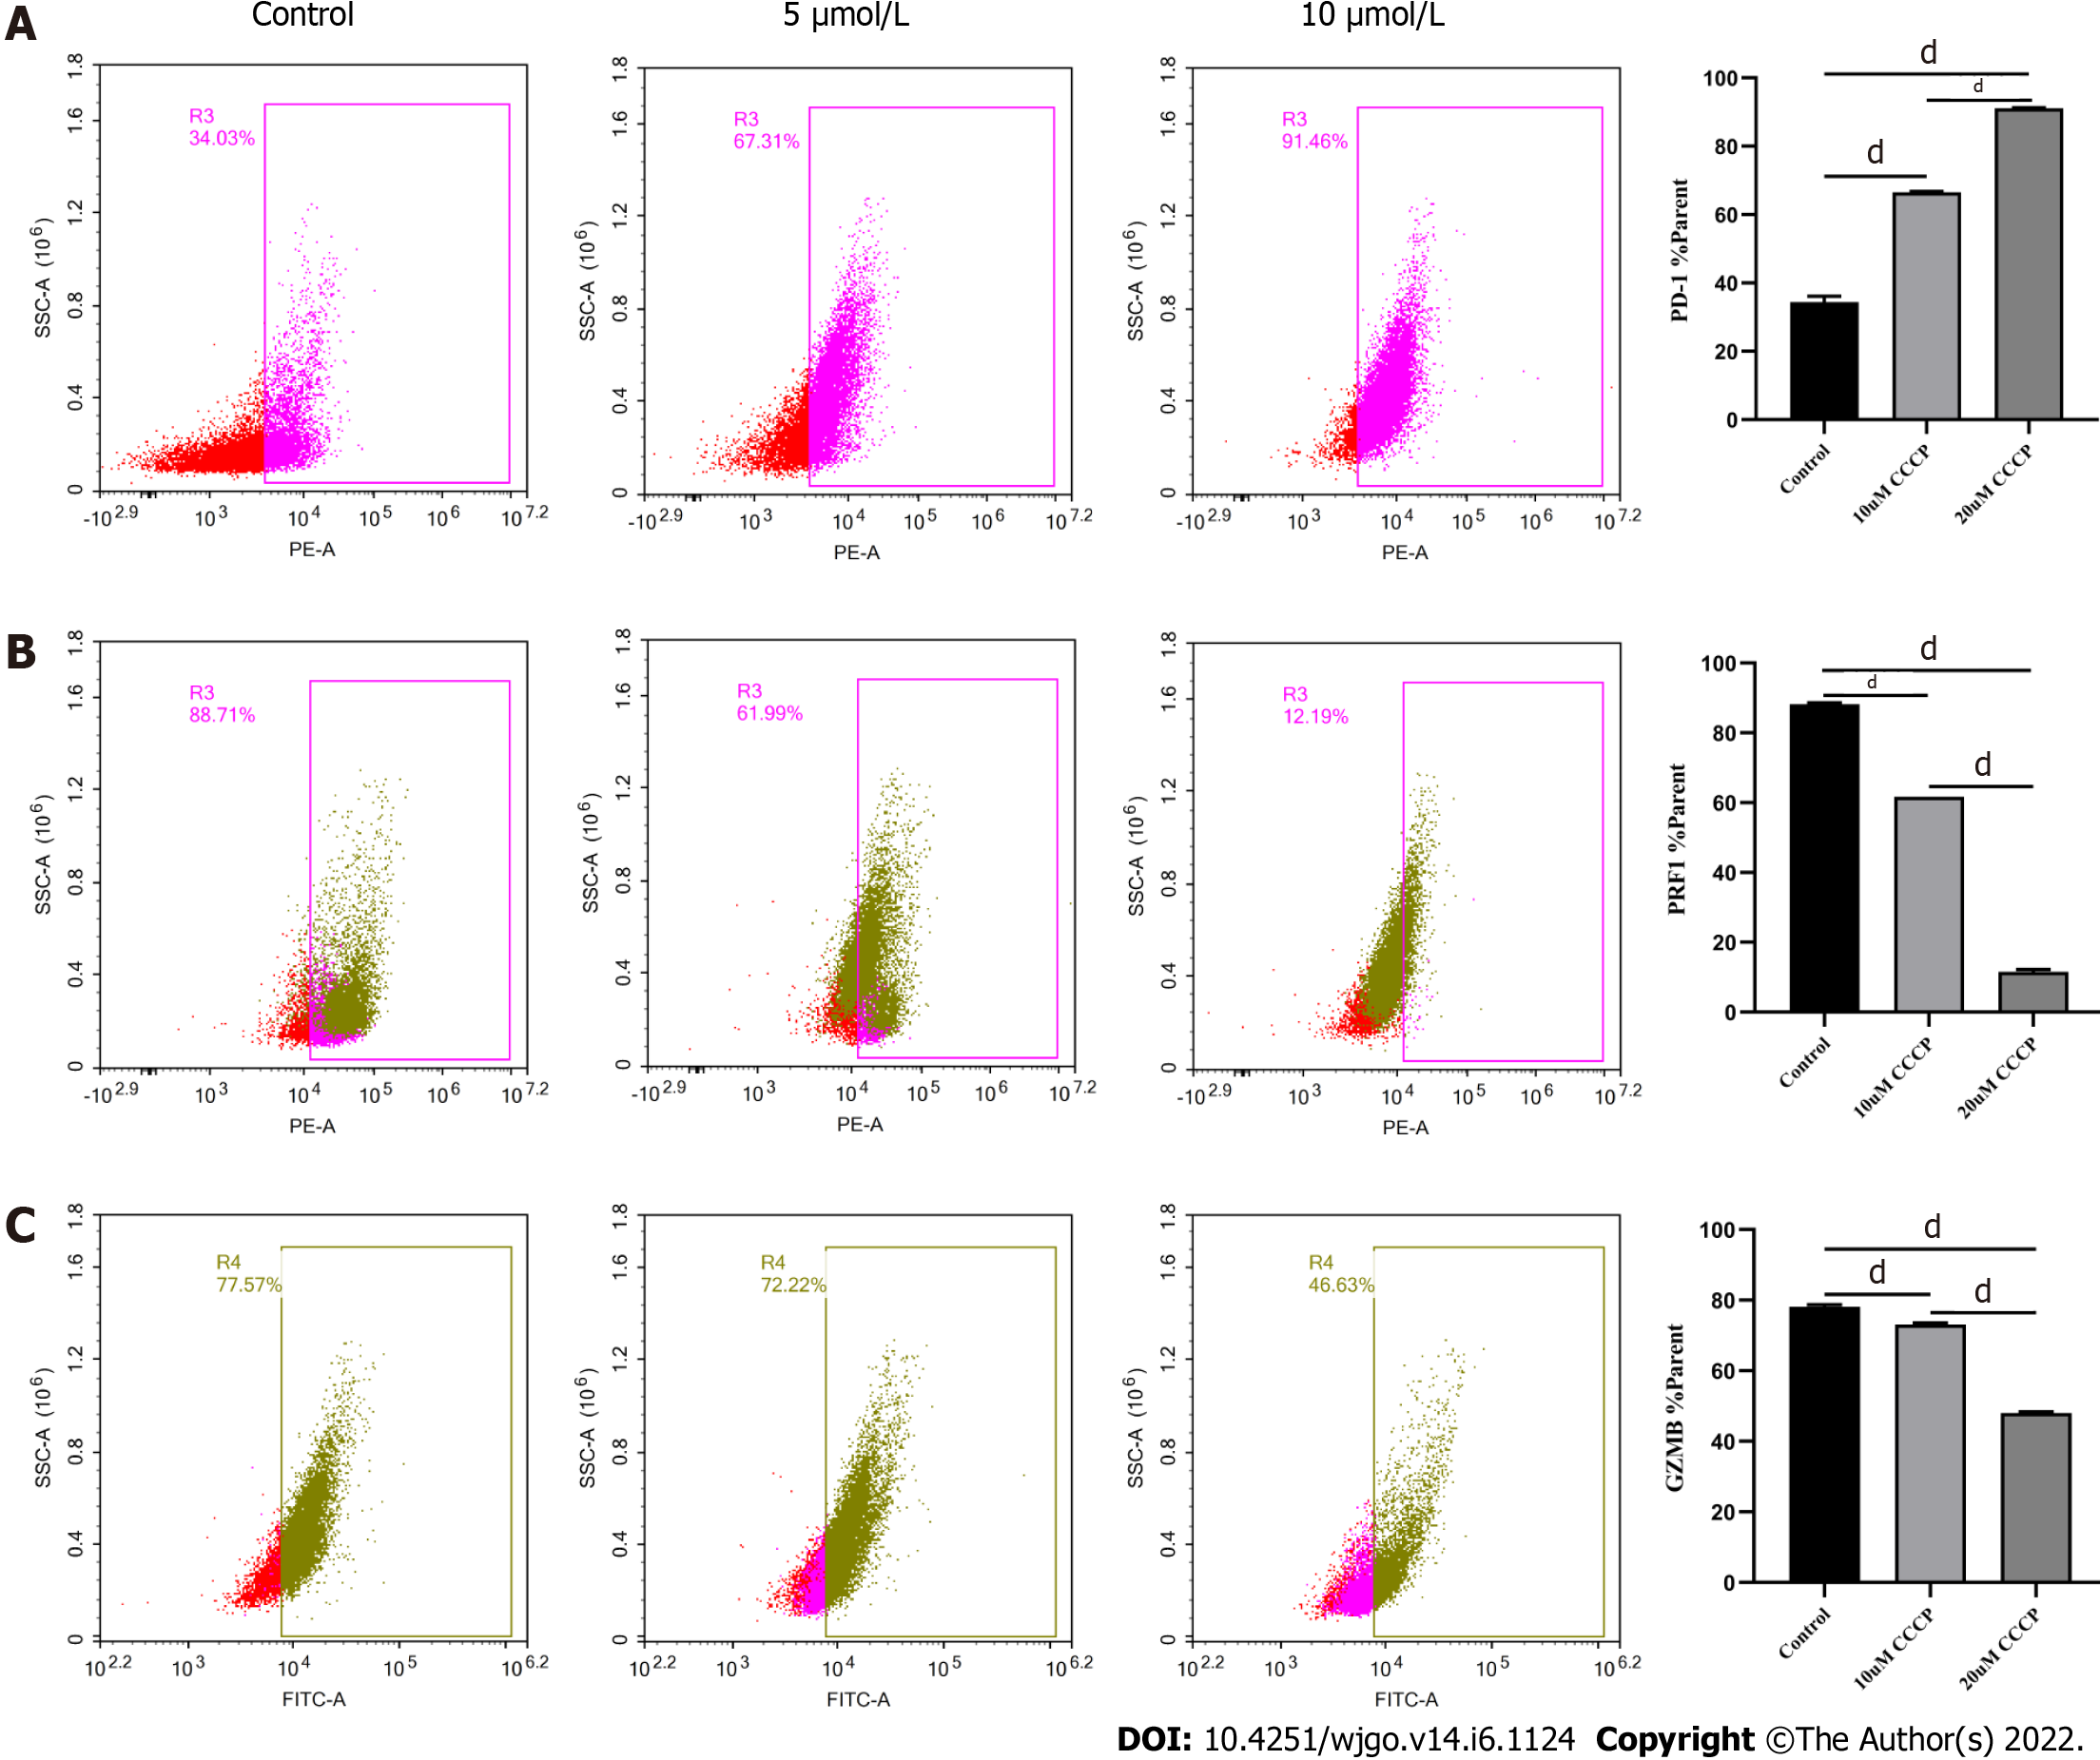
Next, we explored the relationship between mitochondrial damage and T cell function in infiltrating CD8+ T cells in HCC. First, we co-cultured CD8+ T cells with Huh-7 cells, with mitochondrial division inhibitor 1 (Mdivi-1) added to the culture system, which has been shown to protect from mitochondrial damage. Flow cytometry was used to examine the function of Mdivi-1-treated CD8+ T cells in co-culture. The results showed reduced expression of PD-1 (Figure 7A) and increased expression of PRF1 (Figure 7B) and GZMB (Figure 7C) in CD8+ T cells from the Mdivi-1 group compared with CD8+ T cells from the co-culture alone group, demonstrating that the function of co-cultured CD8+ T cells was not decreased after protecting from mitochondrial damage. Next, we cultured CD8+ T cells with different concentrations of the oxidative phosphorylation uncoupler carbonyl cyanide-3-chlorophenylhydrazone (CCCP) and examined their function. As shown from flow cytometry analysis, PD-1 expression gradually increased (Figure 8A), and there was a gradual decrease in the secretion of PRF1 (Figure 8B) and GZMB (Figure 8C) by CD8+ T cells with increasing CCCP concentrations. These results illustrated that mitochondrial damage led to the inhibition of CD8+ T cell function. In summary, co-culture with hepatoma cells impaired the function of CD8+ T cells through the mitochondrial damage pathway.
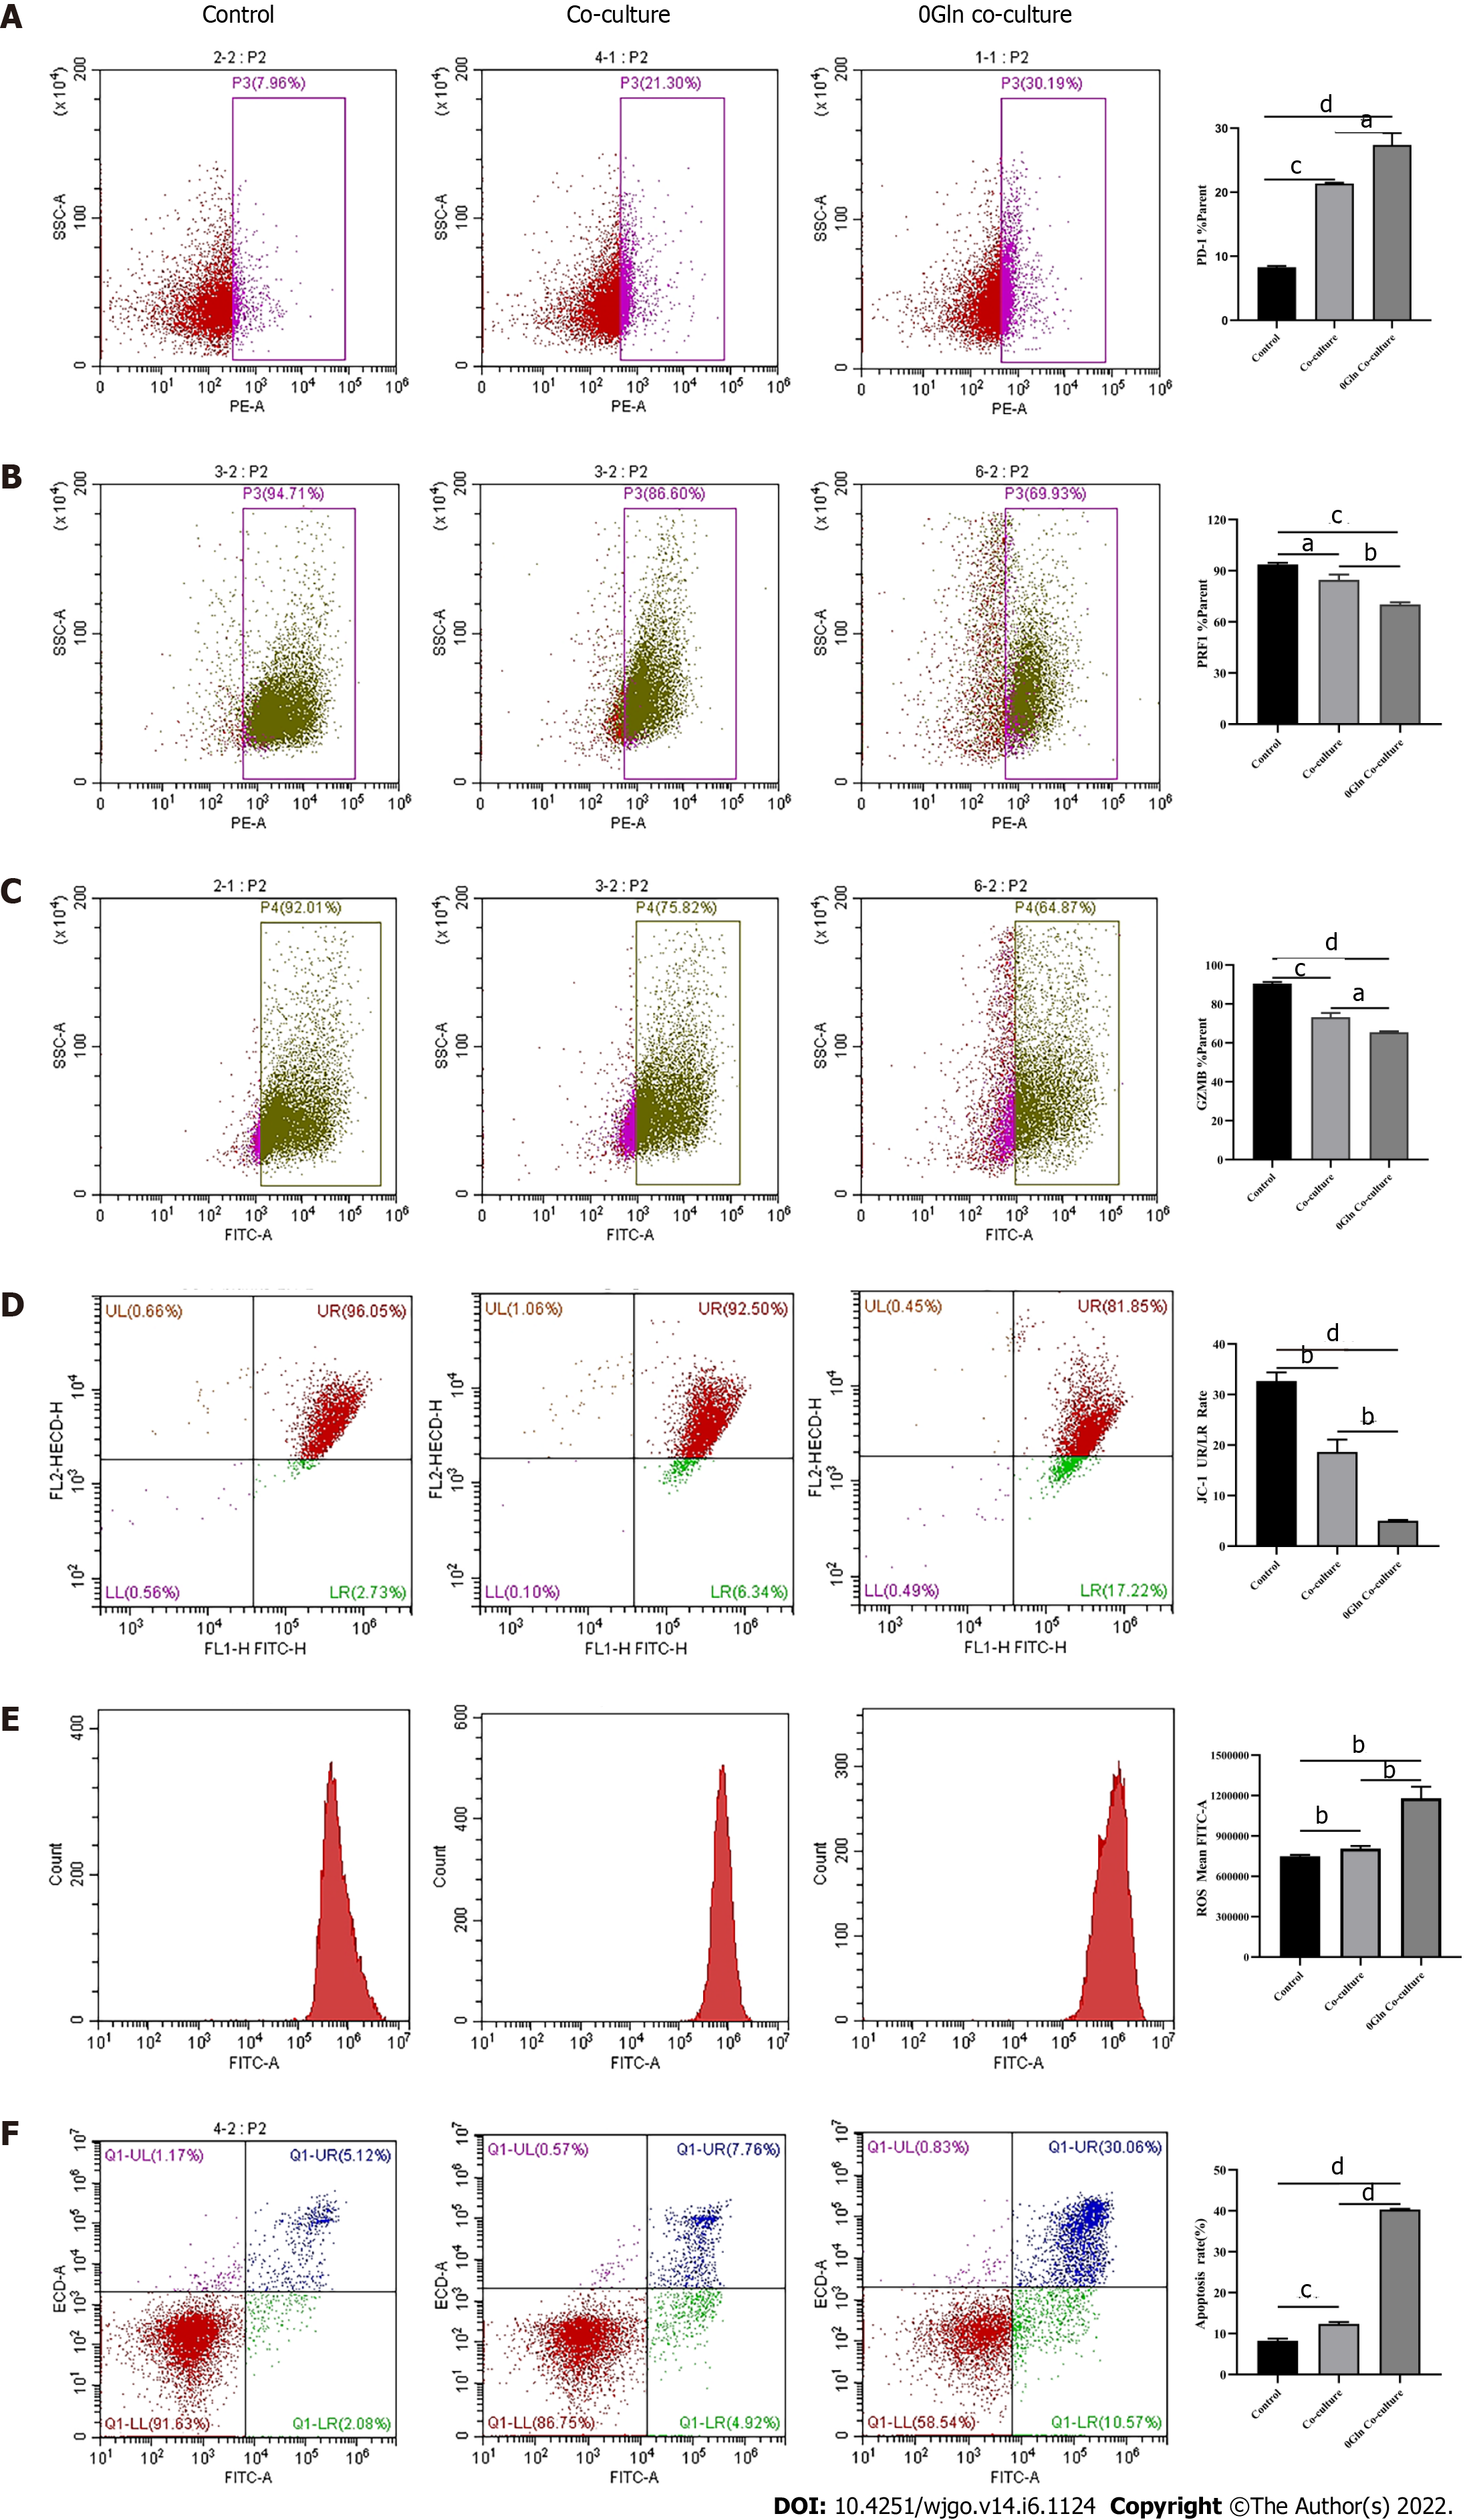
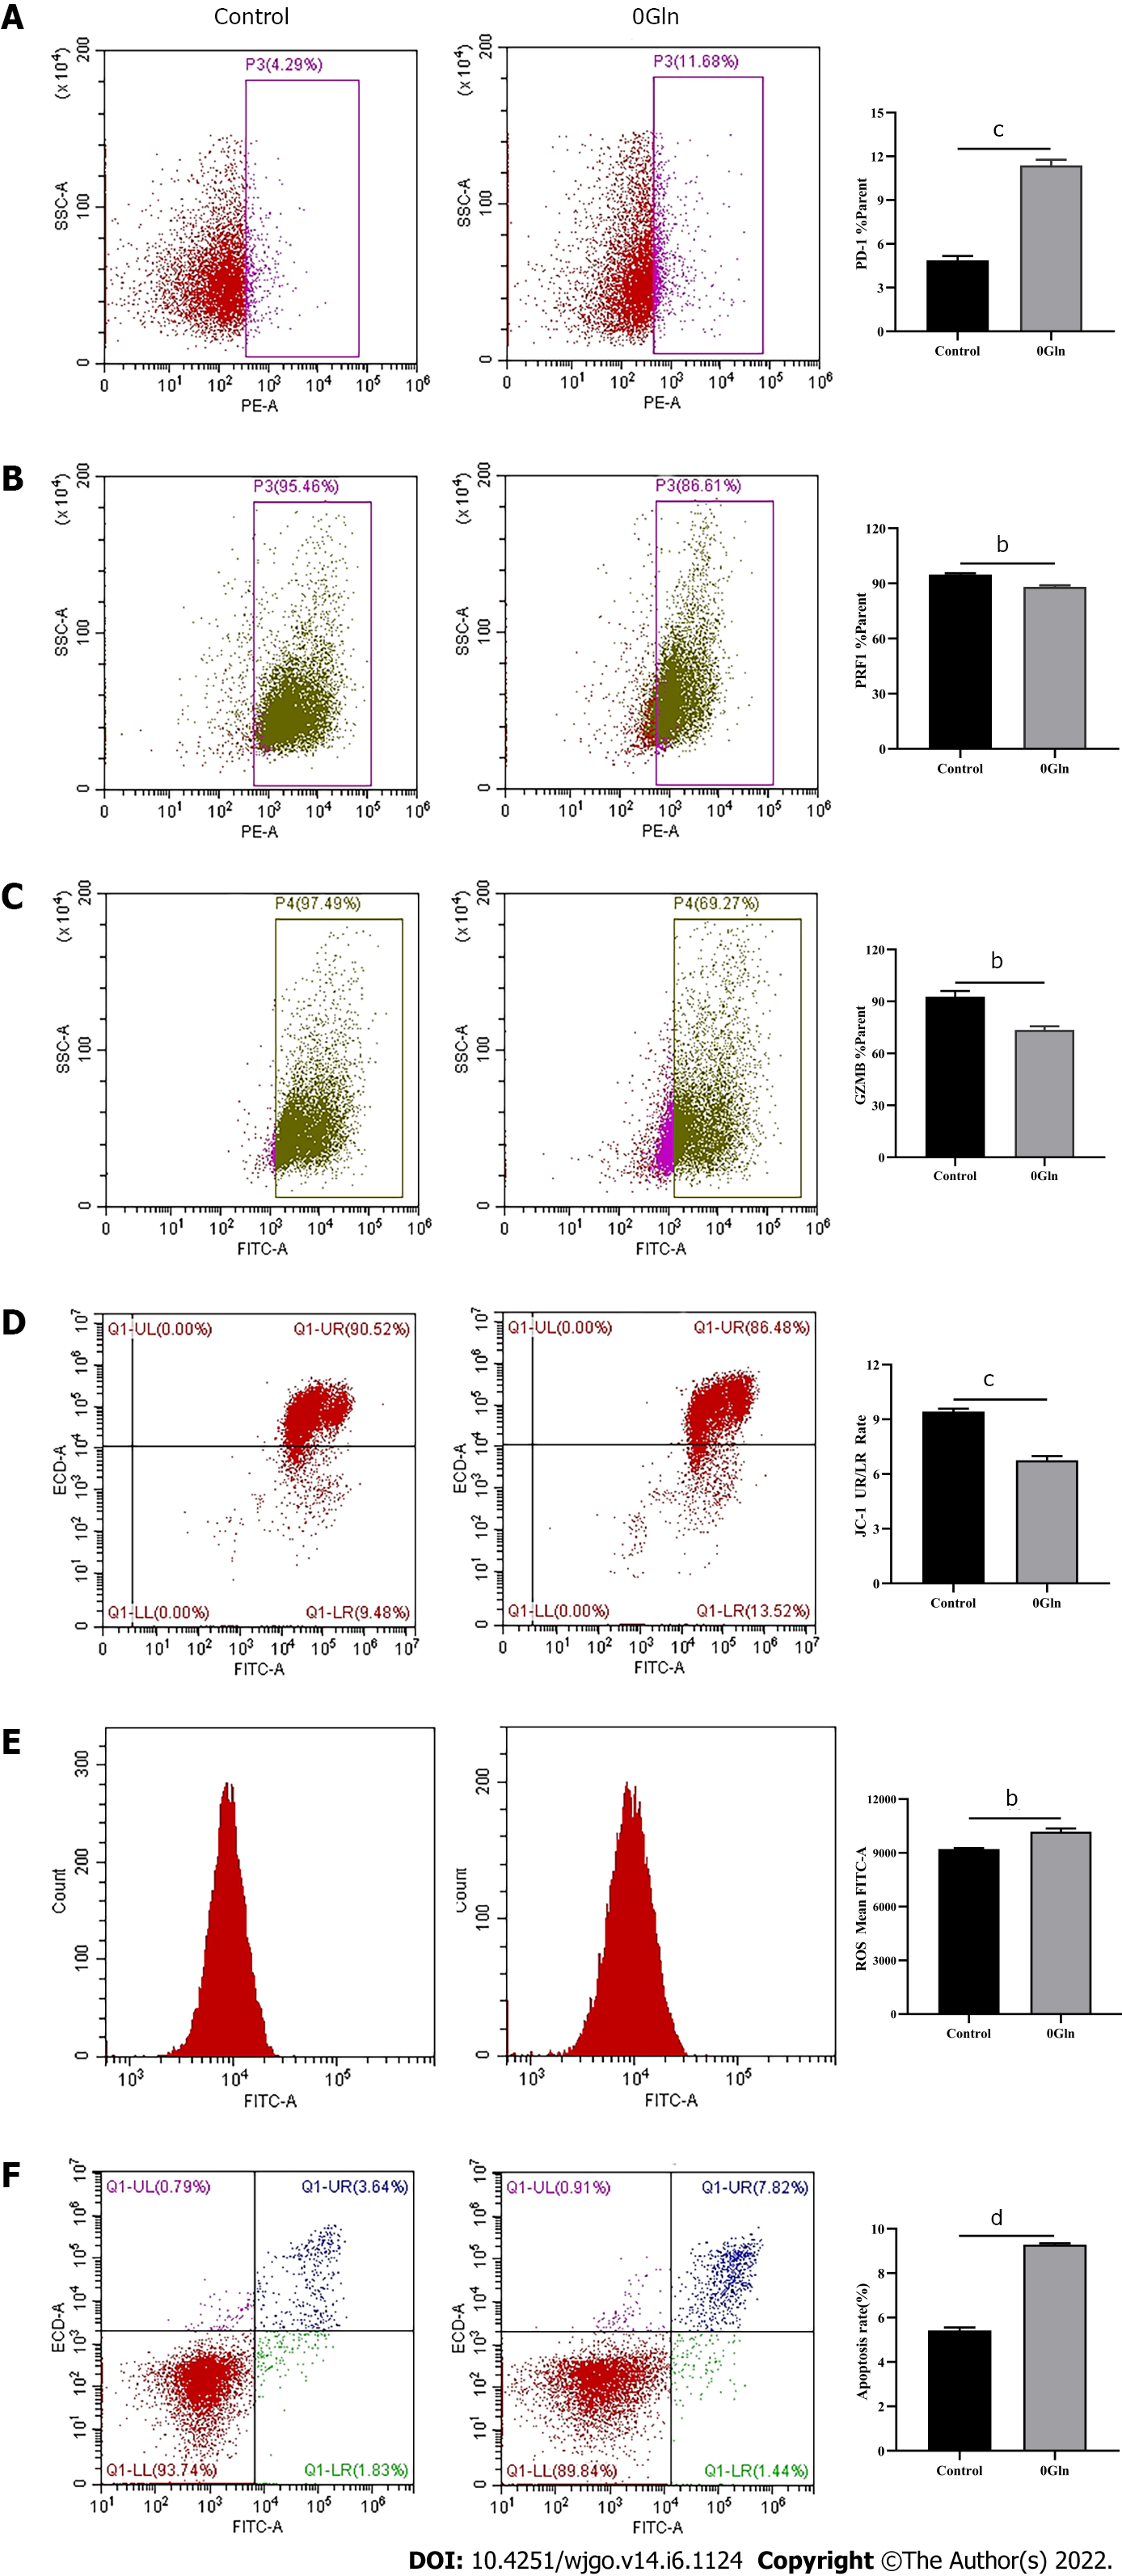
As a primary energy source, Gln affects both the development of tumor cells and the functions of immune cells. Therefore, we assessed whether Gln metabolism affects the function of CD8+ T cells. We co-cultured CD8+ T cells with Huh-7 cells and supplemented the co-culture system with RPMI 1640 with normal concentrations of Gln or without Gln. The findings demonstrated that CD8+ T cells in the co-culture system without Gln expressed lower PD-1 (Figure 9A) and higher PRF1 (Figure 9B) and GZMB (Figure 9C) levels compared with the co-culture alone group; additionally, JC-1 staining was decreased (Figure 9D), and there were increased levels of ROS (Figure 9E) and apoptosis (Figure 9F). Next, CD8+ T cells were cultured alone in RPMI 1640 with the normal Gln concentration or without Gln to further validate the effect of Gln on CD8+ T cells. The results showed that CD8+ T cells in the group lacking Gln had increased PD-1 expression (Figure 10A) and decreased secretion of PRF1 (Figure 10B) and GZMB (Figure 10C) compared with those in the control group. Similarly, JC-1 staining was decreased (Figure 10D), and the levels of ROS (Figure 10E) and apoptosis (Figure 10F) were increased. Together, these data showed that hepatoma cells competed with CD8+ T cells for Gln. Gln deficiency inhibited the function of CD8+ T cells and induced mitochondrial damage and apoptosis.
In the tumor immune microenvironment, CD8+ T cells are the main immune effector cells and play a crucial role in the host immune environment. A large number of CD8+ T cells infiltrate tumor tissues in patients. However, due to chronic stimulation by tumor antigens, most of the T cells are functionally impaired and have differentiated into CD8+ T ex cells, which mediate tumor immune escape[18-20]. Therefore, understanding the mechanism of decreased CD8+ T cell function is essential for tumor immunity. Tex cells are characterized by the loss of effector functions and elevated and sustained expression of IRs[6,21,22]. In this study, the expression of PD-1 was increased and the secretion of cellular effector molecules such as GZMB and PRF1 was decreased in CD8+ T cells from the co-culture group. Our observations illustrated that the function of infiltrating CD8+ T cells was suppressed by HCC cells. Therefore, we next explored the specific mechanisms via which CD8+ T cell function was inhibited.
Mitochondria are central to cellular metabolism and play key roles in the functional regulation of immune cells such as CD8+ T cells[23]. When mitochondria are slightly impaired, the damage is neutralized by fusion with healthy mitochondria. However, when mitochondrial damage exceeds the range buffered by fusion, the cell promotes mitochondrial division and damage[24]. Severely injured mitochondria usually show increased ROS production and decreased membrane potential[25], which decreases cellular function. As shown by our data, the mitochondria of CD8+ T cells co-cultured with HCC cells exhibited swelling, increased ROS production, and decreased membrane potential, and the cells underwent apoptosis, implying that HCC cells induce mitochondrial damage and apoptosis in CD8+ T cells. Next, we examined the relationship between mitochondrial damage and CD8+ T cell function by using Mdivi-1 and CCCP to regulate mitochondrial status. Mdivi-1 is a quinazolinone derivative that penetrates cell membrane and attenuates mitochondrial damage by inhibiting mitochondrial division[26]. CCCP can interrupt oxidative phosphorylation, which impairs mito
Studies have shown that tumor cells inhibit anti-tumor immunity by competing for essential nutrients and reducing the metabolic adaptability of tumor-infiltrating immune cells, which in turn decreases the function of immune cells[28]. The nutrients required for cellular metabolism include glucose, amino acids, and fatty acids. Both tumor cells and activated T cells show a significant Gln requirement[29]. CD4+ T cells lacking Gln have diminished proliferative capacity and decreased cytokine secretion. We found that CD8+ T cells lacking Gln have a reduced ability to secrete effector molecules and increased expression of inhibitory receptors such as PD-1, suggesting that Gln deprivation inhibits the function of CD8+ T cells. In states of energy deficiency, mitochondrial function is abnormal, which further activates pro-apoptotic downstream regulators that induce apoptosis[30]. A previous study suggested that upon glucose deprivation, cells largely mobilize oxidative phosphorylation to maintain energy homeostasis, causing mitochondria to produce high levels of ATP and ROS[31]. Our data showed that in the absence of Gln, the mitochondria of CD8+ T cells underwent morphological changes with reduced mitochondrial membrane potential, generated high levels of ROS, and induced apoptosis. However, the above results were obtained only from in vitro experiments, and more details need to be further studied.
We found that Gln deprivation impairs the function of CD8+ T cells through the mitochondrial damage and apoptotic pathways.
The functions of infiltrating CD8+ T cells are often impaired due to tumor cells causing nutrient deprivation in the tumor microenvironment. Thus, the mechanisms of CD8+ T cell dysfunction have become a hot research topic, and there is increased interest on how changes in metabolomics correlate with CD8+ T cell dysfunction.
To explore the effect of glutamine metabolism on the function of tissue-infiltrating CD8+ T cells, so as to provide a new strategy for reversing the exhausted CD8+ T cells in hepatocellular carcinoma.
This study aimed to investigate whether and how glutamine metabolism affects the function of infiltrating CD8+ T cells in hepatocellular carcinoma.
Immunohistochemical staining and immunofluorescence were performed on surgically resected liver tissues from patients. Differentially expressed genes in infiltrating CD8+ T cells in hepatocellular carcinoma were detected using RNA sequencing. Activated CD8+ T cells were co-cultured with Huh-7 cells for 3 d. The function and mitochondrial status of CD8+ T cells were analyzed by flow cytometry, quantitative polymerase chain reaction, and transmission electron microscopy. Next, CD8+ T cells were treated with the mitochondrial protective and damaging agents. Functional alterations in CD8+ T cells were detected by flow cytometry. Then, complete medium without glutamine was used to culture cells, and their functional changes and mitochondrial status were detected.
There were a large number of infiltrating PD-1+CD8+ T cells in liver cancer tissues. Next, we co-cultured CD8+ T cells and Huh-7 cells to explore the regulatory effect of hepatoma cells on CD8+ T cells. Flow cytometry results revealed increased PD-1 expression and decreased secretion of perforin (PRF1) and granzyme B (GZMB) by CD8+ T cells in the co-culture group. Meanwhile, JC-1 staining was decreased and the levels of reactive oxygen species and apoptosis were increased in CD8+ T cells of the co-culture group; additionally, the mitochondria of these cells were swollen. When CD8+ T cells were treated with the mitochondrial protective and damaging agents, their function was restored and inhibited, respectively, through the mitochondrial damage and apoptotic pathways. Subsequently, complete medium without glutamine was used to culture cells. As expected, CD8+ T cells showed functional downregulation, mitochondrial damage, and apoptosis.
Glutamine deprivation impairs the function of infiltrating CD8+T cells in hepatocellular carcinoma through the mitochondrial damage and apoptotic pathways.
From this study, we confirmed the potential mechanisms of CD8+ T cell dysfunction induced by glutamine deprivation, which would provide a novel strategy for reversing the exhaustion of CD8+ T cells in hepatocellular carcinoma.
Provenance and peer review: Unsolicited article; Externally peer reviewed.
Peer-review model: Single blind
Specialty type: Oncology
Country/Territory of origin: China
Peer-review report’s scientific quality classification
Grade A (Excellent): A
Grade B (Very good): B, B
Grade C (Good): 0
Grade D (Fair): 0
Grade E (Poor): 0
P-Reviewer: Freude KK, Denmark; Saadi MI, Iran; Tolosa de Talamoni NG, Argentina A-Editor: Zhu JQ, China S-Editor: Gao CC L-Editor: Wang TQ P-Editor: Yuan YY
| 1. | Xie Y, Xie F, Zhang L, Zhou X, Huang J, Wang F, Jin J, Zeng L, Zhou F. Targeted Anti-Tumor Immunotherapy Using Tumor Infiltrating Cells. Adv Sci (Weinh). 2021;8:e2101672. [RCA] [PubMed] [DOI] [Full Text] [Cited by in Crossref: 38] [Cited by in RCA: 42] [Article Influence: 10.5] [Reference Citation Analysis (0)] |
| 2. | Wei R, Liu S, Zhang S, Min L, Zhu S. Cellular and Extracellular Components in Tumor Microenvironment and Their Application in Early Diagnosis of Cancers. Anal Cell Pathol (Amst). 2020;2020:6283796. [RCA] [PubMed] [DOI] [Full Text] [Full Text (PDF)] [Cited by in Crossref: 114] [Cited by in RCA: 102] [Article Influence: 20.4] [Reference Citation Analysis (0)] |
| 3. | Natua S, Dhamdhere SG, Mutnuru SA, Shukla S. Interplay within tumor microenvironment orchestrates neoplastic RNA metabolism and transcriptome diversity. Wiley Interdiscip Rev RNA. 2022;13:e1676. [RCA] [PubMed] [DOI] [Full Text] [Cited by in Crossref: 5] [Cited by in RCA: 15] [Article Influence: 3.8] [Reference Citation Analysis (0)] |
| 4. | Ma J, Zheng B, Goswami S, Meng L, Zhang D, Cao C, Li T, Zhu F, Ma L, Zhang Z, Zhang S, Duan M, Chen Q, Gao Q, Zhang X. PD1Hi CD8+ T cells correlate with exhausted signature and poor clinical outcome in hepatocellular carcinoma. J Immunother Cancer. 2019;7:331. [RCA] [PubMed] [DOI] [Full Text] [Full Text (PDF)] [Cited by in Crossref: 238] [Cited by in RCA: 230] [Article Influence: 38.3] [Reference Citation Analysis (0)] |
| 5. | Wang X, Lu XJ, Sun B. The pros and cons of dying tumour cells in adaptive immune responses. Nat Rev Immunol. 2017;17:591. [RCA] [PubMed] [DOI] [Full Text] [Cited by in Crossref: 12] [Cited by in RCA: 17] [Article Influence: 2.1] [Reference Citation Analysis (0)] |
| 6. | Doering TA, Crawford A, Angelosanto JM, Paley MA, Ziegler CG, Wherry EJ. Network analysis reveals centrally connected genes and pathways involved in CD8+ T cell exhaustion vs memory. Immunity. 2012;37:1130-1144. [RCA] [PubMed] [DOI] [Full Text] [Cited by in Crossref: 359] [Cited by in RCA: 437] [Article Influence: 33.6] [Reference Citation Analysis (0)] |
| 7. | Schietinger A, Greenberg PD. Tolerance and exhaustion: defining mechanisms of T cell dysfunction. Trends Immunol. 2014;35:51-60. [RCA] [PubMed] [DOI] [Full Text] [Cited by in Crossref: 393] [Cited by in RCA: 525] [Article Influence: 43.8] [Reference Citation Analysis (0)] |
| 8. | Chang CH, Qiu J, O'Sullivan D, Buck MD, Noguchi T, Curtis JD, Chen Q, Gindin M, Gubin MM, van der Windt GJ, Tonc E, Schreiber RD, Pearce EJ, Pearce EL. Metabolic Competition in the Tumor Microenvironment Is a Driver of Cancer Progression. Cell. 2015;162:1229-1241. [RCA] [PubMed] [DOI] [Full Text] [Cited by in Crossref: 1558] [Cited by in RCA: 2268] [Article Influence: 226.8] [Reference Citation Analysis (0)] |
| 9. | Hu M, Chen X, Ma L, Ma Y, Li Y, Song H, Xu J, Zhou L, Li X, Jiang Y, Kong B, Huang P. AMPK Inhibition Suppresses the Malignant Phenotype of Pancreatic Cancer Cells in Part by Attenuating Aerobic Glycolysis. J Cancer. 2019;10:1870-1878. [RCA] [PubMed] [DOI] [Full Text] [Full Text (PDF)] [Cited by in Crossref: 18] [Cited by in RCA: 33] [Article Influence: 5.5] [Reference Citation Analysis (0)] |
| 10. | Altman BJ, Stine ZE, Dang CV. From Krebs to clinic: glutamine metabolism to cancer therapy. Nat Rev Cancer. 2016;16:749. [RCA] [PubMed] [DOI] [Full Text] [Cited by in Crossref: 158] [Cited by in RCA: 232] [Article Influence: 25.8] [Reference Citation Analysis (0)] |
| 11. | Xiang L, Mou J, Shao B, Wei Y, Liang H, Takano N, Semenza GL, Xie G. Glutaminase 1 expression in colorectal cancer cells is induced by hypoxia and required for tumor growth, invasion, and metastatic colonization. Cell Death Dis. 2019;10:40. [RCA] [PubMed] [DOI] [Full Text] [Full Text (PDF)] [Cited by in Crossref: 101] [Cited by in RCA: 155] [Article Influence: 25.8] [Reference Citation Analysis (0)] |
| 12. | Ahn CS, Metallo CM. Mitochondria as biosynthetic factories for cancer proliferation. Cancer Metab. 2015;3:1. [RCA] [PubMed] [DOI] [Full Text] [Full Text (PDF)] [Cited by in Crossref: 223] [Cited by in RCA: 271] [Article Influence: 27.1] [Reference Citation Analysis (0)] |
| 13. | Cruzat V, Macedo Rogero M, Noel Keane K, Curi R, Newsholme P. Glutamine: Metabolism and Immune Function, Supplementation and Clinical Translation. Nutrients. 2018;10. [RCA] [PubMed] [DOI] [Full Text] [Full Text (PDF)] [Cited by in Crossref: 336] [Cited by in RCA: 659] [Article Influence: 94.1] [Reference Citation Analysis (0)] |
| 14. | Gerriets VA, Kishton RJ, Nichols AG, Macintyre AN, Inoue M, Ilkayeva O, Winter PS, Liu X, Priyadharshini B, Slawinska ME, Haeberli L, Huck C, Turka LA, Wood KC, Hale LP, Smith PA, Schneider MA, MacIver NJ, Locasale JW, Newgard CB, Shinohara ML, Rathmell JC. Metabolic programming and PDHK1 control CD4+ T cell subsets and inflammation. J Clin Invest. 2015;125:194-207. [RCA] [PubMed] [DOI] [Full Text] [Cited by in Crossref: 435] [Cited by in RCA: 583] [Article Influence: 53.0] [Reference Citation Analysis (0)] |
| 15. | Klysz D, Tai X, Robert PA, Craveiro M, Cretenet G, Oburoglu L, Mongellaz C, Floess S, Fritz V, Matias MI, Yong C, Surh N, Marie JC, Huehn J, Zimmermann V, Kinet S, Dardalhon V, Taylor N. Glutamine-dependent α-ketoglutarate production regulates the balance between T helper 1 cell and regulatory T cell generation. Sci Signal. 2015;8:ra97. [RCA] [PubMed] [DOI] [Full Text] [Cited by in Crossref: 283] [Cited by in RCA: 389] [Article Influence: 38.9] [Reference Citation Analysis (0)] |
| 16. | Liu Y, Birsoy K. Asparagine, a Key Metabolite in Cellular Response to Mitochondrial Dysfunction. Trends Cancer. 2021;7:479-481. [RCA] [PubMed] [DOI] [Full Text] [Cited by in Crossref: 2] [Cited by in RCA: 5] [Article Influence: 1.3] [Reference Citation Analysis (0)] |
| 17. | Yu YR, Imrichova H, Wang H, Chao T, Xiao Z, Gao M, Rincon-Restrepo M, Franco F, Genolet R, Cheng WC, Jandus C, Coukos G, Jiang YF, Locasale JW, Zippelius A, Liu PS, Tang L, Bock C, Vannini N, Ho PC. Disturbed mitochondrial dynamics in CD8+ TILs reinforce T cell exhaustion. Nat Immunol. 2020;21:1540-1551. [RCA] [PubMed] [DOI] [Full Text] [Cited by in Crossref: 102] [Cited by in RCA: 353] [Article Influence: 70.6] [Reference Citation Analysis (0)] |
| 18. | Chew V, Lai L, Pan L, Lim CJ, Li J, Ong R, Chua C, Leong JY, Lim KH, Toh HC, Lee SY, Chan CY, Goh BKP, Chung A, Chow PKH, Albani S. Delineation of an immunosuppressive gradient in hepatocellular carcinoma using high-dimensional proteomic and transcriptomic analyses. Proc Natl Acad Sci U S A. 2017;114:E5900-E5909. [RCA] [PubMed] [DOI] [Full Text] [Cited by in Crossref: 123] [Cited by in RCA: 185] [Article Influence: 23.1] [Reference Citation Analysis (0)] |
| 19. | Zheng C, Zheng L, Yoo JK, Guo H, Zhang Y, Guo X, Kang B, Hu R, Huang JY, Zhang Q, Liu Z, Dong M, Hu X, Ouyang W, Peng J, Zhang Z. Landscape of Infiltrating T Cells in Liver Cancer Revealed by Single-Cell Sequencing. Cell. 2017;169:1342-1356.e16. [RCA] [PubMed] [DOI] [Full Text] [Cited by in Crossref: 1011] [Cited by in RCA: 1495] [Article Influence: 186.9] [Reference Citation Analysis (0)] |
| 20. | Zhou G, Sprengers D, Boor PPC, Doukas M, Schutz H, Mancham S, Pedroza-Gonzalez A, Polak WG, de Jonge J, Gaspersz M, Dong H, Thielemans K, Pan Q, IJzermans JNM, Bruno MJ, Kwekkeboom J. Antibodies Against Immune Checkpoint Molecules Restore Functions of Tumor-Infiltrating T Cells in Hepatocellular Carcinomas. Gastroenterology. 2017;153:1107-1119.e10. [RCA] [PubMed] [DOI] [Full Text] [Cited by in Crossref: 237] [Cited by in RCA: 318] [Article Influence: 39.8] [Reference Citation Analysis (0)] |
| 21. | Khan O, Giles JR, McDonald S, Manne S, Ngiow SF, Patel KP, Werner MT, Huang AC, Alexander KA, Wu JE, Attanasio J, Yan P, George SM, Bengsch B, Staupe RP, Donahue G, Xu W, Amaravadi RK, Xu X, Karakousis GC, Mitchell TC, Schuchter LM, Kaye J, Berger SL, Wherry EJ. TOX transcriptionally and epigenetically programs CD8+ T cell exhaustion. Nature. 2019;571:211-218. [RCA] [PubMed] [DOI] [Full Text] [Full Text (PDF)] [Cited by in Crossref: 1020] [Cited by in RCA: 1060] [Article Influence: 176.7] [Reference Citation Analysis (0)] |
| 22. | Li W, Cheng H, Li G, Zhang L. Mitochondrial Damage and the Road to Exhaustion. Cell Metab. 2020;32:905-907. [RCA] [PubMed] [DOI] [Full Text] [Cited by in Crossref: 8] [Cited by in RCA: 20] [Article Influence: 4.0] [Reference Citation Analysis (0)] |
| 23. | Deng H, Ma J, Liu Y, He P, Dong W. Combining α-Hederin with cisplatin increases the apoptosis of gastric cancer in vivo and in vitro via mitochondrial related apoptosis pathway. Biomed Pharmacother. 2019;120:109477. [RCA] [PubMed] [DOI] [Full Text] [Cited by in Crossref: 15] [Cited by in RCA: 23] [Article Influence: 3.8] [Reference Citation Analysis (0)] |
| 24. | Padman BS, Nguyen TN, Lazarou M. Autophagosome formation and cargo sequestration in the absence of LC3/GABARAPs. Autophagy. 2017;13:772-774. [RCA] [PubMed] [DOI] [Full Text] [Cited by in Crossref: 21] [Cited by in RCA: 30] [Article Influence: 3.8] [Reference Citation Analysis (0)] |
| 25. | Tusskorn O, Khunluck T, Prawan A, Senggunprai L, Kukongviriyapan V. Mitochondrial division inhibitor-1 potentiates cisplatin-induced apoptosis via the mitochondrial death pathway in cholangiocarcinoma cells. Biomed Pharmacother. 2019;111:109-118. [RCA] [PubMed] [DOI] [Full Text] [Cited by in Crossref: 45] [Cited by in RCA: 45] [Article Influence: 7.5] [Reference Citation Analysis (0)] |
| 26. | Si L, Fu J, Liu W, Hayashi T, Mizuno K, Hattori S, Fujisaki H, Onodera S, Ikejima T. Silibinin-induced mitochondria fission leads to mitophagy, which attenuates silibinin-induced apoptosis in MCF-7 and MDA-MB-231 cells. Arch Biochem Biophys. 2020;685:108284. [RCA] [PubMed] [DOI] [Full Text] [Cited by in Crossref: 10] [Cited by in RCA: 22] [Article Influence: 4.4] [Reference Citation Analysis (0)] |
| 27. | Chen YF, Liu H, Luo XJ, Zhao Z, Zou ZY, Li J, Lin XJ, Liang Y. The roles of reactive oxygen species (ROS) and autophagy in the survival and death of leukemia cells. Crit Rev Oncol Hematol. 2017;112:21-30. [RCA] [PubMed] [DOI] [Full Text] [Cited by in Crossref: 63] [Cited by in RCA: 84] [Article Influence: 10.5] [Reference Citation Analysis (0)] |
| 28. | Li X, Wenes M, Romero P, Huang SC, Fendt SM, Ho PC. Navigating metabolic pathways to enhance antitumour immunity and immunotherapy. Nat Rev Clin Oncol. 2019;16:425-441. [RCA] [PubMed] [DOI] [Full Text] [Cited by in Crossref: 259] [Cited by in RCA: 479] [Article Influence: 79.8] [Reference Citation Analysis (0)] |
| 29. | Issaq SH, Mendoza A, Fox SD, Helman LJ. Glutamine synthetase is necessary for sarcoma adaptation to glutamine deprivation and tumor growth. Oncogenesis. 2019;8:20. [RCA] [PubMed] [DOI] [Full Text] [Full Text (PDF)] [Cited by in Crossref: 27] [Cited by in RCA: 39] [Article Influence: 6.5] [Reference Citation Analysis (0)] |
| 30. | Künzi L, Holt GE. Cigarette smoke activates the parthanatos pathway of cell death in human bronchial epithelial cells. Cell Death Discov. 2019;5:127. [RCA] [PubMed] [DOI] [Full Text] [Full Text (PDF)] [Cited by in Crossref: 22] [Cited by in RCA: 29] [Article Influence: 4.8] [Reference Citation Analysis (0)] |
| 31. | Song SB, Hwang ES. High Levels of ROS Impair Lysosomal Acidity and Autophagy Flux in Glucose-Deprived Fibroblasts by Activating ATM and Erk Pathways. Biomolecules. 2020;10. [RCA] [PubMed] [DOI] [Full Text] [Full Text (PDF)] [Cited by in Crossref: 10] [Cited by in RCA: 29] [Article Influence: 5.8] [Reference Citation Analysis (0)] |


