Chiba T, Murata M, Kawano T, Hashizume M, Akahoshi T. Reflectance spectra analysis for mucous assessment. World J Gastrointest Oncol 2021; 13(8): 822-834 [PMID: 34457188 DOI: 10.4251/wjgo.v13.i8.822]
Corresponding Author of This Article
Toru Chiba, BSc, Associate Specialist, Pentax_LifeCare, HOYA Corporation, Pentax Life Care Division Showanomori Technology Center 1-1-110 Tsutsujigaoka, Akishima-shi 196-0012, Tokyo, Japan. toru.chiba@pentaxmedical.com
Research Domain of This Article
Chemistry, Medicinal
Article-Type of This Article
Minireviews
Open-Access Policy of This Article
This article is an open-access article which was selected by an in-house editor and fully peer-reviewed by external reviewers. It is distributed in accordance with the Creative Commons Attribution Non Commercial (CC BY-NC 4.0) license, which permits others to distribute, remix, adapt, build upon this work non-commercially, and license their derivative works on different terms, provided the original work is properly cited and the use is non-commercial. See: http://creativecommons.org/licenses/by-nc/4.0/
Toru Chiba, Pentax_LifeCare, HOYA Corporation, Akishima-shi 196-0012, Tokyo, Japan
Masaharu Murata, Takahito Kawano, Makoto Hashizume, Center for Advanced Medical Innovation, Kyushu University, Fukuoka-shi 812-8582, Fukuoka, Japan
Tomohiko Akahoshi, Department of Disaster and Emergency Medicine, Graduate School of Medical Sciences, Kyushu University, Fukuoka_shi 812-8582, Fukuoka, Japan
Author contributions: Chiba T, Murata M, Akahoshi T, and Hashizume M conceived the paper; Murata M and Chiba T designed and co-ordinated the writing; Chiba T performed statistical analysis.
Conflict-of-interest statement: Authors declare no conflict of interests for this article.
Open-Access: This article is an open-access article that was selected by an in-house editor and fully peer-reviewed by external reviewers. It is distributed in accordance with the Creative Commons Attribution NonCommercial (CC BY-NC 4.0) license, which permits others to distribute, remix, adapt, build upon this work non-commercially, and license their derivative works on different terms, provided the original work is properly cited and the use is non-commercial. See: http://creativecommons.org/Licenses/by-nc/4.0/
Corresponding author: Toru Chiba, BSc, Associate Specialist, Pentax_LifeCare, HOYA Corporation, Pentax Life Care Division Showanomori Technology Center 1-1-110 Tsutsujigaoka, Akishima-shi 196-0012, Tokyo, Japan. toru.chiba@pentaxmedical.com
Received: March 1, 2021 Peer-review started: March 1, 2021 First decision: April 19, 2021 Revised: April 26, 2021 Accepted: July 9, 2021 Article in press: July 9, 2021 Published online: August 15, 2021 Processing time: 166 Days and 7.4 Hours
Abstract
This review report represents an overview of research and development on medical hyperspectral imaging technology and its applications. Spectral imaging technology is attracting attention as a new imaging modality for medical applications, especially in disease diagnosis and image-guided surgery. Considering the recent advances in imaging, this technology provides an opportunity for two-dimensional mapping of oxygen saturation (SatO2) of blood with high accuracy, spatial spectral imaging, and its analysis and provides detection and diagnostic information about the tissue physiology and morphology. Multispectral imaging also provides information about tissue oxygenation, perfusion, and potential function during surgery. Analytical algorithm has been examined, and indication of accurate map of relative hemoglobin concentration and SatO2 can be indicated with preferable resolution and frame rate. This technology is expected to provide promising biomedical information in practical use. Several studies suggested that blood flow and SatO2 are associated with gastrointestinal disorders, particularly malignant tumor conditions. The use and analysis of spectroscopic images are expected to potentially play a role in the detection and diagnosis of these diseases.
Core Tip: Hemoglobin saturation relative hemoglobin concentration diffuse reflectance spectroscopic. The use of spectroscopic information for pathological diagnosis and detection has been studied. Detailed analysis of this information will contribute to the development of novel objective diagnostic techniques for diseases. In the latest research, it has become possible to visualize pathological conditions by indicating the two-dimensional distribution of blood concentration and oxygen saturation in real time, which can be realized without dosage. In the near future, derived research field that can be greatly expected to develop into future prediction of pathological conditions when performed in combination with statistical methods.
Citation: Chiba T, Murata M, Kawano T, Hashizume M, Akahoshi T. Reflectance spectra analysis for mucous assessment. World J Gastrointest Oncol 2021; 13(8): 822-834
Studies on spectral characterization for visible using the diffuse reflectance method have been reported for various diseases. In recent years, the diffuse reflectance method has been applied to measure changes in perfusion in response to operations, such as infusion of vasoactive agents and cardiopulmonary bypass, and is expected to be applied to various fields, such as emergency medical monitoring of condition of blood flow and activity of the tissue[1,2]. Spectral characterization of tissue in the intestinal tract by combining the diffuse reflection method and the endoscope was reported[3].
For the past 20 years, spectral data capture technology using the diffuse reflectance method has been used in actual clinical trials, and its technique has expanded from spectral measurement using single or several fibers to multispectral imaging method, which focuses on the characteristic changes of the target.
In this report, measuring methods and analyses to date based on visible light spectra and its developments of several devices from the early stage to the present day are focused. There are two main types of spectral information: Hyperspectral data and multispectral data. In general, a series of information collected at a consecutive wavelength with 1-5 nm interval in defined wavelength area is treated as hyperspectral data, and information collected at some specific and discrete wavelength area is treated as multispectral data, which focuses on characteristic spectral information. Both appear to be positioned as part of diffuse reflectance spectroscopy, but there are major differences in the functions required of the equipment depending on the purpose. All information in the target wavelength region is required to elucidate the information of unknown substances. Collecting hyperspectral information always requires complicated equipment as well as a long capturing and analysis time, which prevents its practical use.
By contrast, in the case of tracking change for committed spectral information, it may be possible to collect information in a limited wavelength range with a higher data rate. For the development of practical equipment, which is using multispectral information, the aggregation of hyperspectral information is necessary.
The development of devices for the actual clinical field is actively promoted[4]. Results of the current applied research indicated the possibility that diffuse reflectance and multispectral technological methods will evolve into devices that may be useful in actual clinical practice in the near future[5-7]. Several studies reported on the use of spectroscopic information for gastrointestinal disorders. Some studies have used spectroscopic information peculiar to diseases and reports based on hemodynamics; however, the latter is a report focusing on high blood flow and hypoxia in malignant tumors. Supporting information for disease detection and diagnosis based on this information will make a great contribution to the field of diagnostic imaging.
With the advancement of equipment development, results obtained in this study are expected to be applied for practical use.
Based on the history of research and development of research and equipment, the report will cover the following contents: (1) Diffuse reflectance spectroscopy (DRS) and endoscope: Spectral information in the biomedical field; (2) Analysis of scattering information; (3) DRS data analysis; (4) Method of spectral image capturing: Hyperspectral image capturing and equipment; (5) Practical use of multispectral analysis; and (6) Discussion: Application of reflectance spectroscopy, reflectance spectroscopy as a future technology.
DRS AND ENDOSCOPE
In recent years, spectral observations through a fiber that has passed through a video endoscope and its accessory channel have been reported in a case, in which a spectral image of the large intestinal mucosa was captured using the combination of endoscope and spectral imaging device[8-18]. It has become possible to use objective information, including spectrochemical information, as well as the doctor's subjective diagnosis based on single image information. Other studies have reported that relative diffuse spectral information on the inner surface of the colon was dominated by relative hemoglobin concentration (r-Hconc), oxygen saturation (SatO2), and scattering information[19-21].
Most of the hemoglobin in blood is in red blood cells in vessels, and the measured mucosal SatO2 indicates tissue capillary oxygenation in both hypoxic and ischemic tissue. The SatO2 of the mucosa is known to differ from the arterial SatO2[22-24]. In addition, the relationship among blood flow, hypoxia, and malignant tumor have been previously studied by many and is expected to be effective in giving practical diagnostic support information. The information obtained by analyzing this spectral image has the advantage of visualizing and tracking the changes related with local events, in comparison with the surrounding conditions. Decades of multigroup studies have established the utility of spectral information as a research tool for obtaining information on gastrointestinal disease[24-26].
In addition to the method of measuring absorbance with a narrow-band wavelength filter, the method of evaluating the absorption spectrum in a wide wavelength range and the multivariate simultaneous analysis method were adopted to improve the accuracy of spectral analysis. These have been largely brought about by the contribution of not only endoscopic devices and spectroscopic devices but also the improvements in digitalization, transfer of data, and computer software that facilitate multivariate optimization calculation methods[27,28].
Spectral information in the biomedical field
Because the spectral information of the target substance is linked to the chemical information and its changes, it is possible to analyze the acquired spectral information and obtain the chemical information.
By applying a conventional spectral analysis method, spectral information on the chemical and histologic characteristics of the substances can be obtained[29-31]. Based on these analysis results, in the biomedical field, chemical and biological characterizations that are unique to the disease are expected to be recognized as new diagnostic support information. Specifically, capturing the effect of differences in the chemical structure between normal and diseased parts on the spectra may enable the utilization of a vast amount of information between the chemical structure and the spectra. In this respect, the chemical information and the medical diagnosis support information can be expected to be integrated and utilized[32-34].
As an example of capturing chemical structural changes as spectral information, Figure 1 shows the changes in the spectral characteristics of oxyhemoglobin and deoxyhemoglobin secondary to the changes in the absorption of spectra, based on the difference in absorption spectrum between oxyhemoglobin and deoxyhemoglobin, according to oxygen binding.
Figure 1
Spectra components oxyHb and deoxyHb and scatter.
The ratio of two substances calculated by quantitative spectral analysis is the SatO2 information itself. This information is based on strong changes in hemoglobin in the wavelength range of 500-600 nm and the presence of detectable spectral absorption. The diffuse reflectance data of the colonic mucosa is also shown in Figure 1.
On the other hand, the physical structural changes can be detected by utilizing the fact that the nucleus is filled with a substance that has a higher refractive index, compared with that of the surrounding cytoplasm. By measuring the unique scattering pattern, the nuclear deformation of the cell can be estimated. Calculating the exact scattering behavior of a simple model system, such as a collection of spheres with specific size, density, and refractive index, and applying statistical processing may enable the diagnosis of the relationship between tissue changes secondary to nuclear variants and diseases. This information was reported to be used as support for the diagnosis of cancer[35-37]. In this study, the distribution of the size of the nucleus was estimated using the known properties of cell structure, such as the refractive index of the nucleus, and the measurements of periodic characterizations of the backscatter in the visible wavelength region. Analysis of nuclides has shown their effectiveness as a method for dysplasia assessment[38-40]. There have been many efforts to use DRS for disease detection and diagnosis. However, because of difficulties in data acquisition of back scatter (complicated optical system and higher light intensity is necessary) and the complex analysis in estimating nuclear size distribution, there have been few developments of practical commercial systems.
ANALYSIS OF SCATTERING INFORMATION
In the spectra information of human mucosa, scattering information dominates a large part of the information. Because of this reason, the explanation of spectral absorption and scattering is important for predicting the mucosa spectral information. Absorption and scattering comprise some of the optical processes that form the basis of the information obtained by DRS. Considering the effects of scattering on normal mucosa is basically an important issue. To estimate the concentration spectrochemically, the mathematical optimization described above is performed. The spectrum information of each component contained in this observed spectrum must be accurate. Several studies have focused on predicting light scattering spectra in the body to explain spectral information in the body.
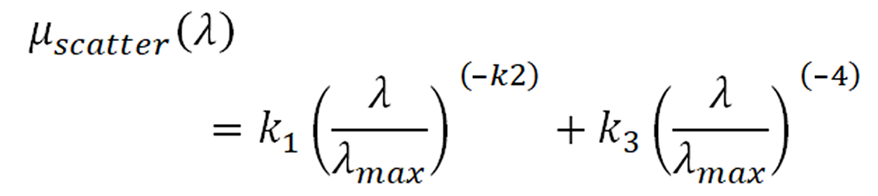
The physical phenomenon is represented by the following equation, from which the relationship between scattering and transmittance can be derived (Formula 1)[5,41,42].
In this absorption model for the mucosal surface, scatter is defined as the cumulative count of the components of the two types of scatter. The first and second terms on the right side of this expression are related to the Mie scatter and Rayleigh scatter, respectively. The parameters k1, k2, and k3 in this equation are calculated for the spectral simulation of scatter. λmax of 700 nm is employed as the wavelength area in our study.
Total scattering is divided into Rayleigh scattering and Mie scattering, and the influence of scattering on the diffuse reflectance measurement of the mucosa can be estimated by setting the parameters[43,44]. In our measurement experiment and in previous reports, the effectiveness of fitting using the abovementioned formula and measurement of the colonic mucosa and brain surface was confirmed to be greater with Mei scattering than with Rayleigh scattering[45].
The features of a disease in endoscopic imaging and spectral image analysis of the colon was examined and reported. Furthermore, a method of using spectral image information to monitor blood flow and SatO2 during neurosurgery was proposed[46]. In the case of intestinal diseases, detection of various changes in the mucosal status on the tissue surface can also be considered as changes in the spectrum secondary to diseases, such as ulcers, polyps, and inflammation[47]. For cases in which there can be changes in the optical path length or hemoglobin concentration secondary to ischemia, spectral information that considers these expected changes and the corresponding optical interpretation is required. Although many kinds of mucosa modeling were reported, there are few studies of modeling of the spectral information of unique disease, and detailed research results must be conducted for practical application[48-50].
DRS DATA ANALYSIS
In this report, a diffuse reflectance image of visible light was captured by illuminating the tissue of interest with a reference light and by quantitative analyses of spectral information of the reflected light from the tissue back to the detector. The reference light was a xenon light source with a wavelength of approximately 400-650 nm, which was the near-infrared range of ≥ 650 nm in endoscopy cases. Each 5 nm video graphics array (VGA) (640 × 480 pixels) took approximately 10 s to capture. Using a glass fiber-based fiberscope, the transmitted visible light image was captured with a spectral camera that was mentioned in the previous section[51]. The spectral information of stored data was quantitatively analyzed. An example of blood spectrum measurement is shown in Figure 1. In a typical colonic mucosa, the average hemoglobin SatO2 was approximately 65%–80%.
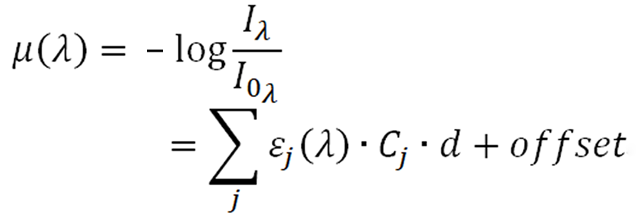
This overlap can be exemplified by the measurement spectra of oxyhemoglobin (74%) and deoxyhemoglobin (26%) and scatter. The mathematical fitting to find this ratio was performed on all pixels to render a 2D SatO2 display[52,53]. In the spectra analyses that used a large amount of spectral information for each 5-nm image, information other than the explanatory variables in the analysis was specified as an error; therefore, analysis of the spectral information of several pixels while maintaining the determined accuracy was possible. Additional factors, such as wavelength dependence of scattering, were minimized by a computerized process of providing a linear or polynomial correction term when fitting the spectrum (Formula 2)[54].
Where (/L) is the absorbance of wavelength λ, I0 is reference intensity, I is observed intensity, j corresponds to the number of component, ε is the molar attenuation coefficient of the attenuating species at each wavelength (mol/L), C is the concentration of the attenuating species (mol/L), and d is the optical path of the component (L). In addition, the baseline offset was considered. The modified Beer–Lambert law was completed for each wavelength and each component.
This method of analysis was based on the Beer–Lambert law and was affected by the optical path length and the number of hemoglobin molecules[55]. In addition, it was necessary to compensate for the angle between the mucosal imaging area and the fiber incident surface angle. In this study, the information obtained by diffuse reflection was practically limited to the information near the surface layer of the mucosa. For example, using visible light, the standard signal was reported to be mainly secondary to hemoglobin absorption at a 0.25-mm surface tissue[56] and provided a good indicator of mucosa relative to the hemoglobin concentration and oxygenation[57].
This way, the average hemoglobin SatO2 on the surface of the mucosa was accurately estimated by the DRS method. Because most blood in the measurement area was inside the mucosal capillaries, the tissue hemoglobin SatO2 measured by DRS was estimated as the SatO2 of hemoglobin in the mucosal capillaries. This made it possible to detect conditions of hypoxia caused by insufficient oxygen supply or excessive oxygen consumption of the mucosa.
In the actual measurement in the diseased part, blood concentration may have changed significantly because of bleeding. A high concentration of blood may be measured, especially in bleeding points. In this case, the spectra absorption was saturated, and the calculation of hemoglobin concentration and oxygenation became more difficult. In addition, despite attempts to create individual optical models, accurate diagnosis may not have been possible in special cases, such as in the presence of unexpected compounds; this limitation of this method must be recognized.
In other cases, such as the liver, which contains significant concentrations of cytochromes with a strong absorption spectrum in this range, measurement of hemoglobin oxygenation was not possible because of competing signals from other molecules. Regarding the irradiation of the reference light, generation of additional optical processes, such as fluorescence and Raman scattering, was considered. However, these kinds of light are usually weak and do not substantially affect the measurement.
METHOD OF SPECTRAL IMAGE CAPTURING
Hyperspectral image capturing and equipment
Basically, when detecting spectral information in a living body, comparison of the normal and diseased portions is necessary because of the limitations in reliability of the measurement results for each point, owing to biological individual difference. Using the capture technology of the 2D spectral information, the normal and diseased parts were effectively compared on the same screen. Moreover, sharing information with the output of the other imaging diagnostic equipment was possible. In this respect, 2D indication has been indispensable and extremely innovative in the field of diagnostic imaging support[58].
Because of limitations in the sensitivity region of the image sensor that is used for the detector, the spectroscopic device has been used in practice mainly with equipment that has a visible range of about 400-800 nm. Many studies have been conducted based on the observation that the spectral feature quantity changed in this wavelength region[59]. Spectral images have been recorded based on the functions of wavelength resolution with diffraction grating and light intensity measurement, using a photoelectric conversion element, i.e., charge coupled device and complementary metal oxide semiconductor (WAT-902H2 camera, Watec). This way, spectral image capturing using two typical capturing methods has been put to practical use.
The first method entailed optical image decomposition using a slit; the spectral information of one line of the slit was recorded in a 2D element. After recording the spectral information of each line, the recorded data were reconstructed as an image for each wavelength. This operation was repeated while moving the slits for vertical pixels to obtain 2D spectral information (Figure 2)[51,60].
For the second method, a switchable wavelength selection element was placed in front of a photoelectric conversion element. A typical case involved replacement of the conventional band-pass filter in front of the monochrome camera with a liquid crystal tunable filter (LCTF), repetition of high-speed switching of the transmission band, and image capturing in the wavelength range. Multiple filters limited the transmitted by combining the etalon plates. Furthermore, a liquid crystal material layer that had an anisotropic material of refractive index was placed in between the substrates of the etalon plates, and the optical path length of extraordinary light was controlled by applying a voltage. As a result, the transmission wavelength region was controlled[54,61].
For example, when capturing a VGA 640 × 480-pixel spectral image, the spectral camera (Figure 2) captures one line in one image frame. Therefore, basically, the requirements were capturing an image in steps (usually pixels) toward the scan direction was necessary; 10 s, including 30 frames/s; and data transfer. Under this condition, the captured image will be distorted according to the movement of the object. However, because each line captured the entire wavelength range with a capture time of 1/30 sec, maintenance of the spectral information of pixels, which is the major feature of this method, was possible[51,60].
The second LCTF method was a method of arranging a LCTF in front of the image sensor, specifically a monochrome camera, and controlling the wavelength range incident on an image sensor (Figure 3). The time required for modulation was 50-80 ms for each image capture; this way, capturing a series of 400-800 nm for each of the 81 each 5-nm images, excluding data transfer, took around 5 s[54,61]. With this method, the screen capture for each transmission wavelength was realized; therefore, the motion on the image of the object being captured was recorded as a position change of the image in each wavelength, and this led to a calculation defect. As a solution to this problem, software for position compensation was used.
Figure 3
Scheme of liquid crystal tunable filter and digital camera combination.
In both methods, the capture time depended on the operation speed of the light conversion element, the transfer speed of the captured data, and the processing speed of the time series information calculation. Therefore, equipment of higher performance, compared with that of commercially available equipment, was required for this information capture and processing.
PRACTICAL USE OF SPECTRAL ANALYSIS
As described above, spectral analysis acquires images by sampling wavelengths at equal intervals, and the movement of the apparatus itself or the movement or deformation of the object during capturing occurs; these make accurate spectral analysis extremely difficult. Although capturing many images is an unavoidable disadvantage, it may be solved by limiting the target spectral feature. And by short time capturing through reduction of the number of bands is to realized[5,48]. Multispectral method is unsuitable for tracking unknown chemicals and for characterizing chemical structure but is extremely effective for quantitative tracking of featured spectra changes.
By contrast, the spectral analysis is expected for the accurate detection and objective diagnosis of diseases. The effectiveness of spectral data in the medical field has been addressed in previous reports[46,49,50]. In addition, the application of blood flow and hemoglobin mapping for implantation surgery using a small animal model was proposed[62,63].
Multispectral endoscope system is used to indicate r-Hconc and saturation generated with 2D display, which is analyzed using the spectral feature of the three multispectral images. This method achieved an image output of 7.5 frames/s was reported. The system enables to indicate hemoglobin saturation (SatO2) of the mucosa with a practical frame rate for normal examination (Figure 4).
Figure 4 The system enables to indicate hemoglobin saturation of the mucosa with a practical frame rate for normal examination.
An area with relatively high Hb concentration area is enhanced by an Hb concentration mask. The higher Hb concentration and lower Hb saturation areas that are influenced by the tumor are observed as a blue area. A: Experimental cancer model. Red–green–blue video endoscope image of the mouse viscera. The tumor area is outlined by a white line; B: Hb saturation map of the tumor generated by the endoscope system; C: Hb concentration map of the tumor generated by the endoscope system; D: Hb concentration-masked Hb saturation map.
Diffuse reflection spectroscopy for gastrointestinal examination is expectedly applied in various ways for the noninvasive diagnosis of diseases[64,65].
The proposed technique for the detection of hypoxic areas is based on Hb–oxygen dynamics, and detailed observation of the gastrointestinal mucosa is important for endoscopic detection and diagnosis. Previous studies reported a successful spectroscopic analysis of the gastrointestinal mucosa, with some characterizing both normal and abnormal tissues[66,67].
With regard to the spectral data of the colonic mucosa, marked characteristics in relative Hb concentration and blood oxygenation have been reported to be also detected for the tumor. Differences in the relative Hb concentration and saturation between malignant tumors and non-malignant mucosa have been previously investigated and reported as a “high Hb concentration level and lower Hb saturation for malignant tumors.” To compare actual individual differences between Hb concentration and normal tissue saturation, superiority of the “spatial indication,” including diseased and normal tissue, has been confirmed[7,68-70].
The logical combination of the relative Hb concentration and saturation will also be useful to detect notable regions.
DISCUSSION
Several studies have reported the effect of scattered spectral data on human mucosa[6,19]. In this study and previous studies, the components of diffuse reflectance data of normal intestinal mucosa were explained mainly by oxyhemoglobin, deoxyhemoglobin, and scattering; detection of differences between normal and diseased parts as an abnormal ratio of these three components is expected. As shown above, the use of multispectral analysis reduced the device load of wavelength shift capturing and transfer and allowed near real-time monitoring of r-Hconc and saturation. In this study, the fusion of information on r-Hconc and SatO2 enabled the extraction of partial data on high blood flow with high SatO2 and high blood flow with low oxygen. This fusion information is expected to support the diagnosis and identification of inflammation and malignant tumors.
Endoscope system, which enables the indication of 2D SatO2 and r-Hconc mapping, was developed. Display and recording of blood concentration and mucosal SatO2 changes over time were possible with the video rate. The system paved the way to SatO2 evaluation for general endoscopic examination. Moreover, an animal study has shown that reduced SatO2 in tissues following vascular occlusion in a controlled setting, including arterial and venous occlusion models, is reproducible. These results were consistent with decreased SatO2 in the mucosa when blood flow is blocked after arterial occlusion and with increased SatO2 during blood flow restoration. Moreover, these results led to the evaluation of biological activities.
Application of reflectance spectroscopy
DRS endoscopy is expected to be used as a tool to investigate the roles of mucosal perfusion and hemoglobin oxygenation in the pathophysiology of various diseases, such as peptic ulcer disease, inflammatory bowel disease, and portal hypertensive gastritis. Other studies have investigated the effects of various vasoactive agents on mucosal perfusion and physiologic interventions, such as brain tumor[2,71,72]. Moreover, research on the application of reflectance spectrophotometry on ulcer disease has been reported[73]. In animal models, studies reported decreased hemoglobin concentration and SatO2 after ligation of arterioles that fed the mucosa. Another research noted that unlike pulse oximetry, the diffuse reflectance method provided reliable measurements in areas other than the aorta. This recent study convincingly demonstrated the application of the diffuse reflectance technique to continuous monitoring of mucosal perfusion and oxygenation in the emergency setting[73].
Reflectance spectroscopy as a future technology
A decade ago, spectral analysis started with an old spectroscopic system. Nowadays, real-time display of diagnostic assistance information is possible by acquisition and analysis of data, based on 2D spectral information. Spectral imaging, which has been researched in recent years, has opened the way to the acquisition and analysis of 2D spectral information, as well as fusion with new diagnostic support information based on chemical and biological knowledge. However, improvement of device performance as a practical equipment is essential.
Although a multispectral image provides limited information, it provides a device that can display data with realistic accuracy and speed within the scope of currently available technology based on rapid measurement and analysis. The technology introduced in this report included an example of controlling the light source of an endoscopic system, but the development of a multispectral camera was already considered. The system, which is equipped with the function of capturing multispectral information and displaying diagnostic support information, will be able to expand its field of application. For example, the system is expected to provide important monitoring information for evaluating oxygen delivery to selected tissues, such as the esophagus, stomach, and rectal mucosa. Moreover, the actively available areas of this technique for local hemoglobin concentration and oxygenation have also been applied in the field of surgical and radiologic vascular assessment. The table below shows the expected fields that would use blood concentration and SatO2 display in the surgical field. Multiple trials are currently seeking practical applications (Table 1).
Table 1 Application of indicating relative hemoglobin concentration and saturation function to surgical operation.
Department
Target disease
Expected results
Neurosurgery
(1) Brain tumor; and (2) Cerebral infarction: Detection of diseased area
(1) Improvement of postoperative outcome in terms of oncologic and functional preservation; and (2) Diagnostic improvement
Urology
Partial nephrectomy of renal tumor: Detection of area of ischemia secondary to occlusion of a dominant artery
Improvement of postoperative outcome in terms of oncologic and functional preservation
Gynecology
Trachelectomy for cervical cancer: Assessment of relativity between blood flow and fertility after anastomosis
Decision on the optimal reconstruction method
Gastroenterology surgery
Organ resection for gastrointestinal cancer: Assessment of the organ after resection and reconstruction. Strangulation ileus and hernia: Conformation of organ and tissue viability-related blood flow and oxygen saturation
Reduction of postoperative complications by assessment of real-time organ viability
Plastic surgery
Skin transplantation, including breast reconstruction: Confirmation of transplanted organ and tissue viability-related blood flow and oxygen saturation. Keloid scar: Relative assessment of keloid scar formation-related blood flow and oxygen saturation
(1) Improvement of reconstructive surgery; and (2) Establishment of knowledge on the oxygen saturation of wound tissue for prevention of keloid formation
Ocular
Diabetic retinopathy: Evaluation of the oxygen saturation of fundus blood vessels
Establishment of evaluation and treatment for diabetic retinopathy
CONCLUSION
Research on the analysis of spectral information of the human gastrointestinal mucosa was advanced, and hemoglobin concentration and SatO2 changes were detected in blood, the main spectral component in the visible region. A practical endoscopic system was reported to allow real-time quantitative 2D display of hemoglobin concentration and SatO2 of human gastrointestinal mucosa, indicating information for the detection and diagnosis of diseased areas.
ACKNOWLEDGEMENTS
The author expresses his gratitude in pre-agreement with all the colleagues above. The comments provided by corresponding author and reviewers have greatly improved the clarity of the manuscript.
Kumashiro R, Konishi K, Chiba T, Akahoshi T, Nakamura S, Murata M, Tomikawa M, Matsumoto T, Maehara Y, Hashizume M. Integrated Endoscopic System Based on Optical Imaging and Hyperspectral Data Analysis for Colorectal Cancer Detection.Anticancer Res. 2016;36:3925-3932.
[PubMed] [DOI]
Wirkert SJ, Clancy NT, Stoyanov D, Arya S, Hanna GB, Schlemmer HP, Sauer P, Elson DS, Maier-Hein L.
Endoscopic Sheffield index for unsupervised in vivo spectral band selection. In: International Workshop on Computer-Assisted and Robotic Endoscopy. Springer, Cham, 2014: 110-120.
[PubMed] [DOI]
Chance B. Rapid and sensitive spectrophotometry. I. The accelerated and stopped-flow methods forthe measurement of the reaction kinetics and spectra of unstable compounds in the visible region of the spectrum.Rev Sci Instrum. 1951;22:619-627.
[PubMed] [DOI] [Full Text]
Bigio IJ, Mourant JR, Boyer JD, Johnson TM, Shimada T, Conn RL.
Noninvasive identification of bladder cancer with subsurface backscattered light. In: Advances in Laser and Light Spectroscopy to Diagnose Cancer and Other Diseases; International Society for Optics and Photonics. Proceedings of the SPIE, 1994: 26-35.
[PubMed] [DOI]
Claridge E, Hidović-Rowe D, Taniere P, Ismail T.
Quantifying mucosal blood volume fraction from multispectral images of the colon. In: Medical Imaging 2007: Physiology, Function, and Structure from Medical Images; International Society for Optics and Photonics. Proceedings of the SPIE, 2007: 65110C.
[PubMed] [DOI]
Noda I. Generalized two-dimensional correlation method applicable to infrared, Raman, and other types of spectroscopy.Appl Spectrosc. 1993;47:1329-1336.
[PubMed] [DOI] [Full Text]
Tsumura N, Kawabuchi M, Haneishi H, Miyake Y. Mapping pigmentation in human skin from a multi-channel visible spectrum image by inverse optical scattering technique.J Imag Sci Technol. 2001;45:444-450.
[PubMed] [DOI]
Zijlstra WG, Buursma A, van Assendelft OW.
Visible and near infrared absorption spectra of human and animal haemoglobin: determination and application. CRC Press: Utrecht; Boston VSP, 2000.
[PubMed] [DOI]
Perelman LT, Backman V, Wallace M, Zonios G, Manoharan R, Nusrat A, Shields S, Seiler M, Lima T, Hamano T, Itzkan I, Van Dam J, Crawford JM, Feld MS. Observation of periodic fine structure in reflectance from biological tissue: a new technique for measuring nuclear size distribution.Phys Rev Lett. 1998;80:627.
[PubMed] [DOI] [Full Text]
Satori S, Aoyanagi Y, Hara U, Mitsuhashi R, Takeuchi Y.
Hyperspectral sensor HSC3000 for nano-satellite TAIKI. In: Multispectral, hyperspectral, and ultraspectral remote sensing technology, techniques, and applications II; International Society for Optics and Photonics. Proceedings of the SPIE, 2008: 71490M.
[PubMed] [DOI]
Champagne CM, Staenz K, Bannari A, McNairn H, Deguise JC. Validation of a hyperspectral curve-fitting model for the estimation of plant water content of agricultural canopies.Remote Sens Environ. 2003;87:148-160.
[PubMed] [DOI] [Full Text]
Shimada M, Masuda Y, Yamada Y, Itoh M, Takahashi M, Yatagai T. Explanation of human skin color by multiple linear regression analysis based on the modified Lambert-Beer law.Opt Rev. 2000;7:348-352.
[PubMed] [DOI] [Full Text]
Lee H, Kim MH.
Building a two-way hyperspectral imaging system with liquid crystal tunable filters. In: International Conference on Image and Signal Processing. Springer, Cham, 2014: 26-34.
[PubMed] [DOI]
Hidović-Rowe D, Claridge E, Ismail T, Taniere P, Graham J. Analysis of multispectral images of the colon to reveal histological changes characteristic of cancer.Med Image Underst Anal MIUA. 2006;1:66-70.
[PubMed] [DOI]
Nouri D, Lucas Y, Treuillet S.
Calibration and test of a hyperspectral imaging prototype for intra-operative surgical assistance. In: Medical Imaging 2013: Digital Pathology; International Society for Optics and Photonics. Proceedings of the SPIE, 2013: 86760P.
[PubMed] [DOI]