Copyright
©The Author(s) 2017.
World J Gastrointest Oncol. Aug 15, 2017; 9(8): 333-340
Published online Aug 15, 2017. doi: 10.4251/wjgo.v9.i8.333
Published online Aug 15, 2017. doi: 10.4251/wjgo.v9.i8.333
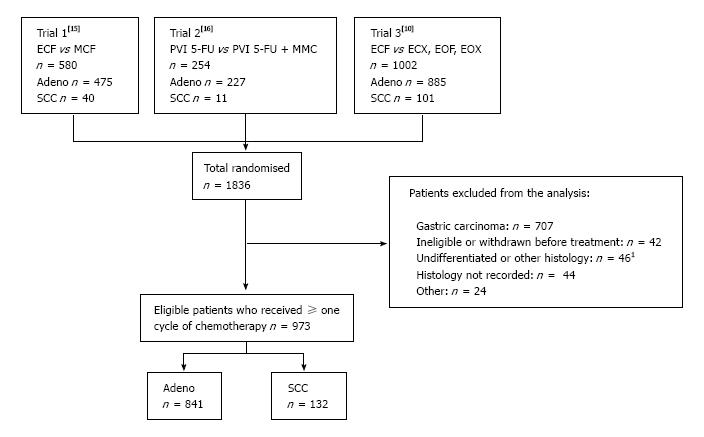
Figure 1 CONSORT diagram indicating the derivation of eligible patients in this analysis.
1Includes carcinoma, undifferentiated carcinoma, adenosquamous carcinoma. SCC: Squamous cell carcinoma; PVI: Protracted venous infusion.
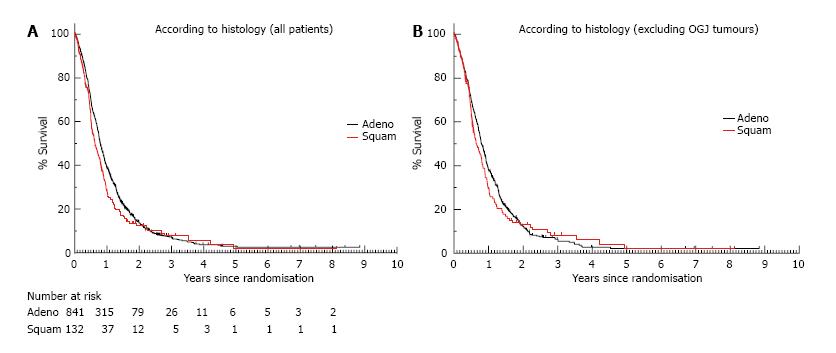
Figure 2 Overall survival.
A: Overall survival according to histology (adenocarcinoma = 841 patients, SCC = 132 patients). The HR for death in the adenocarcinoma group compared to the SCC group was 0.85 (95%CI: 0.70-1.03, P = 0.09); B: Overall survival according to histology excluding OGJ tumours (adenocarcinoma = 438 patients, SCC = 117 patients). The HR for death for the adenocarcinoma group compared to the SCC group was 0.91 (95%CI: 0.73-1.13, P = 0.38). SCC: Squamous cell carcinoma; OGJ: Oesophagogastric junction.
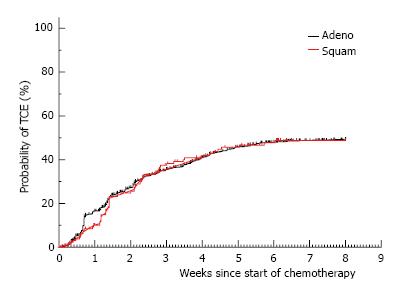
Figure 3 The time to development of the toxicity composite endpoint is shown for patients with adenocarcinoma (n = 841) vs squamous cell carcinoma (n = 132).
TCE: Toxicity composite endpoint.
- Citation: Davidson M, Chau I, Cunningham D, Khabra K, Iveson T, Hickish T, Seymour M, Starling N. Impact of tumour histological subtype on chemotherapy outcome in advanced oesophageal cancer. World J Gastrointest Oncol 2017; 9(8): 333-340
- URL: https://www.wjgnet.com/1948-5204/full/v9/i8/333.htm
- DOI: https://dx.doi.org/10.4251/wjgo.v9.i8.333


