Copyright
©The Author(s) 2017.
World J Gastrointest Oncol. Apr 15, 2017; 9(4): 153-159
Published online Apr 15, 2017. doi: 10.4251/wjgo.v9.i4.153
Published online Apr 15, 2017. doi: 10.4251/wjgo.v9.i4.153
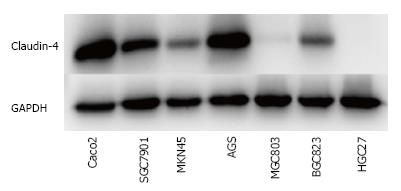
Figure 1 Expression of claudin-4 protein in different gastric cancer cells.
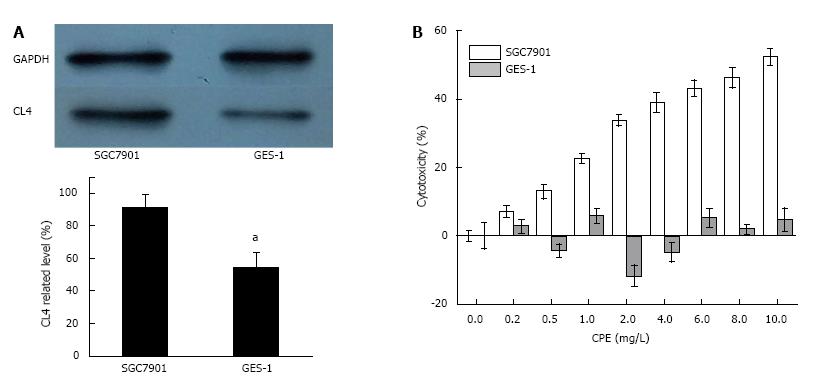
Figure 2 Clostridium perfringens enterotoxin effects on SGC7901 cells and GES-1 cells.
A: CL4 expression in SGC7901 and GES-1 cells. The intensity levels represent as mean ± SD (n = 3). aP < 0.05 vs SGC7901cells; B: Cells were treated with CPE (0, 0.2, 0.5, 1, 2, 4, 6, 8 and 10 mg/L) for 24 h, and the cytotoxicity of CPE was measured by MTT assay. Values represent as mean ± SD (n = 3). CPE: Clostridium perfringens enterotoxin; CL4: Claudin-4.
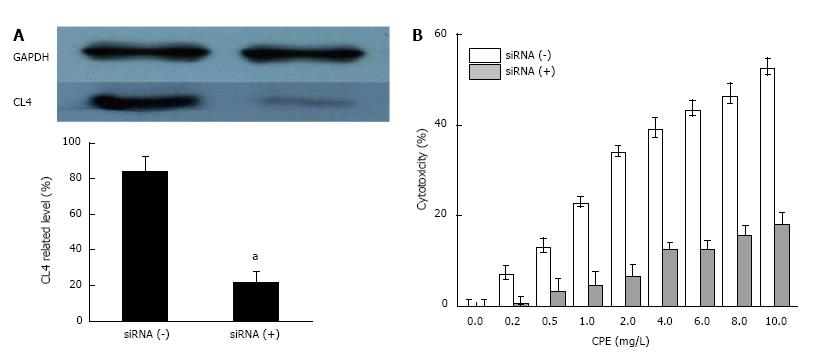
Figure 3 Clostridium perfringens enterotoxin effects on SGC7901 cells with siRNA transfection.
A: SGC7901 cells were transfected with siRNA, and incubated for 24 h. CL4 expression in siRNA (-) and siRNA (+) cells were shown in A. aP < 0.05 vs control group; B: The siRNA (-) and siRNA (+) SGC7901 cells were treated with different concentrations of CPE for 24 h. The MTT assay values represent as mean ± SD (n = 3). CPE: Clostridium perfringens enterotoxin; CL4: Claudin-4.
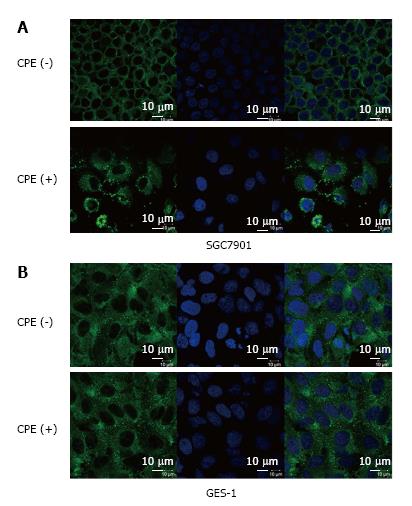
Figure 4 Clostridium perfringens enterotoxin effect on claudin-4 protein in cell membrane.
SGC7901 Cells (A) and GES-1 cells (B) were subjected to CL4 immunostaining under a laser-scanning confocal microscope. Green strains illuminated CL4 protein expression. CPE: Clostridium perfringens enterotoxin; CL4: Claudin-4.
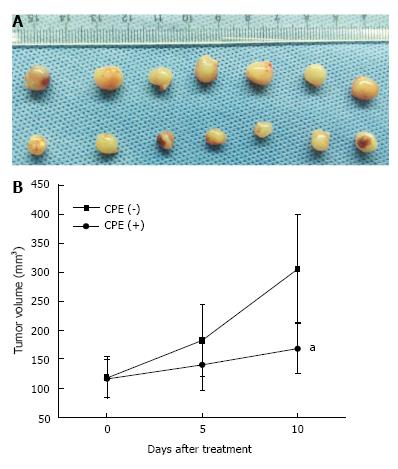
Figure 5 Clostridium perfringens enterotoxin effects on SGC7901 xenograft tumor in nude mice model.
A: SGC7901 xenografts were randomly divided into two groups. Mice were killed on day 10 after CPE treatment and the tumors were measured; B: Obvious reduction of tumor volume was observed in CPE (+) group. The data present as mean ± SD. aP < 0.05 vs CPE (-) group. CPE: Clostridium perfringens enterotoxin.
- Citation: Liang ZY, Kang X, Chen H, Wang M, Guan WX. Effect of Clostridium perfringens enterotoxin on gastric cancer cells SGC7901 which highly expressed claudin-4 protein. World J Gastrointest Oncol 2017; 9(4): 153-159
- URL: https://www.wjgnet.com/1948-5204/full/v9/i4/153.htm
- DOI: https://dx.doi.org/10.4251/wjgo.v9.i4.153


