Copyright
©The Author(s) 2017.
World J Gastrointest Oncol. Mar 15, 2017; 9(3): 105-120
Published online Mar 15, 2017. doi: 10.4251/wjgo.v9.i3.105
Published online Mar 15, 2017. doi: 10.4251/wjgo.v9.i3.105
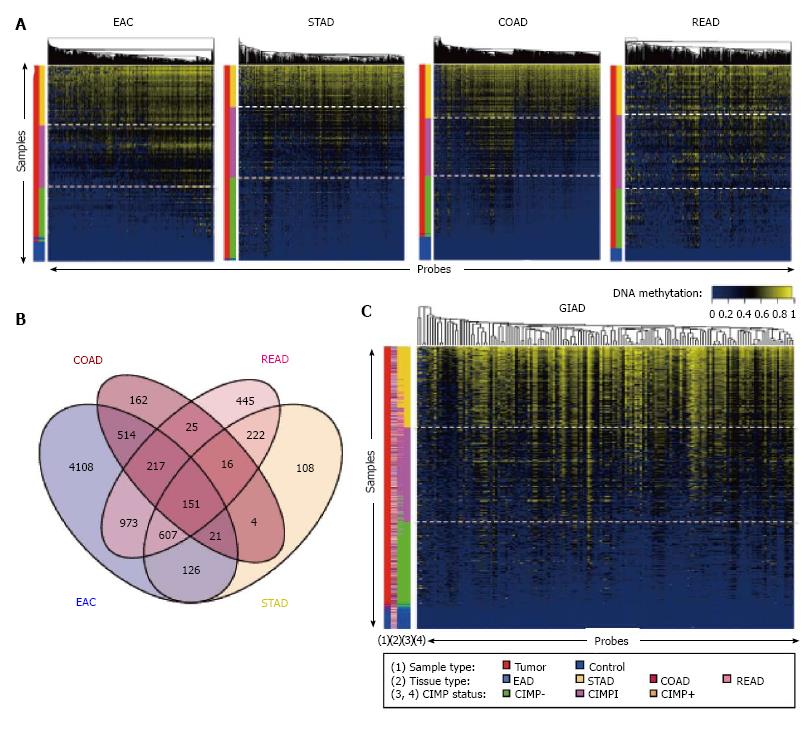
Figure 1 CpG island methylator phenotype analysis of gastrointestinal adenocarcinoma samples from the Cancer Genome Atlas.
A: CIMP analysis for EAC, STAD, COAD, and READ samples. Each row represents a sample, and each column represents a probe. The two-color side bar shows tumor samples (red) and normal samples (blue). The four-color side bar indicates CIMP status: CIMP+ (gold), CIMP intermediate (CIMPi; magenta), CIMP- (green), and normal (blue). Samples were ranked vertically according to mean methylation levels across all of the probes shown in the heat map; B: Venn diagram showing the intersection of the selected, informative probes with regard to CIMP status across the four cancer types; C: CIMP analysis for the combined GIAD data set, in which samples from the four individual tumor types were pooled together. The side bars show (1) sample type (tumor vs adjacent tissue); (2) cancer type (EAC, STAD, COAD, or READ); (3) CIMP status based on the individual analyses shown in panel A; and (4) CIMP status based on the analysis using the pooled data set. CIMP: CpG island methylator phenotype; EAC: Esophageal adenocarcinoma; STAD: Stomach adenocarcinoma; COAD: Colon adenocarcinoma; READ: Rectal adenocarcinoma; GIAD: Gastrointestinal adenocarcinoma.
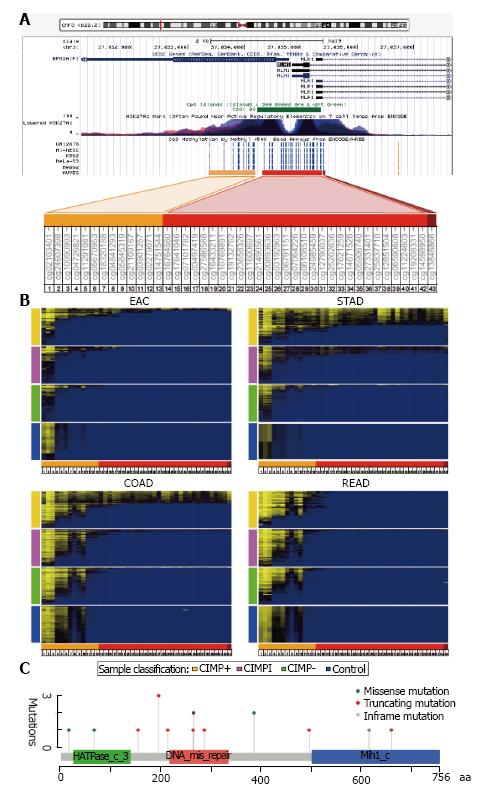
Figure 2 MLH1 promoter methylation and somatic mutations.
A: Diagram of the MLH1 promoter region and the adjacent gene, EPM2AIP1, obtained from the UCSC Human Genome Browser. The probes in this region from the Illumina Infinium HumanMethylation450 array are shown with color bars relative to the CpG island present at this locus: The north shore (orange), the CpG island (red), and the south shore (dark red); B: Heat maps of GIADs showing DNA methylation status across a large genomic region that encompasses the MLH1 promoter. Probes are displayed from left to right, and samples are ordered from top to bottom by average methylation across the region. Color side bars indicate CIMP status: CIMP+ (gold), CIMP intermediate (CIMPi; magenta), CIMP- (green), and control tissue (blue); C: Distribution of 16 somatic mutations in the coding region of MLH1. Color boxes correspond to different functional domains, as specified in the cBioPortal at MSKCC[99], and the vertical axis shows the number of mutations affecting a given codon. GIADs: Gastrointestinal adenocarcinomas; CIMP: CpG island methylator phenotype.
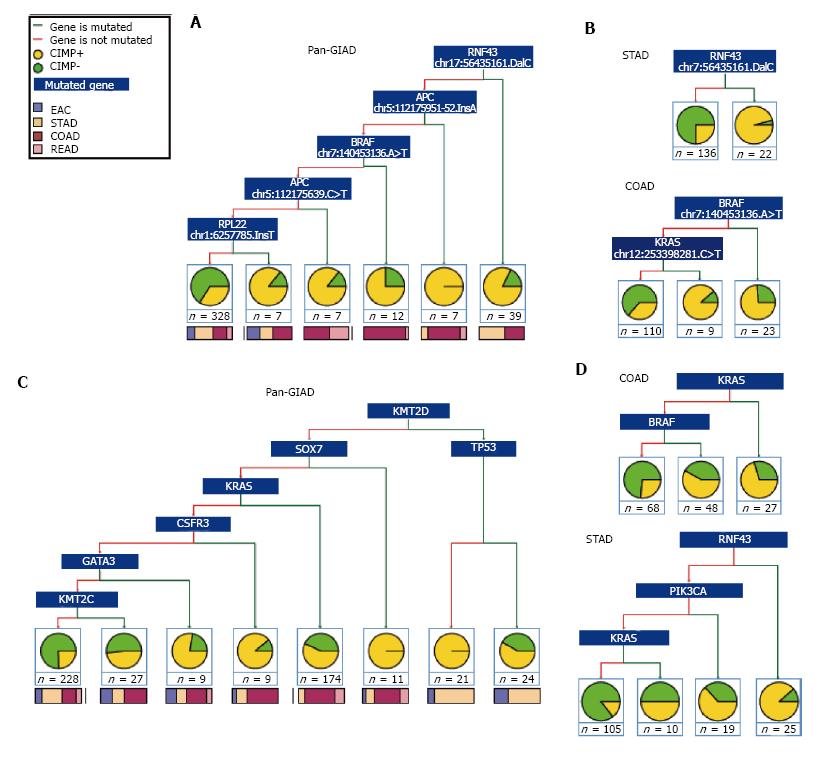
Figure 3 Binary decision trees for separating gastrointestinal adenocarcinomas into CpG island methylator phenotype categories.
Recursive partitioning of GIADs from TCGA using binary classification trees based on CIMP status and mutational profiles. Results are provided for A: The combined GIAD data set at the individual mutation level; B: The STAD and COAD data sets at the individual mutation level; C: The combined GIAD data set at the mutated gene level; D: The STAD and COAD data sets at the mutated gene level. Red and green branches illustrate whether a specific mutation is present or absent (or whether a given gene is mutated or not) in the corresponding subset of tumors. Terminal nodes show the number of samples and the associated CIMP+ vs CIMP- fractions, as well as the proportion of different cancer types represented in each subset. GIADs: Gastrointestinal adenocarcinomas; TCGA: The Cancer Genome Atlas; CIMP: CpG island methylator phenotype.
- Citation: Sánchez-Vega F, Gotea V, Chen YC, Elnitski L. CpG island methylator phenotype in adenocarcinomas from the digestive tract: Methods, conclusions, and controversies. World J Gastrointest Oncol 2017; 9(3): 105-120
- URL: https://www.wjgnet.com/1948-5204/full/v9/i3/105.htm
- DOI: https://dx.doi.org/10.4251/wjgo.v9.i3.105


