Copyright
©The Author(s) 2016.
World J Gastrointest Oncol. Sep 15, 2016; 8(9): 695-706
Published online Sep 15, 2016. doi: 10.4251/wjgo.v8.i9.695
Published online Sep 15, 2016. doi: 10.4251/wjgo.v8.i9.695
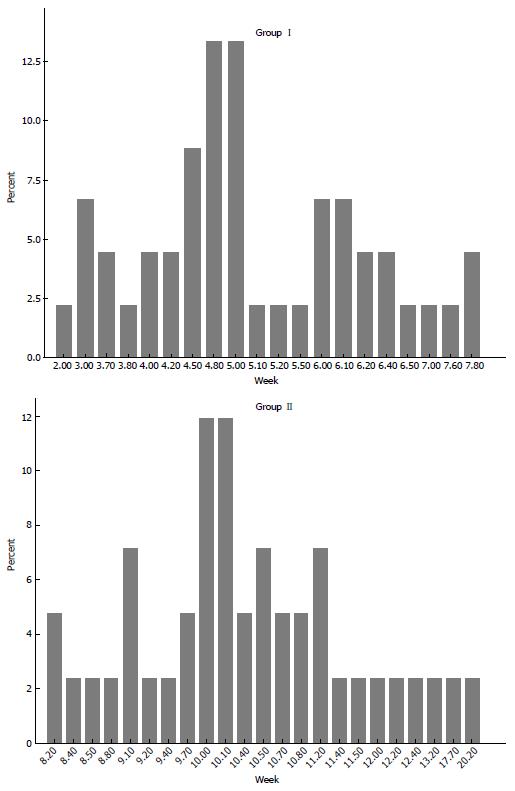
Figure 1 Distributions of groups with regard to interval time between neoadjuvant therapy and surgery.
Median interval periods ± SD were 5 ± 1.28 (2-7.8) wk in group I and 10.1 ± 2.2 (8.2-20.2) wk in group II (P < 0.001).
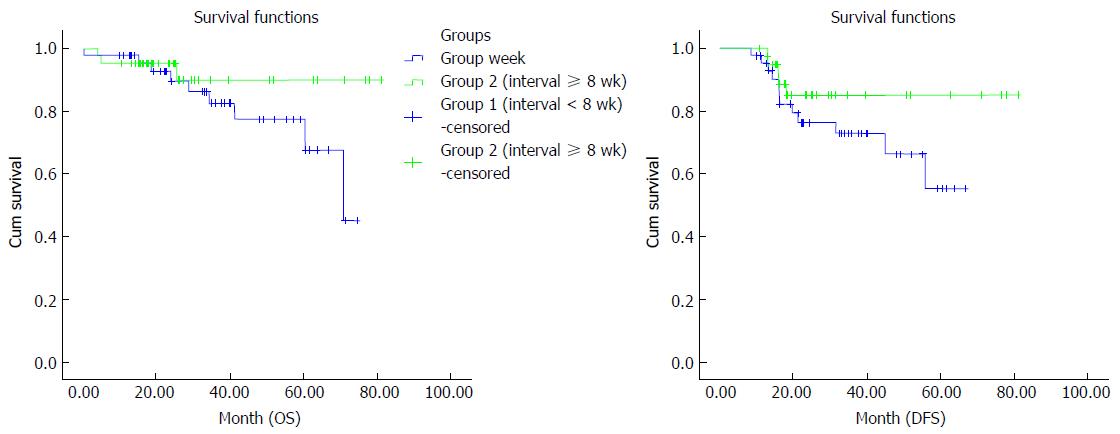
Figure 2 Comparison of overall survival and disease-free survival between the groups by Kaplan–Meier curves.
The median DFS duration in group II was better than in group I (P = 0.01). DFS: Disease-free survival; OS: Overall survival.
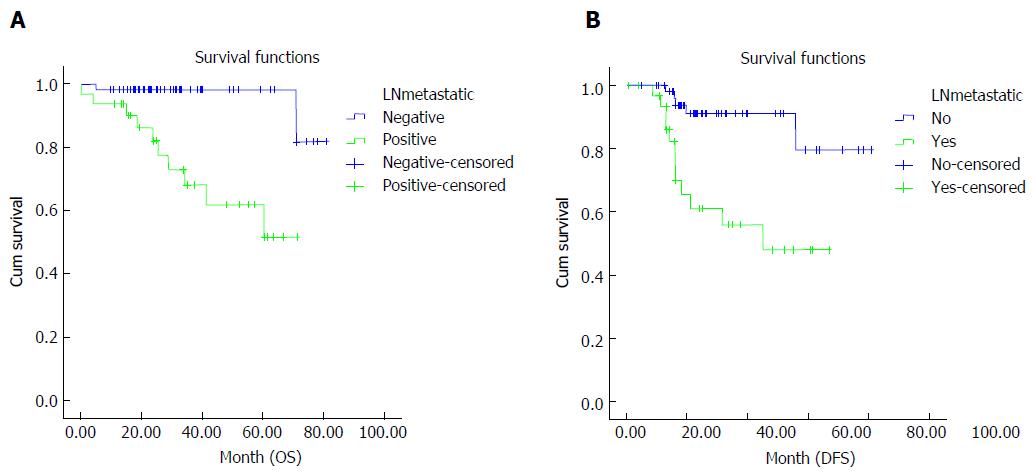
Figure 3 Effect of presence of tumor in lymph nodes and its correlation with overall survival (A) and disease-free survival (B).
Survival rates were better in patients who achieved nodal down-staging (P = 0.001). OS: Overall survival; DFS: Disease-free survival.
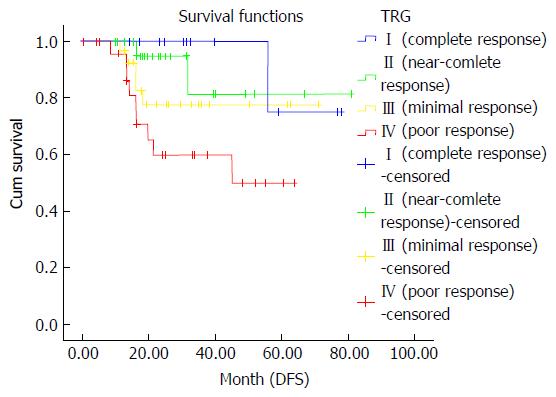
Figure 4 Correlation between level of the pathological tumor responses and disease-free survival.
Only a poor pathologic response (TRG 4) was associated with worse DFS (P = 0.009). TRG: Tumor regression grade; DFS: Disease-free survival.
Figure 5 Local recurrences were similar in both interval groups.
The interval duration did not show any association with local recurrence (P = 0.79).
- Citation: Mihmanlı M, Kabul Gürbulak E, Akgün İE, Celayir MF, Yazıcı P, Tunçel D, Bek TT, Öz A, Ömeroğlu S. Delaying surgery after neoadjuvant chemoradiotherapy improves prognosis of rectal cancer. World J Gastrointest Oncol 2016; 8(9): 695-706
- URL: https://www.wjgnet.com/1948-5204/full/v8/i9/695.htm
- DOI: https://dx.doi.org/10.4251/wjgo.v8.i9.695


