Copyright
©The Author(s) 2016.
World J Gastrointest Oncol. May 15, 2016; 8(5): 427-438
Published online May 15, 2016. doi: 10.4251/wjgo.v8.i5.427
Published online May 15, 2016. doi: 10.4251/wjgo.v8.i5.427
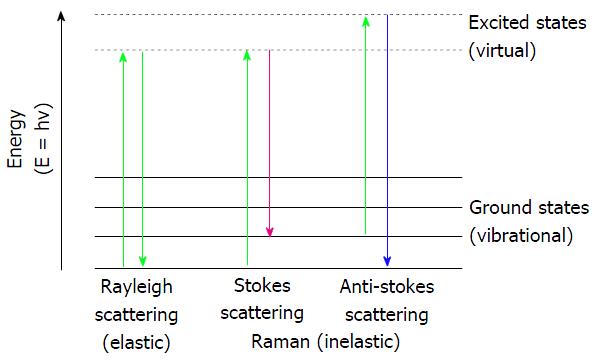
Figure 1 Energy shifts involved in light scattering interactions.
Adapted from Lin et al[23].
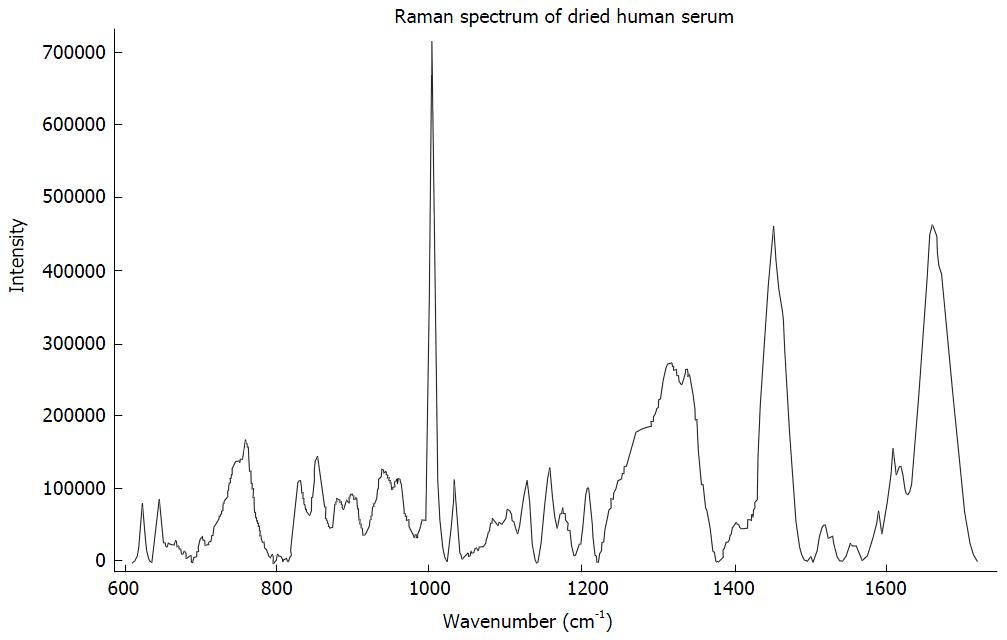
Figure 2 Example Raman spectrum of dried human serum.
Spectrum of dried droplet of human serum taken with 785 nm laser excitation, 10 s acquisition time with an InVia Raman spectrometer (Renishaw, United Kingdom).
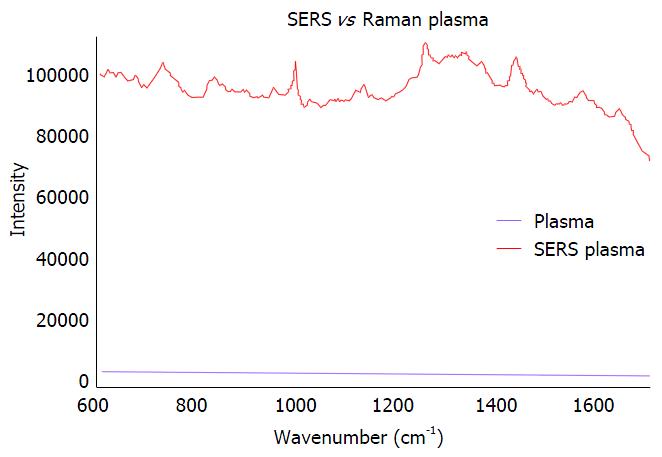
Figure 3 An example spectrum of a surface enhanced Raman spectroscopy response vs Raman response of human blood plasma.
Raman spectrum and SERS spectrum of dried human plasma droplet at 10% laser power with 785 nm laser excitation, 10 s acquisition time with an InVia Raman spectrometer (Renishaw, United Kingdom). SERS response gained by 1:1 mixing with 40 nm raw gold nanoparticles (Nanocs, United States). Purple: SERS response of plasma; Blue: Raman response of plasma. SERS: Surface enhanced Raman spectroscopy.
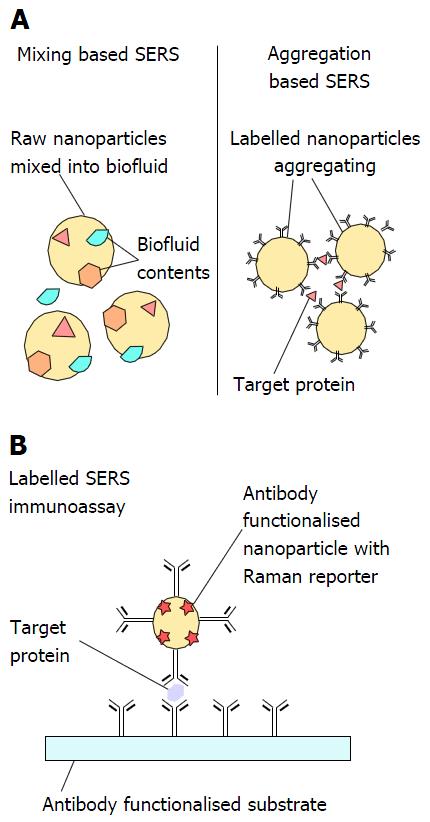
Figure 4 Different methods of producing a surface enhanced Raman spectroscopy response with biological samples.
A: Mixing based methods with both non-labeled mixing and labeled or “aggregation” based mixing; B: Labeled surface enhanced Raman spectroscopy based immunoassay. SERS: Surface enhanced Raman spectroscopy.
- Citation: Jenkins CA, Lewis PD, Dunstan PR, Harris DA. Role of Raman spectroscopy and surface enhanced Raman spectroscopy in colorectal cancer. World J Gastrointest Oncol 2016; 8(5): 427-438
- URL: https://www.wjgnet.com/1948-5204/full/v8/i5/427.htm
- DOI: https://dx.doi.org/10.4251/wjgo.v8.i5.427


