Copyright
©2012 Baishideng Publishing Group Co.
World J Gastrointest Oncol. Dec 15, 2012; 4(12): 238-249
Published online Dec 15, 2012. doi: 10.4251/wjgo.v4.i12.238
Published online Dec 15, 2012. doi: 10.4251/wjgo.v4.i12.238
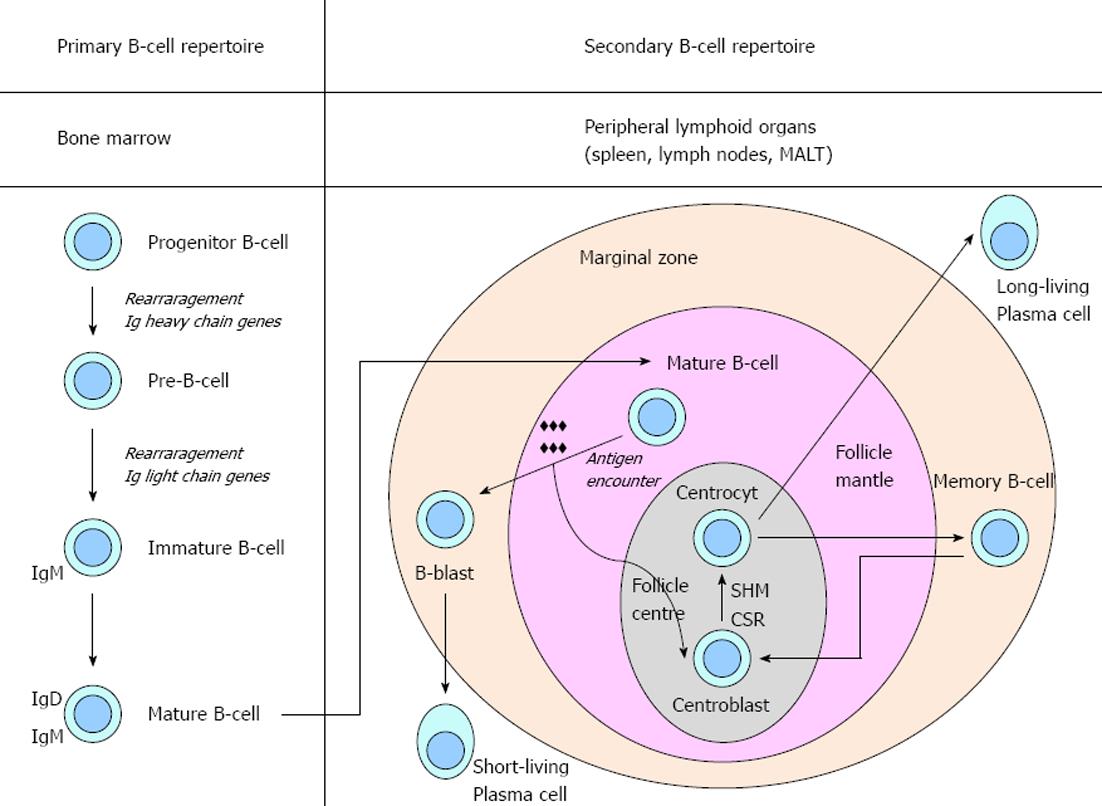
Figure 1 B-cell development.
Schematic representation of the events in the development of primary and secondary B-cell repertoire. Ig: Immunoglobulin; CSR: Class switch recombination; SHM: Somatic hypermutation.
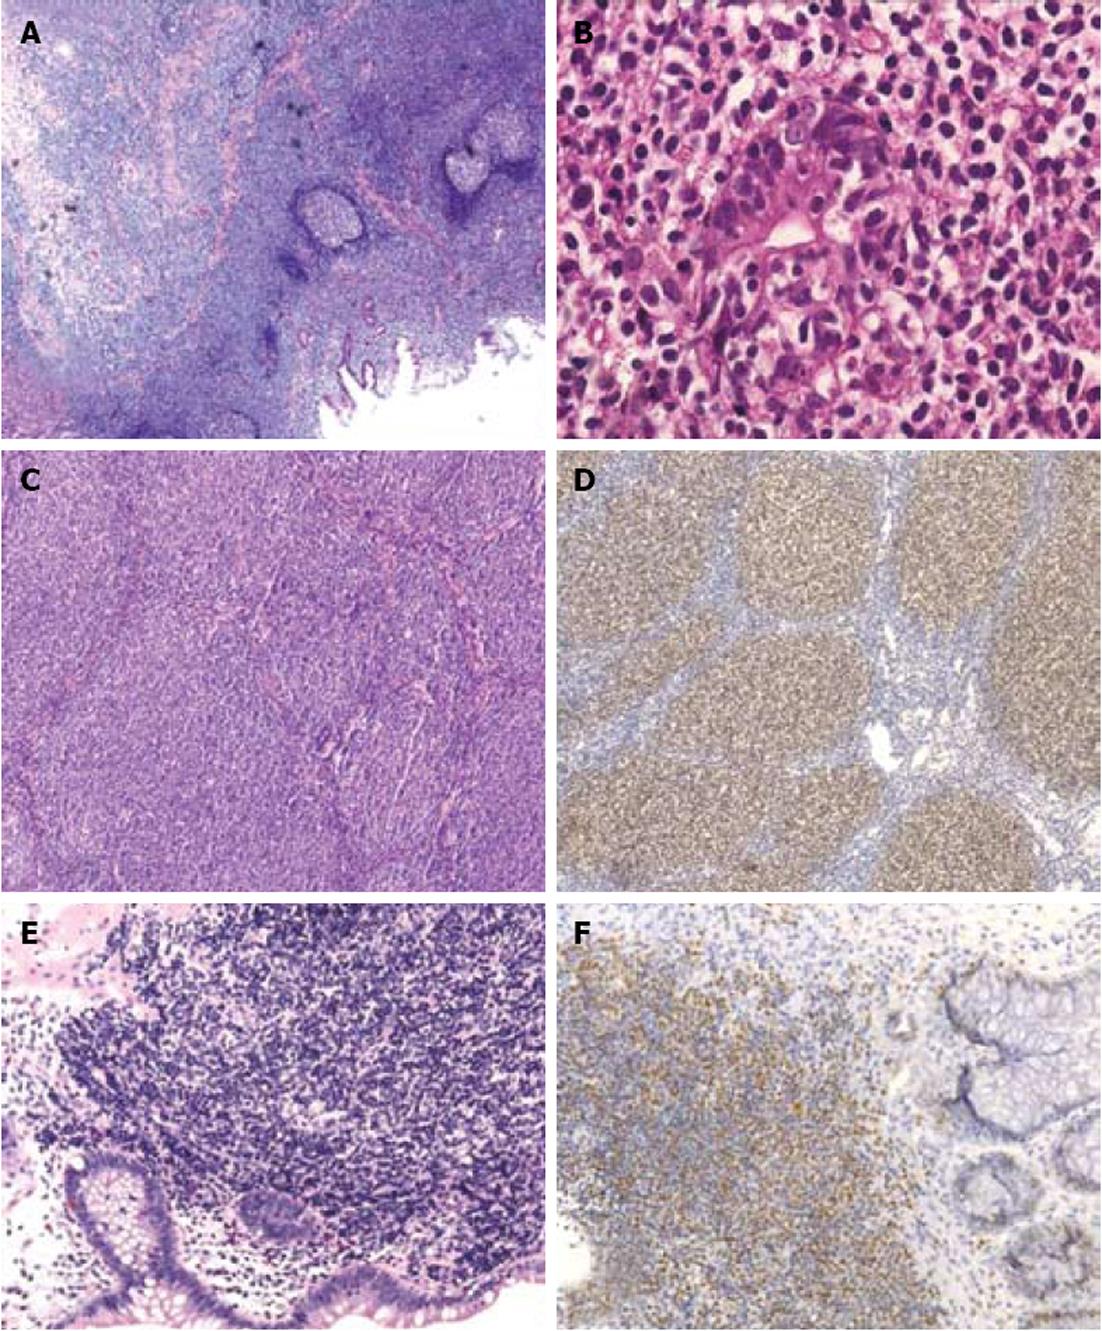
Figure 2 Histology of gastrointestinal mucosa-associated lymphoid tissue, follicular and mantle-cell lymphomas.
A: Hematoxylin eosin (HE) staining of a gastric mucosa-associated lymphoid tissue lymphoma demonstrates presence of reactive follicles surrouned by a neoplastic lymphoid infiltrate (magnification 50 ×); B: Destruction of a gastric gland by the neoplastic B-cellss: lymphoepithelial lesion (magnification 400 ×); C: HE staining of a duodenal follicular lymphoma highlights the presence of aberrant follicular growth pattern (magnification 100 ×); D: Aberrant B-cell-lymphoma-2 expression by a duodenal follicular lymphoma (magnification 100 ×); E: HE staining of a mantle-cell lymphoma in the colon (magnification 200 ×); F: Aberrant cyclin D1 expression by an intestinal mantle-cell lymphoma (magnification 100 ×).
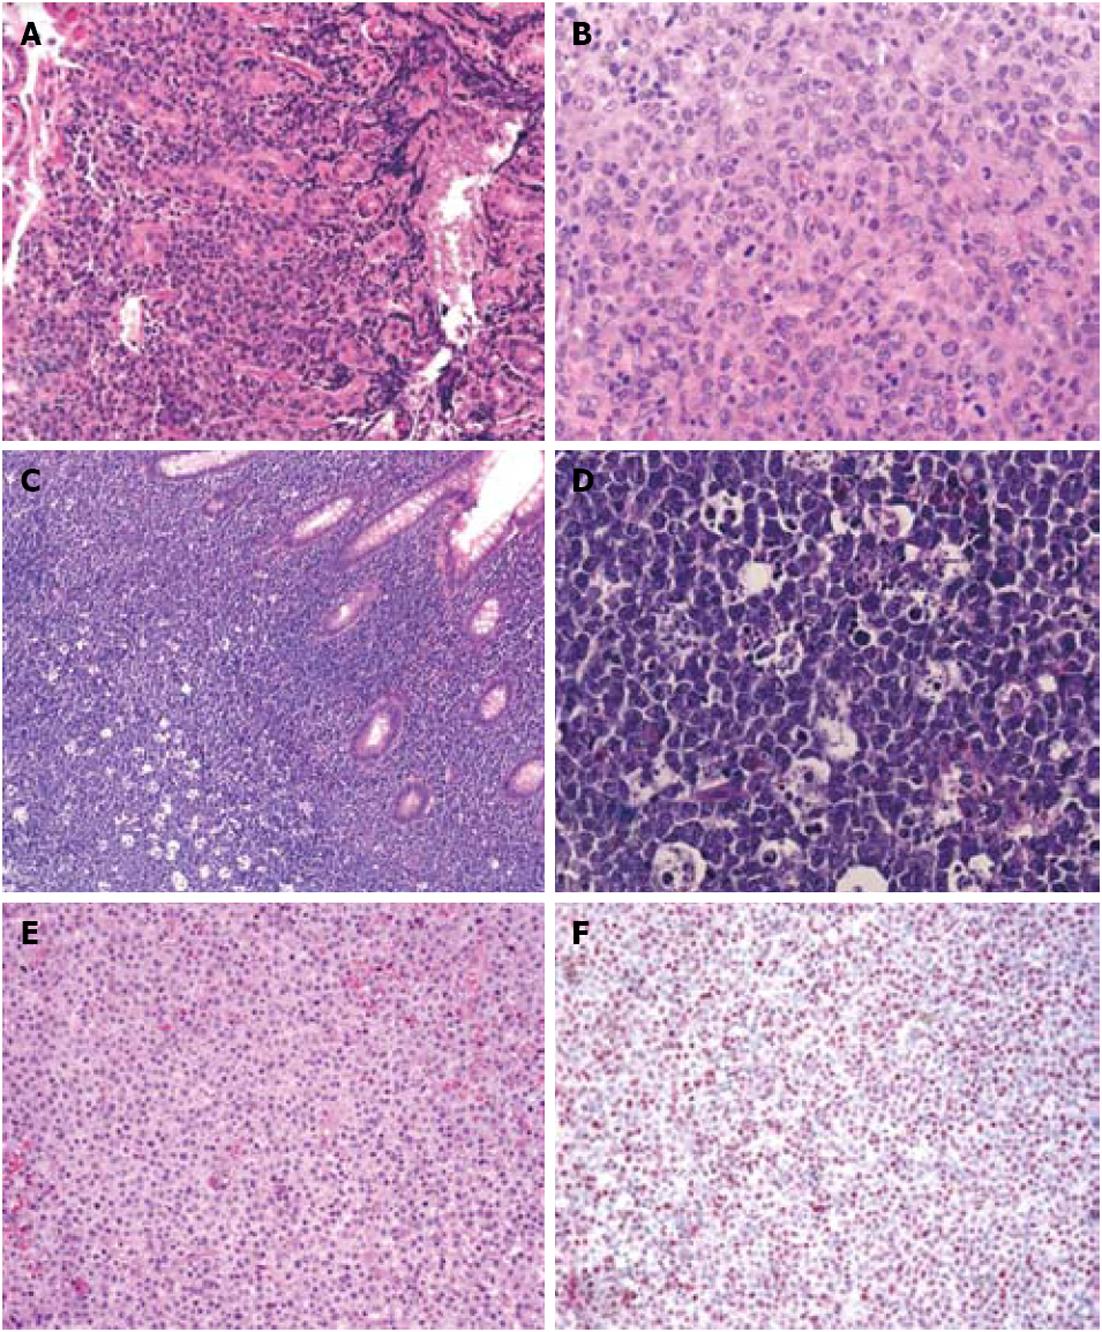
Figure 3 Histology of other gastrointestinal B-cell lymphomas.
A: Hematoxylin eosin (HE) staining of a gastric diffuse large B-cell lymphoma (magnification 200 ×); B: Polymorphic appearance of the large tumor B-cells in a gastric diffuse large B-cell lymphoma (magnification 400 ×); C: HE staining of an intestinal Burkitt lymphoma with the typical “starry sky” appearance (magnification 100 ×); D: Presence of multiple pale macrophages filled with apoptotic debris in an intestinal Burkitt lymphoma (magnification 400 ×); E: HE staining of an intestinal monomorphic post-transplantation lymphoproliferative disorders (PTLD) (magnification 200 ×); F: In situ hybridization demonstrates presence of EBV-encoded RNA (= red colored nuclei) in the neoplastic cells of an intestinal monomorphic PTLD (magnification 100 ×).
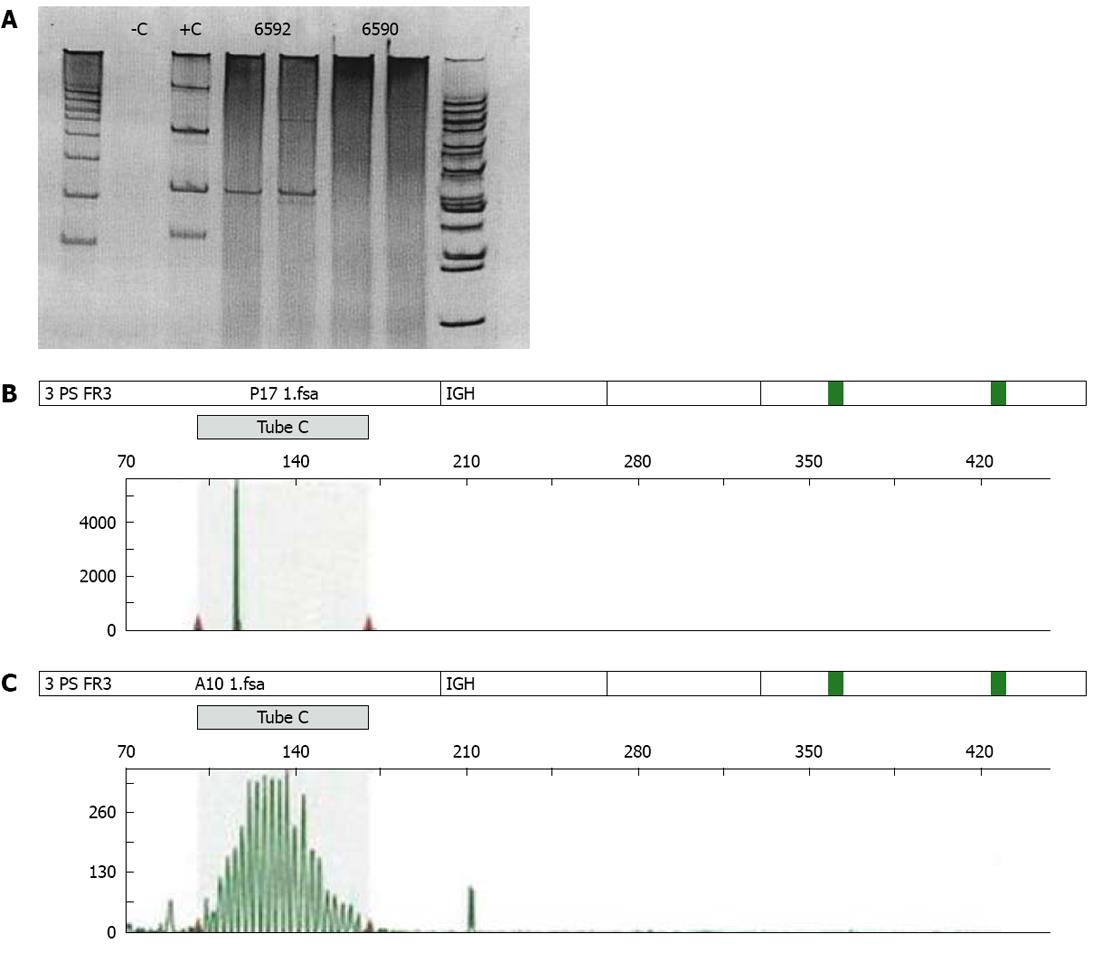
Figure 4 Polymerase chain reaction.
A: Polyclonal B-cell pathology results in a broad smear of the polymerase chain reaction (PCR) product on a gel, while a monoclonal pathology (lymphoma) will give rise to a sharp band on a gel, hereby reflecting PCR products that have the same size. +C: Positive control; -C: Negative control; 6592: Tumor case; 6590: Reactive case; B: Gaussian curve in a polyclonal B-cell population examined by multiplex PCR; C: Peak in a neoplastic B-cell clone examined by multiplex PCR.
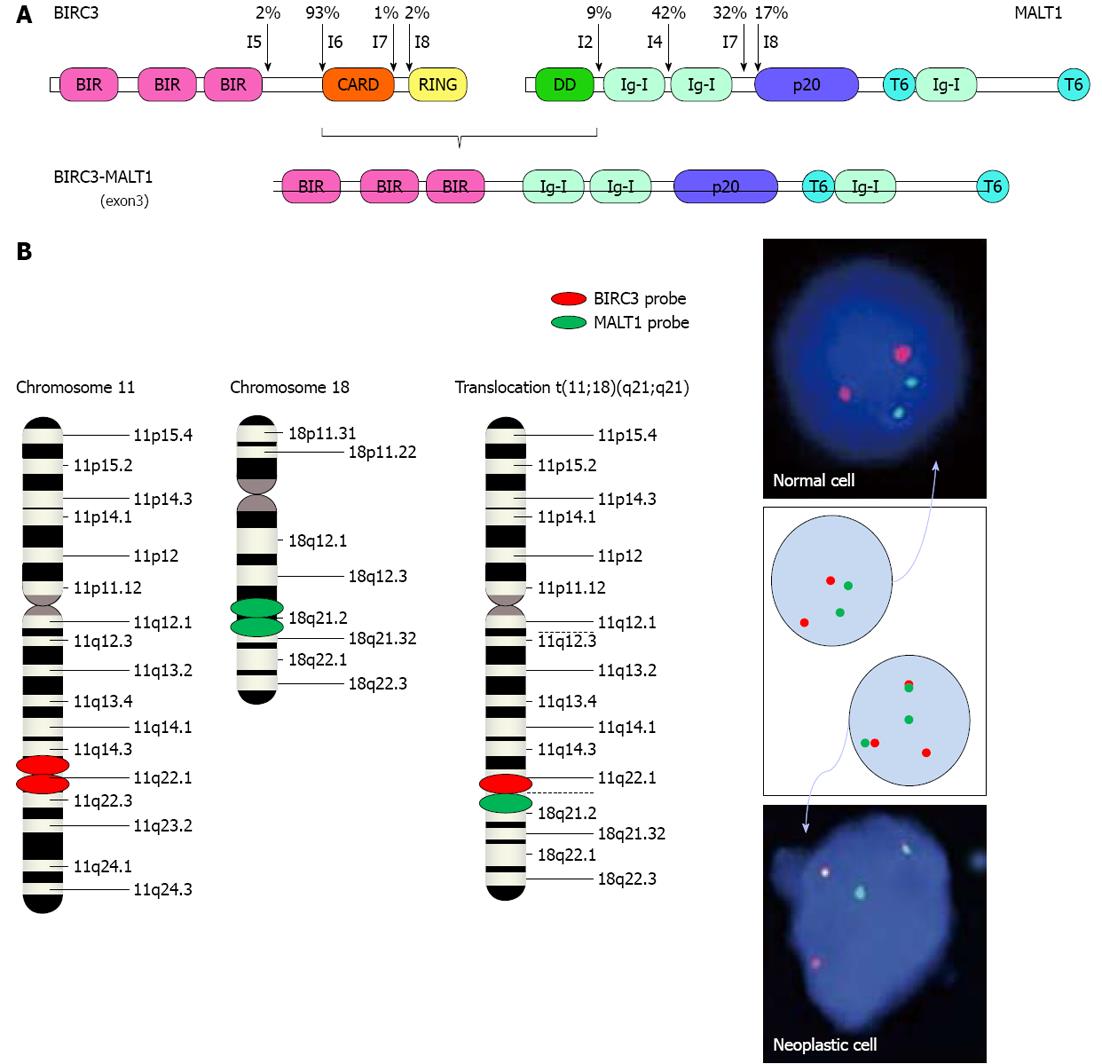
Figure 5 Fusion protein BIRC3-MALT1 in mucosa-associated lymphoid tissue lymphomas.
A: Known break points (arrows) in BIRC3 and MALT1 are shown with their frequencies. The break points within BIRC3 almost always occur in I6 (according to Ensembl Gene ENSG00000023445), whereas those within MALT1 are located in I2, I4, I7 and I8, which result in four possible versions of the BIRC3-MALT1 fusion gene: BIRC3(I6)-MALT1(I2), BIRC3(I6)-MALT1(I4), BIRC3(I6)-MALT1(I7) and BIRC3(I6)-MALT1(I8). The fusion gene depicted is the BIRC3(I6)-MALT1(I4) version. BIR: Baculovirus inhibitor of apoptosis repeat; CARD: Caspase recruitment domain; DD: Death domain; I: Intron; Ig: Immunoglobulin-like; p20: Caspase-like p20 domain; RING: Really interesting new gene; T6: Tumor necrosis factor receptor associated factor 6 binding site; B: Interphase FISH with dual-fusion probes results in 2 separate red and 2 separate green signals in normal lymphocytes, whereas t(11;18)(q21;q21)-positive MALT lymphoma cells will display 1 red and 1 green signal (that represent the normal loci) accompanied by 2 pathological fused red/green signals.
- Citation: Sagaert X, Tousseyn T, Yantiss RK. Gastrointestinal B-cell lymphomas: From understanding B-cell physiology to classification and molecular pathology. World J Gastrointest Oncol 2012; 4(12): 238-249
- URL: https://www.wjgnet.com/1948-5204/full/v4/i12/238.htm
- DOI: https://dx.doi.org/10.4251/wjgo.v4.i12.238


