Copyright
©2010 Baishideng.
World J Gastrointest Oncol. Jul 15, 2010; 2(7): 295-303
Published online Jul 15, 2010. doi: 10.4251/wjgo.v2.i7.295
Published online Jul 15, 2010. doi: 10.4251/wjgo.v2.i7.295
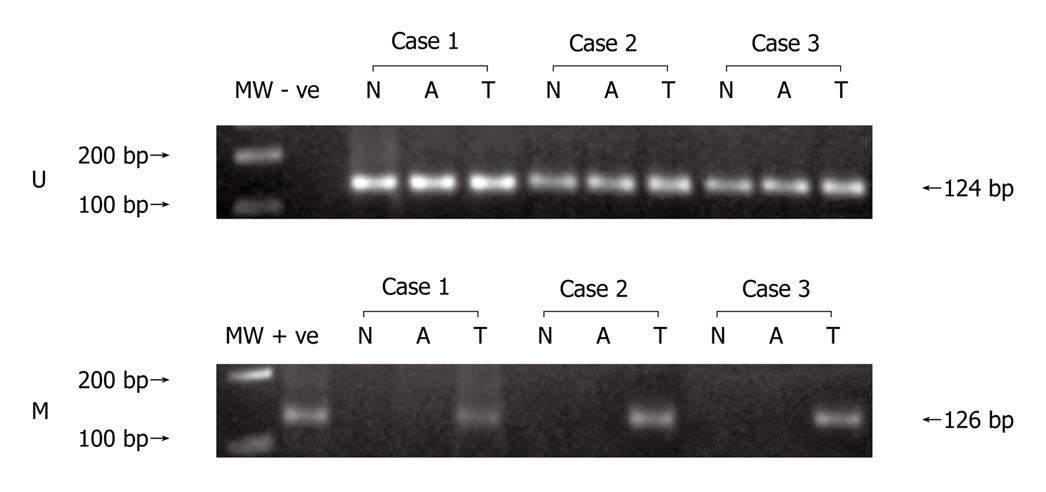
Figure 1 Methylation specific polymerase chain reaction for p16 gene in colorectal tumor tissue, adjoining and normal mucosa.
U: Polymerase chain reaction (PCR) with primers for unmethylated p16; M: PCR with primers for methylated p16; MW: Molecular weight marker; - ve: negative control (without template); + ve: Normal lymphocyte DNA completely methylated with CpG methylase (M.sss1) used as a positive control for methylation; N: Normal mucosa; A: Adjoining mucosa; T: tumor tissue.
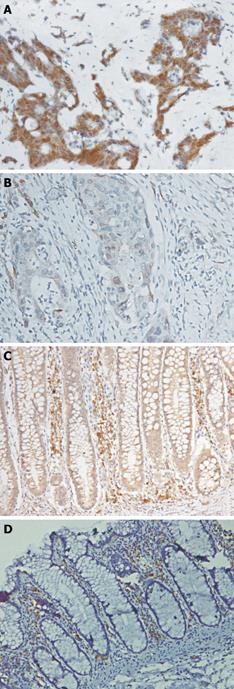
Figure 2 Immunohistochemical staining showing expression of p16 protein.
A: Tumor showing strong nuclear and cytoplasmic positivity of p16; B: Tumor showing reduced cytoplasmic positivity for p16; C: Adjoining mucosa showing moderate cytoplasmic positivity for p16; D: Normal colorectal mucosa showing no positivity for p16 (SABP immunostaining; × 450).
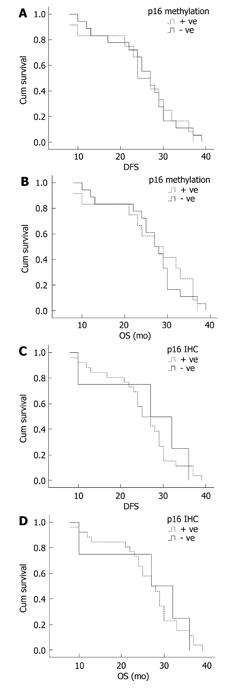
Figure 3 Survival curves of patients with colorectal adenocarcinoma showing correlation.
A: p16 methylation status with probability of disease-free survival (DFS); B: p16 methylation status with probability of overall survival (OS); C: p16 protein expression with probability of DFS; D: p16 protein expression with probability of OS.
-
Citation: Malhotra P, Kochhar R, Vaiphei K, Wig JD, Mahmood S. Aberrant promoter methylation of
p16 in colorectal adenocarcinoma in North Indian patients. World J Gastrointest Oncol 2010; 2(7): 295-303 - URL: https://www.wjgnet.com/1948-5204/full/v2/i7/295.htm
- DOI: https://dx.doi.org/10.4251/wjgo.v2.i7.295


