Copyright
©2010 Baishideng.
World J Gastrointest Oncol. Apr 15, 2010; 2(4): 197-204
Published online Apr 15, 2010. doi: 10.4251/wjgo.v2.i4.197
Published online Apr 15, 2010. doi: 10.4251/wjgo.v2.i4.197
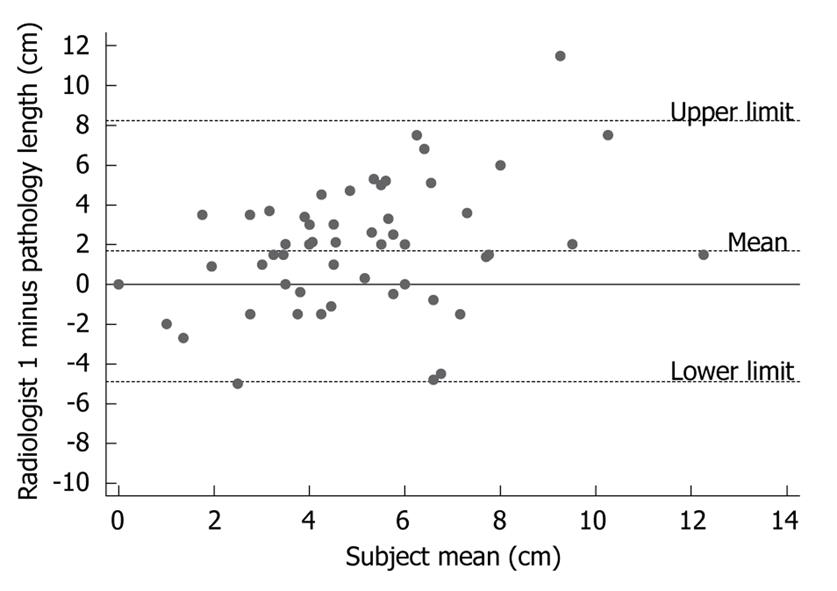
Figure 1 Bland-Altman plot showing the relationship between computed tomography (CT) and pathology measurements of esophageal tumor lengths.
The difference between the two measurements was plotted against their mean. The majority of the points fall above and below the zero line showing a weak agreement.
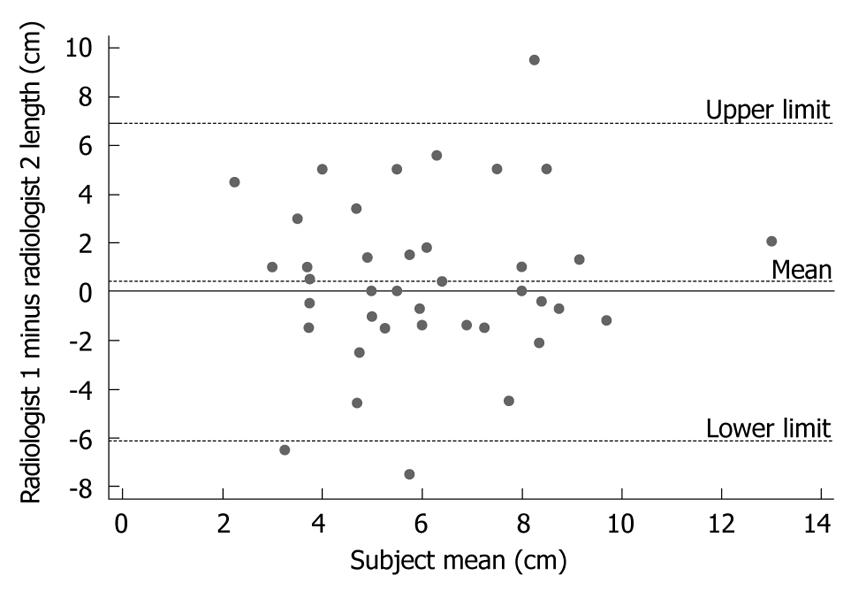
Figure 2 Bland-Altman plot for inter-observer variability of the radiologists.
The limits of agreement between the radiologists range from -6.10-6.95 cm with a mean difference (95% CI) of 0.39 (-0.59 to 1.44); Indicating weak agreement between the independent measurements.
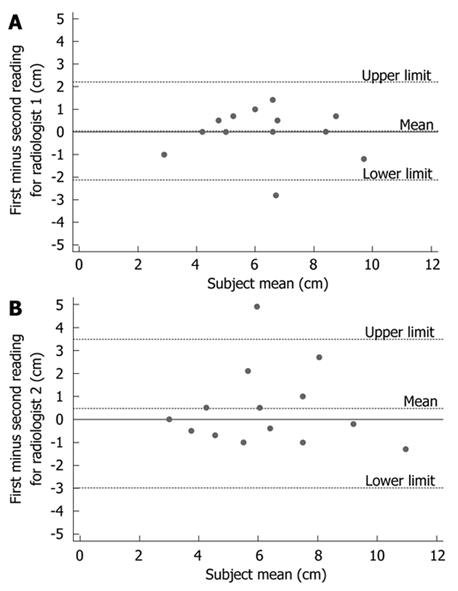
Figure 3 Bland-Altman plots of intra-observer agreement in CT measurements of esophageal tumor length.
A: For radiologist 1, the limits of agreement range from -2.13 to 2.20 cm with a mean difference (95% CI) of 0.04 (-0.59 to 0.66); B: For radiologist 2, the limits of agreement range from -2.98-3.92 cm with a mean difference (95% CI) is 0.47 (-0.53-1.47).
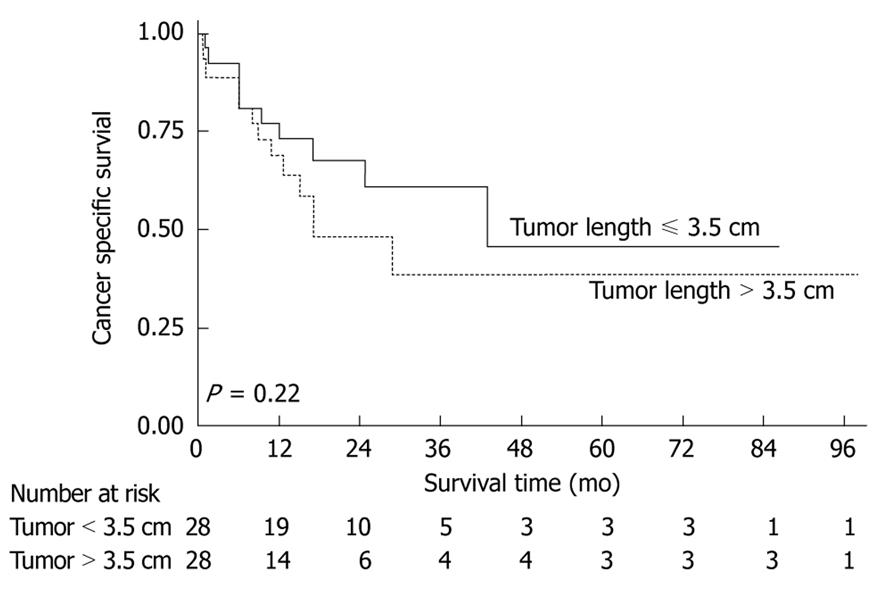
Figure 4 Kaplan-Meier plot of cancer-specific survival following surgery for 56 patients with esophageal cancer stratified according to tumor length measured using CT.
- Citation: Sillah K, Williams LR, Laasch HU, Saleem A, Watkins G, Pritchard SA, Price PM, West CM, Welch IM. Computed tomography overestimation of esophageal tumor length: Implications for radiotherapy planning. World J Gastrointest Oncol 2010; 2(4): 197-204
- URL: https://www.wjgnet.com/1948-5204/full/v2/i4/197.htm
- DOI: https://dx.doi.org/10.4251/wjgo.v2.i4.197


