Copyright
©2010 Baishideng Publishing Group Co.
World J Gastrointest Oncol. Dec 15, 2010; 2(12): 429-442
Published online Dec 15, 2010. doi: 10.4251/wjgo.v2.i12.429
Published online Dec 15, 2010. doi: 10.4251/wjgo.v2.i12.429
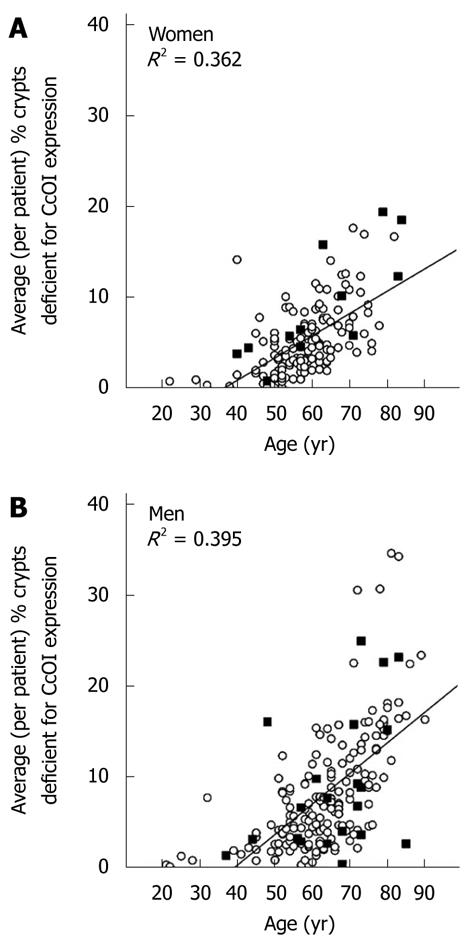
Figure 1 Average (per patient) percent of crypts deficient for cytochrome c oxidase subunit I expression plotted against patient age for women (A) and men (B).
Solid squares represent patients with a prior or current colonic adenocarcinoma and circles represent patients without colonic adenocarcinoma. CcOI: Cytochrome c oxidase subunit I.
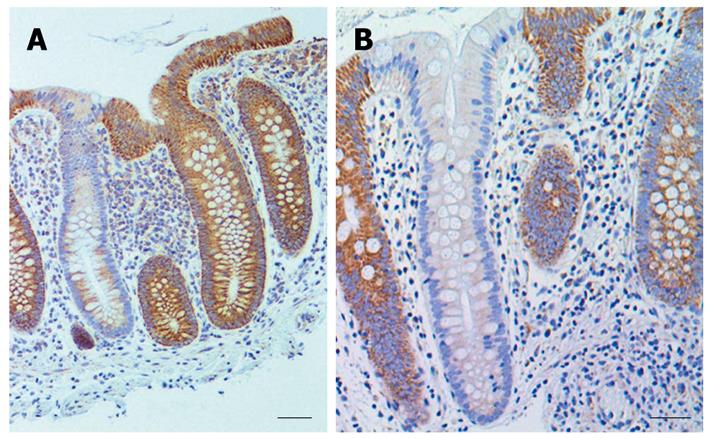
Figure 2 Examples of colon crypts immunohistochemically stained for cytochrome c oxidase I showing low expression next to highly expressing crypts.
A: Bar shows 50 μm; B: Bar shows 40 μm. Brown staining indicates cytochrome c oxidase I expression and blue indicates nuclear hematoxylin staining.
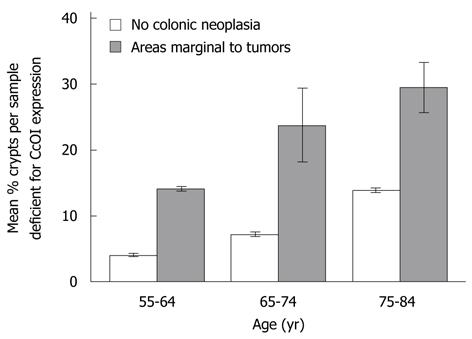
Figure 3 Comparison of mean percent cytochrome c oxidase I deficiency in areas marginal to tumors within surgical resections from males with aged-matched biopsy samples from males without a history of colonic neoplasia.
S.E. indicated for each mean.
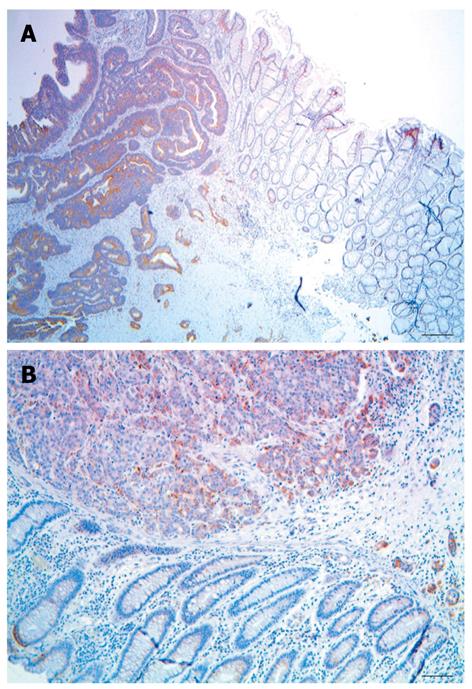
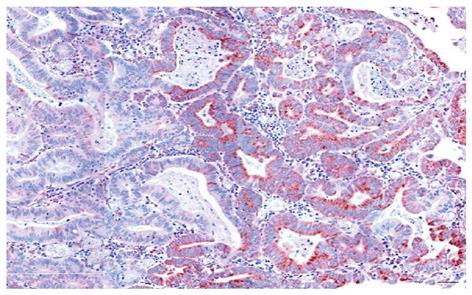
Figure 4 Large clusters of cytochrome c oxidase I deficient crypts along the margins of colon adenocarcinomas.
A: Bar shows 100 μm; B: Bar shows 50 μm.
Figure 5 Image of colonic adenocarcinoma showing an area of high cytochrome c oxidase I expression (brown) adjacent to an area of low cytochrome c oxidase I expression.
Bar shows 50 μm.
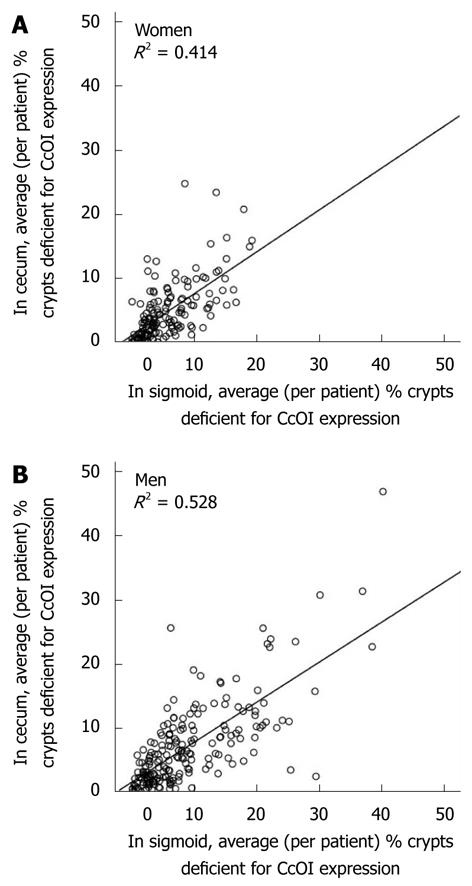
Figure 6 Correlation, within individuals, of average cytochrome c oxidase I deficiency in the cecum with average cytochrome c oxidase I deficiency in their sigmoid colon for women (A) and men (B).
CcOI: Cytochrome c oxidase I.
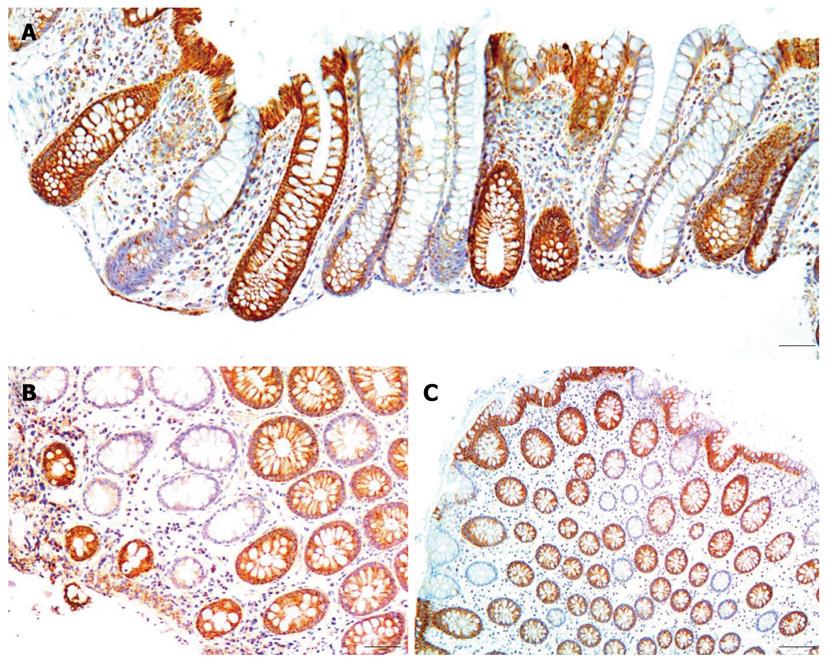
Figure 7 Examples of clusters of cytochrome c oxidase I deficient crypts.
A: Cut along the long axes of crypts, bar shows 50 μm; B: Cut along the short axes of crypts, bar shows 50 μm; C: Cut along the short axes of crypts, bar shows 100 μm.
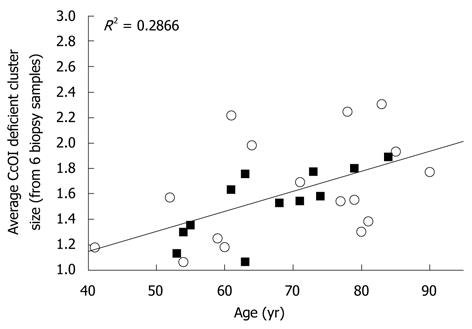
Figure 8 Mean cluster size of cytochrome c oxidase I deficient crypts (data averaged from 6 biopsies from each of 12 female patients (black squares) and 16 male patients (white circles) plotted against age.
CcOI: Cytochrome c oxidase I.
Figure 9 Examples of crypts undergoing fission.
(A) and (B) are examples of crypts undergoing fission where the crypts have high levels of cytochrome c oxidase I (CcOI) expression; (C) and (D) are examples of crypts undergoing fission where the crypts have reduced or absent levels of CcOI expression. Bars show 50 μm.
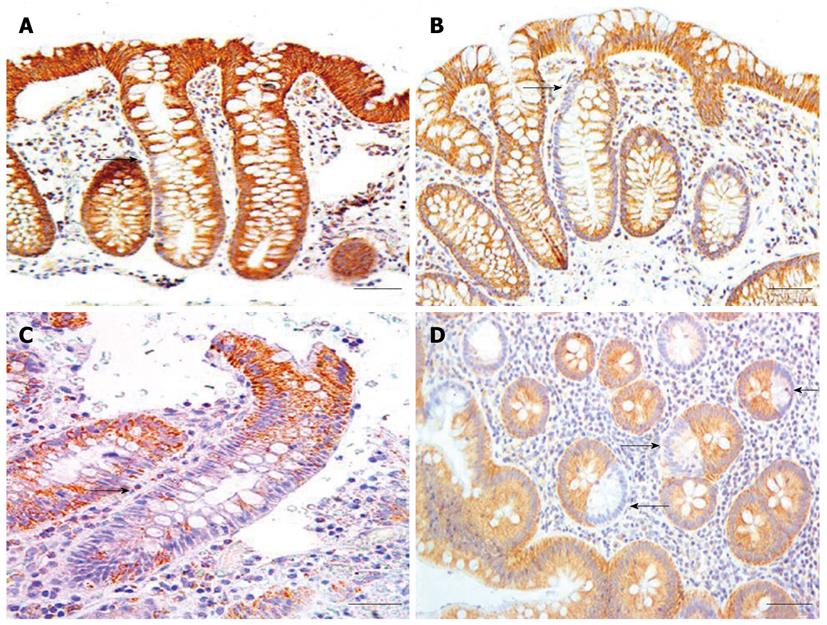
Figure 10 Examples of crypts with segmental cytochrome c oxidase I deficiency, panels A, B and C cut along the long axes of crypts, panel D cut along the short axes of crypts.
Panel A shows one crypt with deficient cytochrome c oxidase I (CcOI) expression halfway up crypt from stem cell region and only on one side (arrow); panel B has one entire side of crypt deficient for CcOI (arrow); panel C has deficiency for CcOI on both sides but only about ¾ of the way up the crypt (arrow); panel D shows three crypts in cross-section with one side deficient for CcOI expression (arrows). Bars show 50 μm.
-
Citation: Bernstein C, Facista A, Nguyen H, Zaitlin B, Hassounah N, Loustaunau C, Payne CM, Banerjee B, Goldschmid S, Tsikitis VL, Krouse R, Bernstein H. Cancer and age related colonic crypt deficiencies in cytochrome
c oxidase I. World J Gastrointest Oncol 2010; 2(12): 429-442 - URL: https://www.wjgnet.com/1948-5204/full/v2/i12/429.htm
- DOI: https://dx.doi.org/10.4251/wjgo.v2.i12.429


