Copyright
©The Author(s) 2025.
World J Gastrointest Oncol. Jul 15, 2025; 17(7): 108162
Published online Jul 15, 2025. doi: 10.4251/wjgo.v17.i7.108162
Published online Jul 15, 2025. doi: 10.4251/wjgo.v17.i7.108162
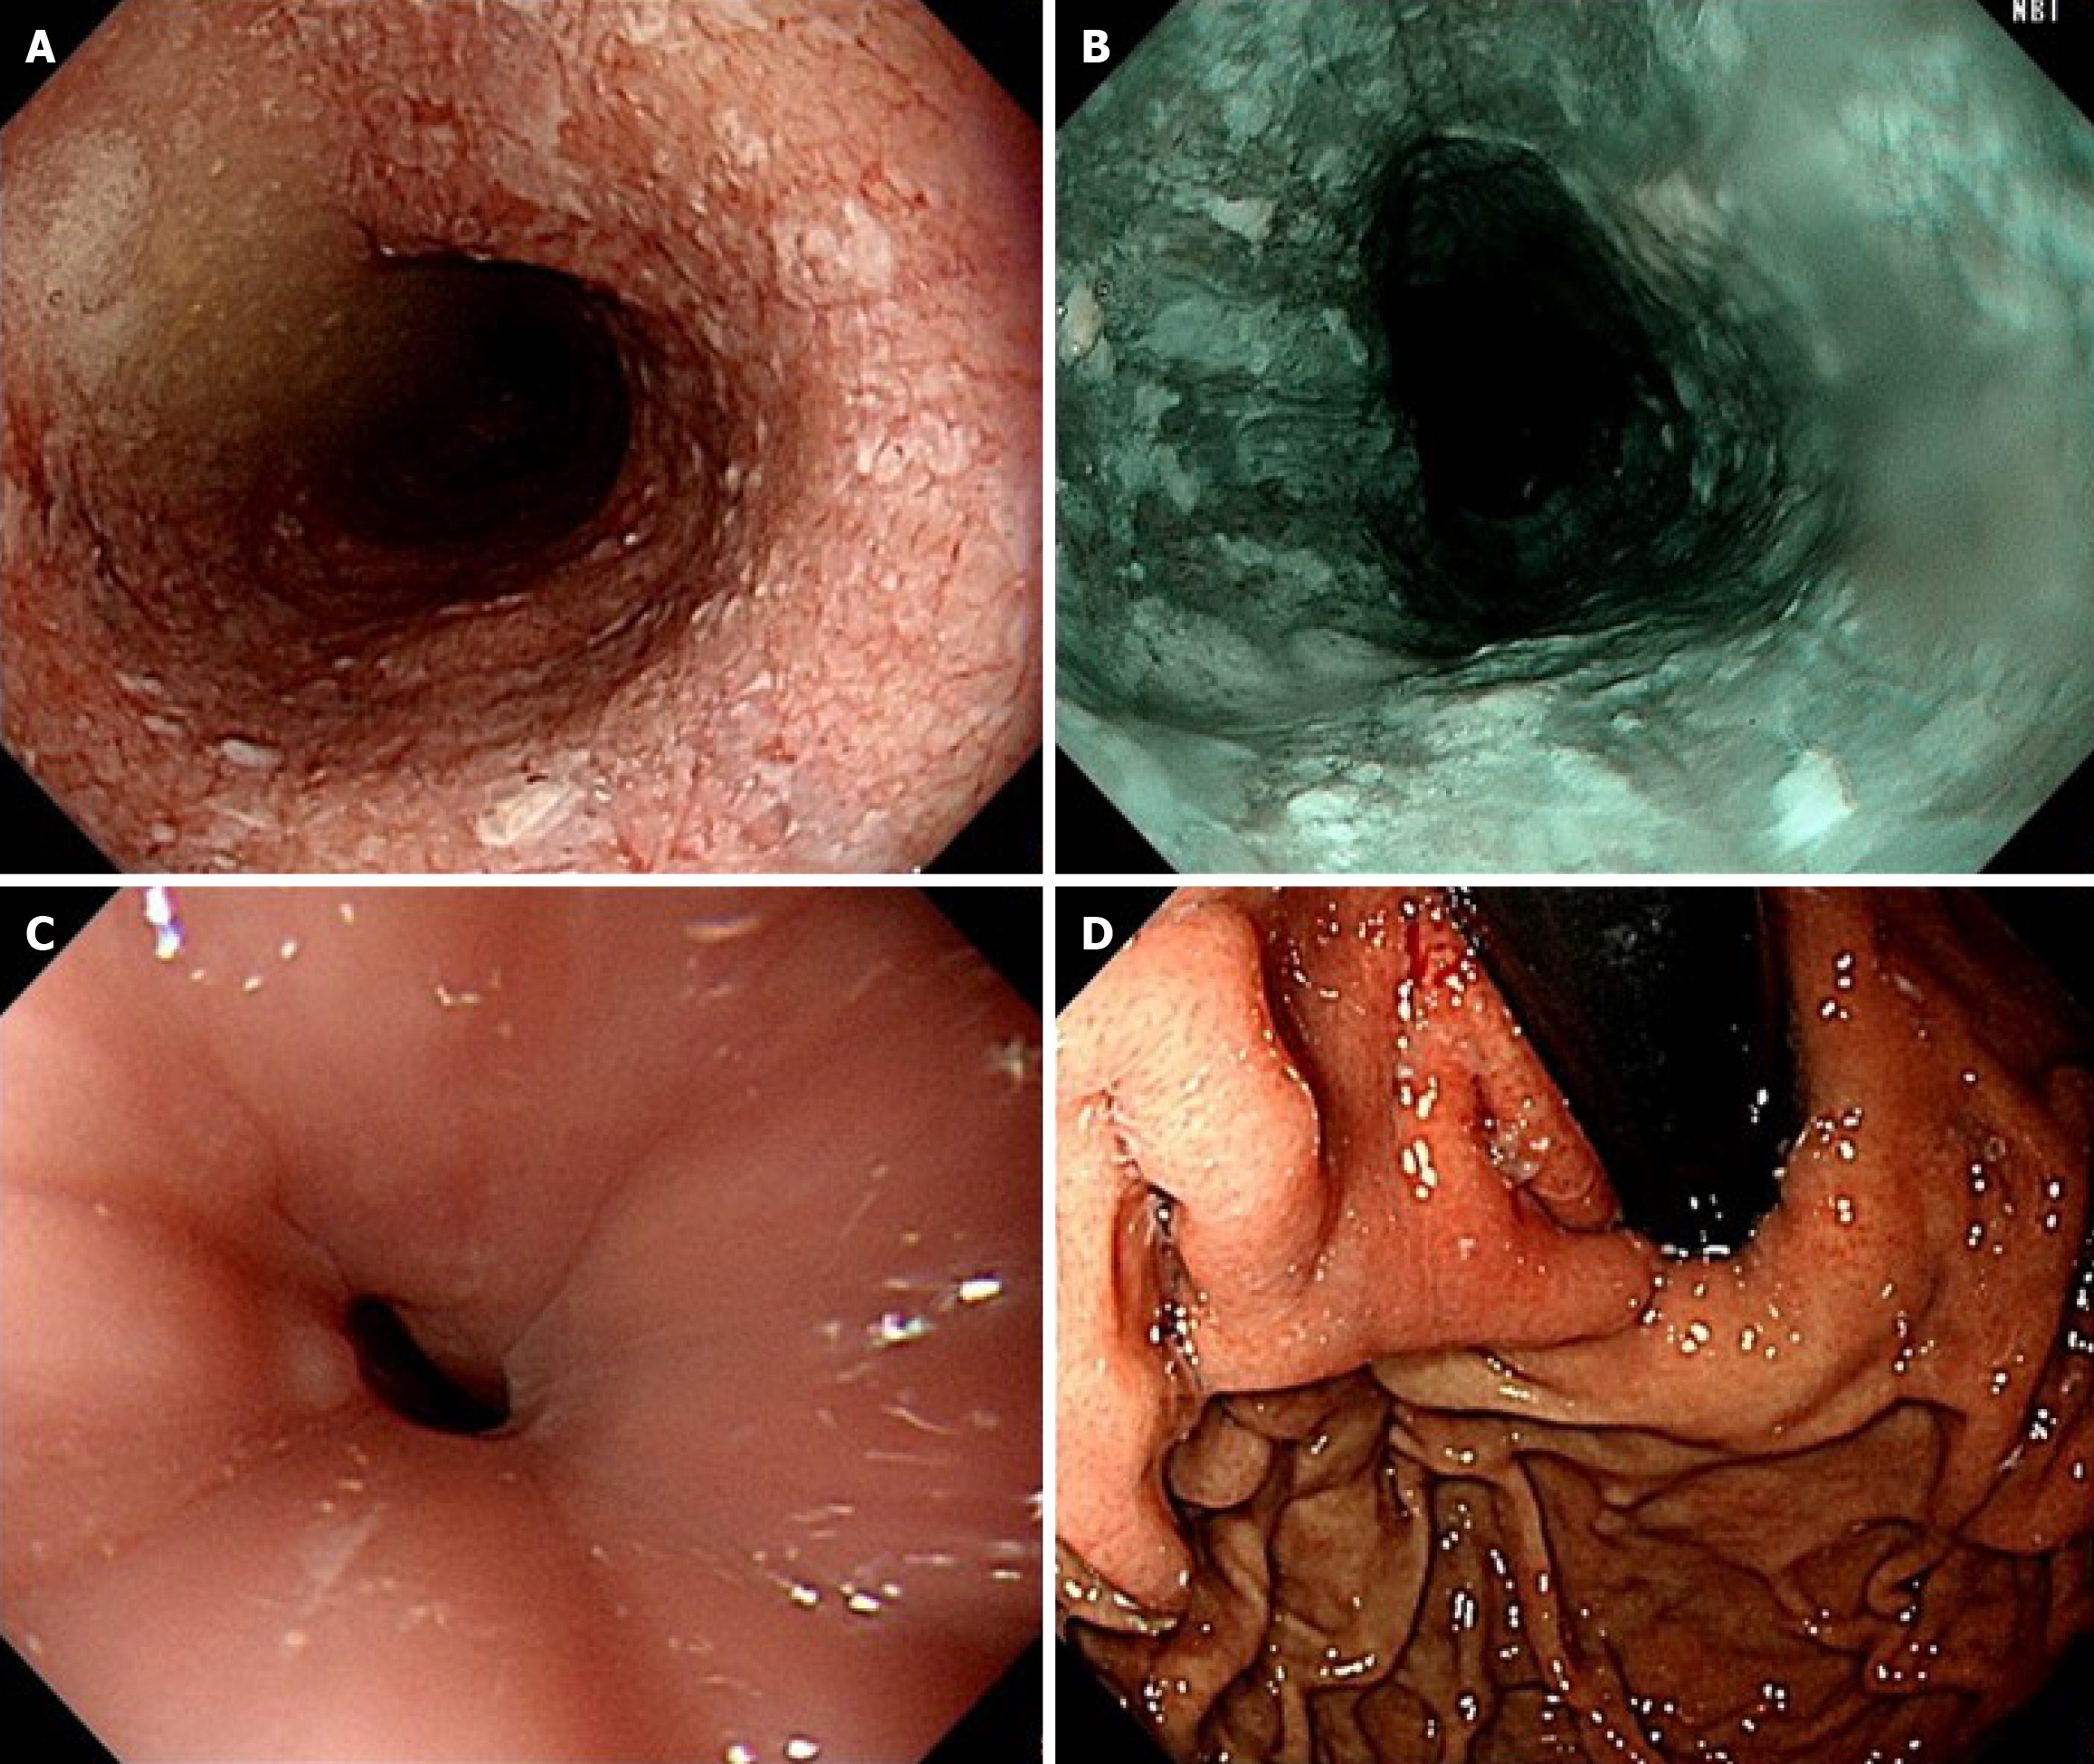
Figure 1 Esophagogastroduodenoscopy.
A: Food and fluid accumulation in the dilated esophagus; B: No abnormal mucosa under narrow-band imaging; C: Tight esophagogastric junction; D: The retroflexion examination revealed no tumors in the gastric cardia.
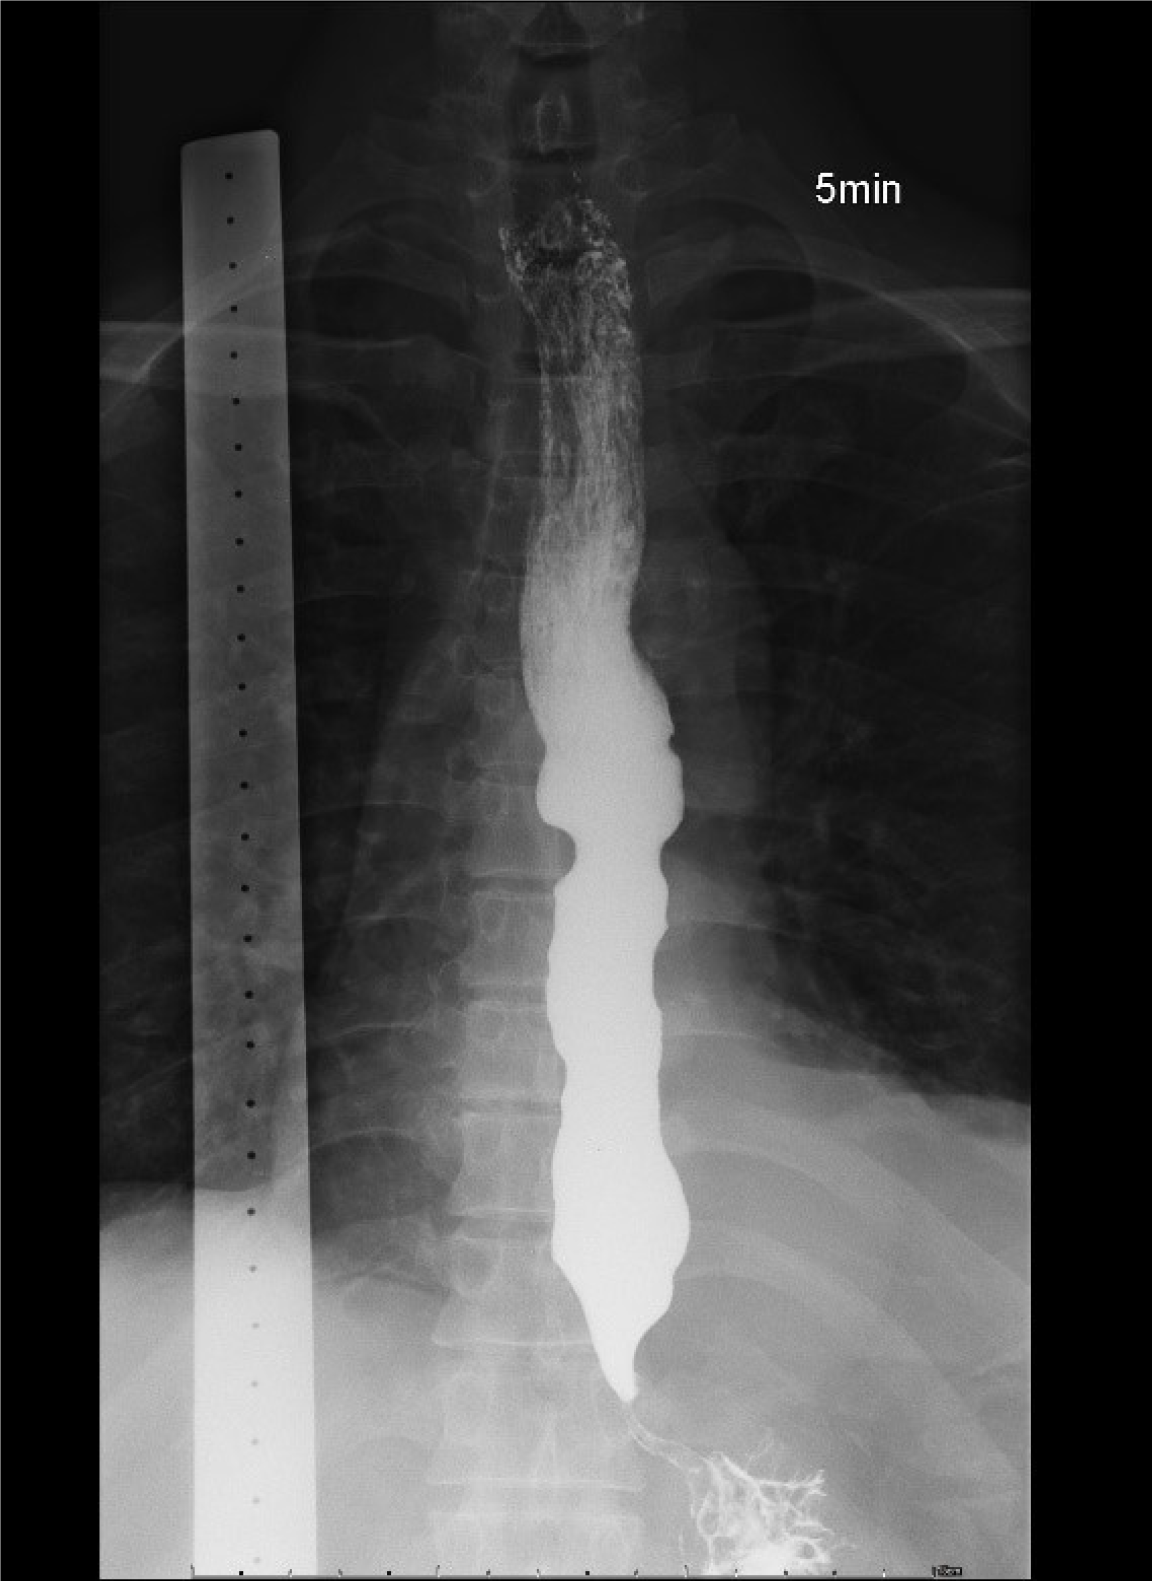
Figure 2 Esophagogram.
Barium retention in the esophagus with a bird beak appearance in the esophagogastric junction, suggestive of achalasia.
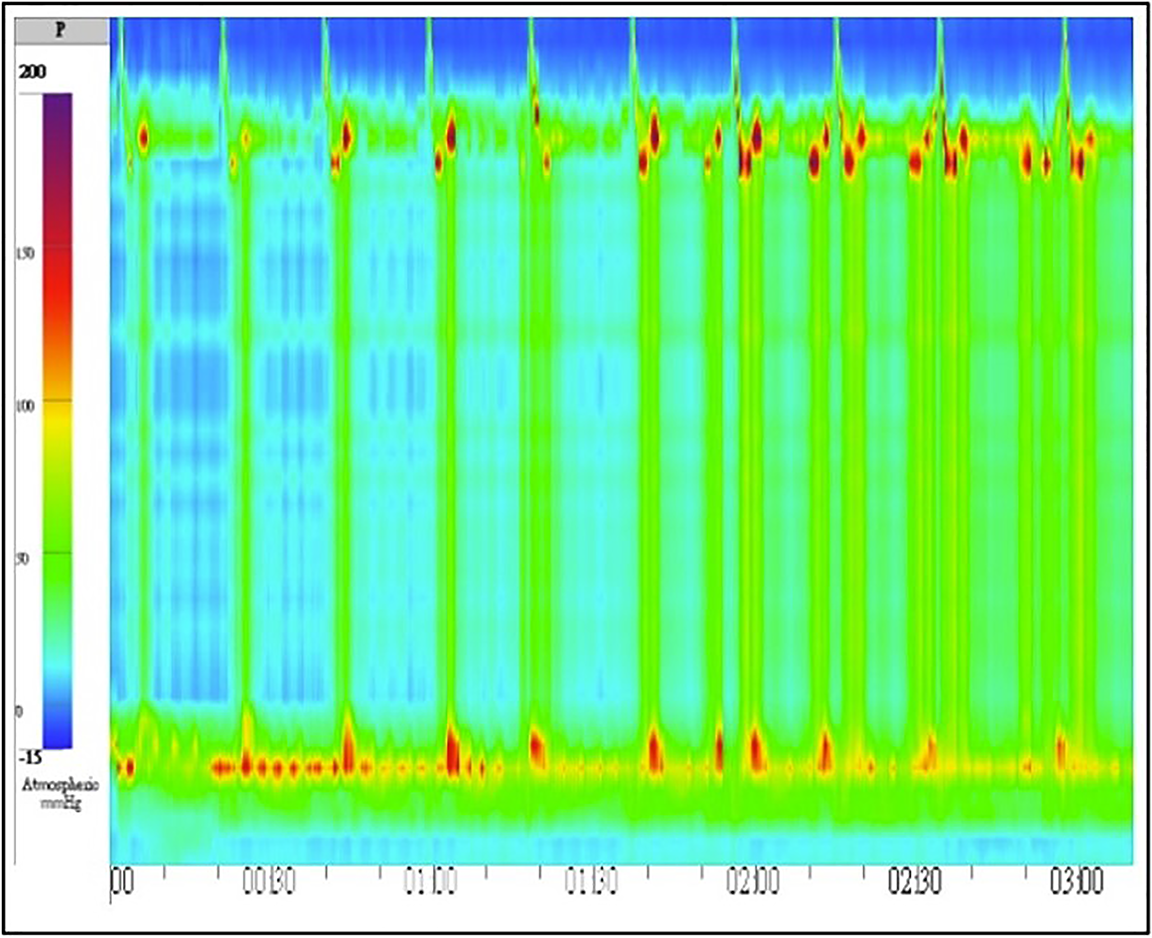
Figure 3 High-resolution manometry.
A median integrated relaxation pressure of 68.8 mmHg (normal: < 22 mmHg), with 100% failed peristalsis and panesophageal pressurization, consistent with type II achalasia.
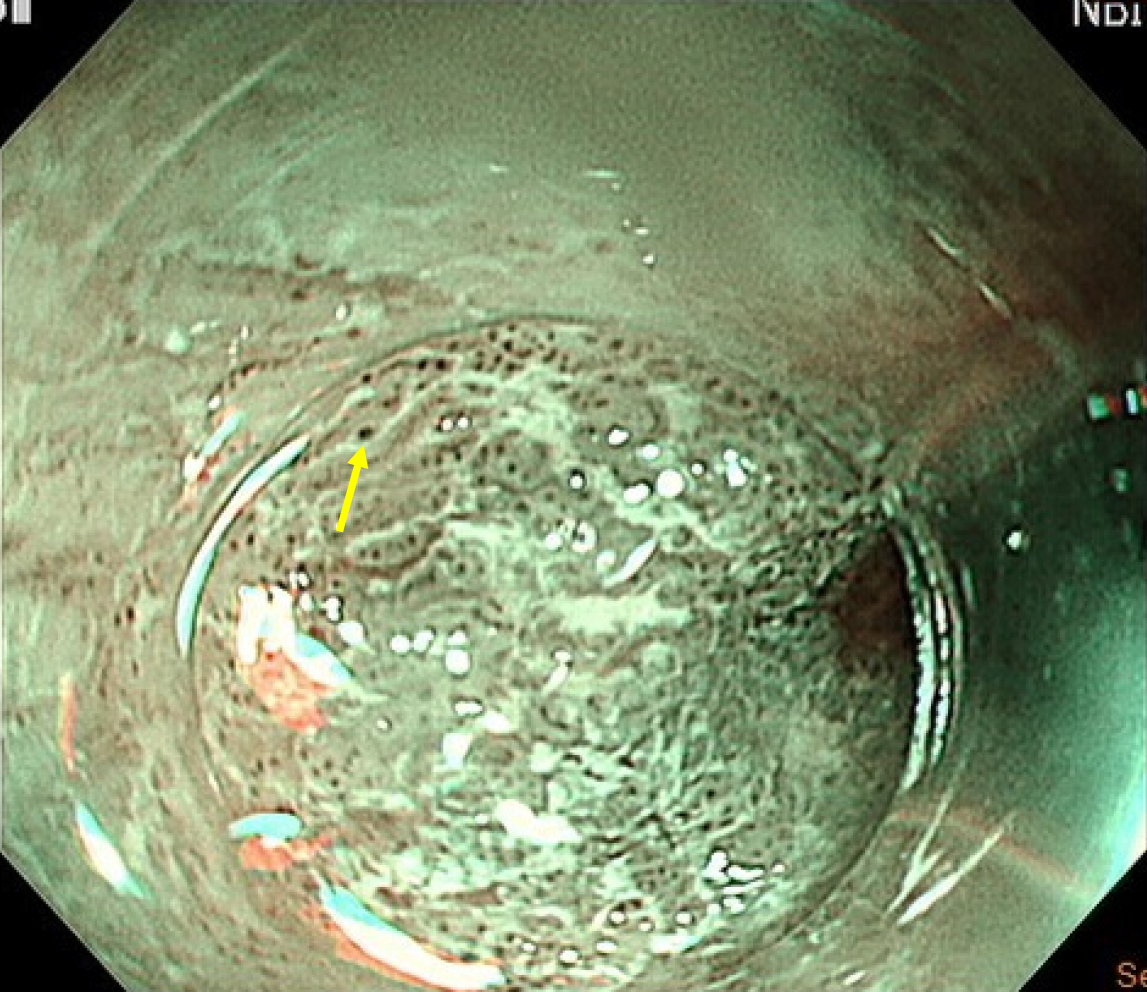
Figure 4 Magnifying endoscopy with narrow-band imaging.
Dilated microvascular pattern (arrow) in the mucosa in the mucosa, suggestive of neoplastic change.
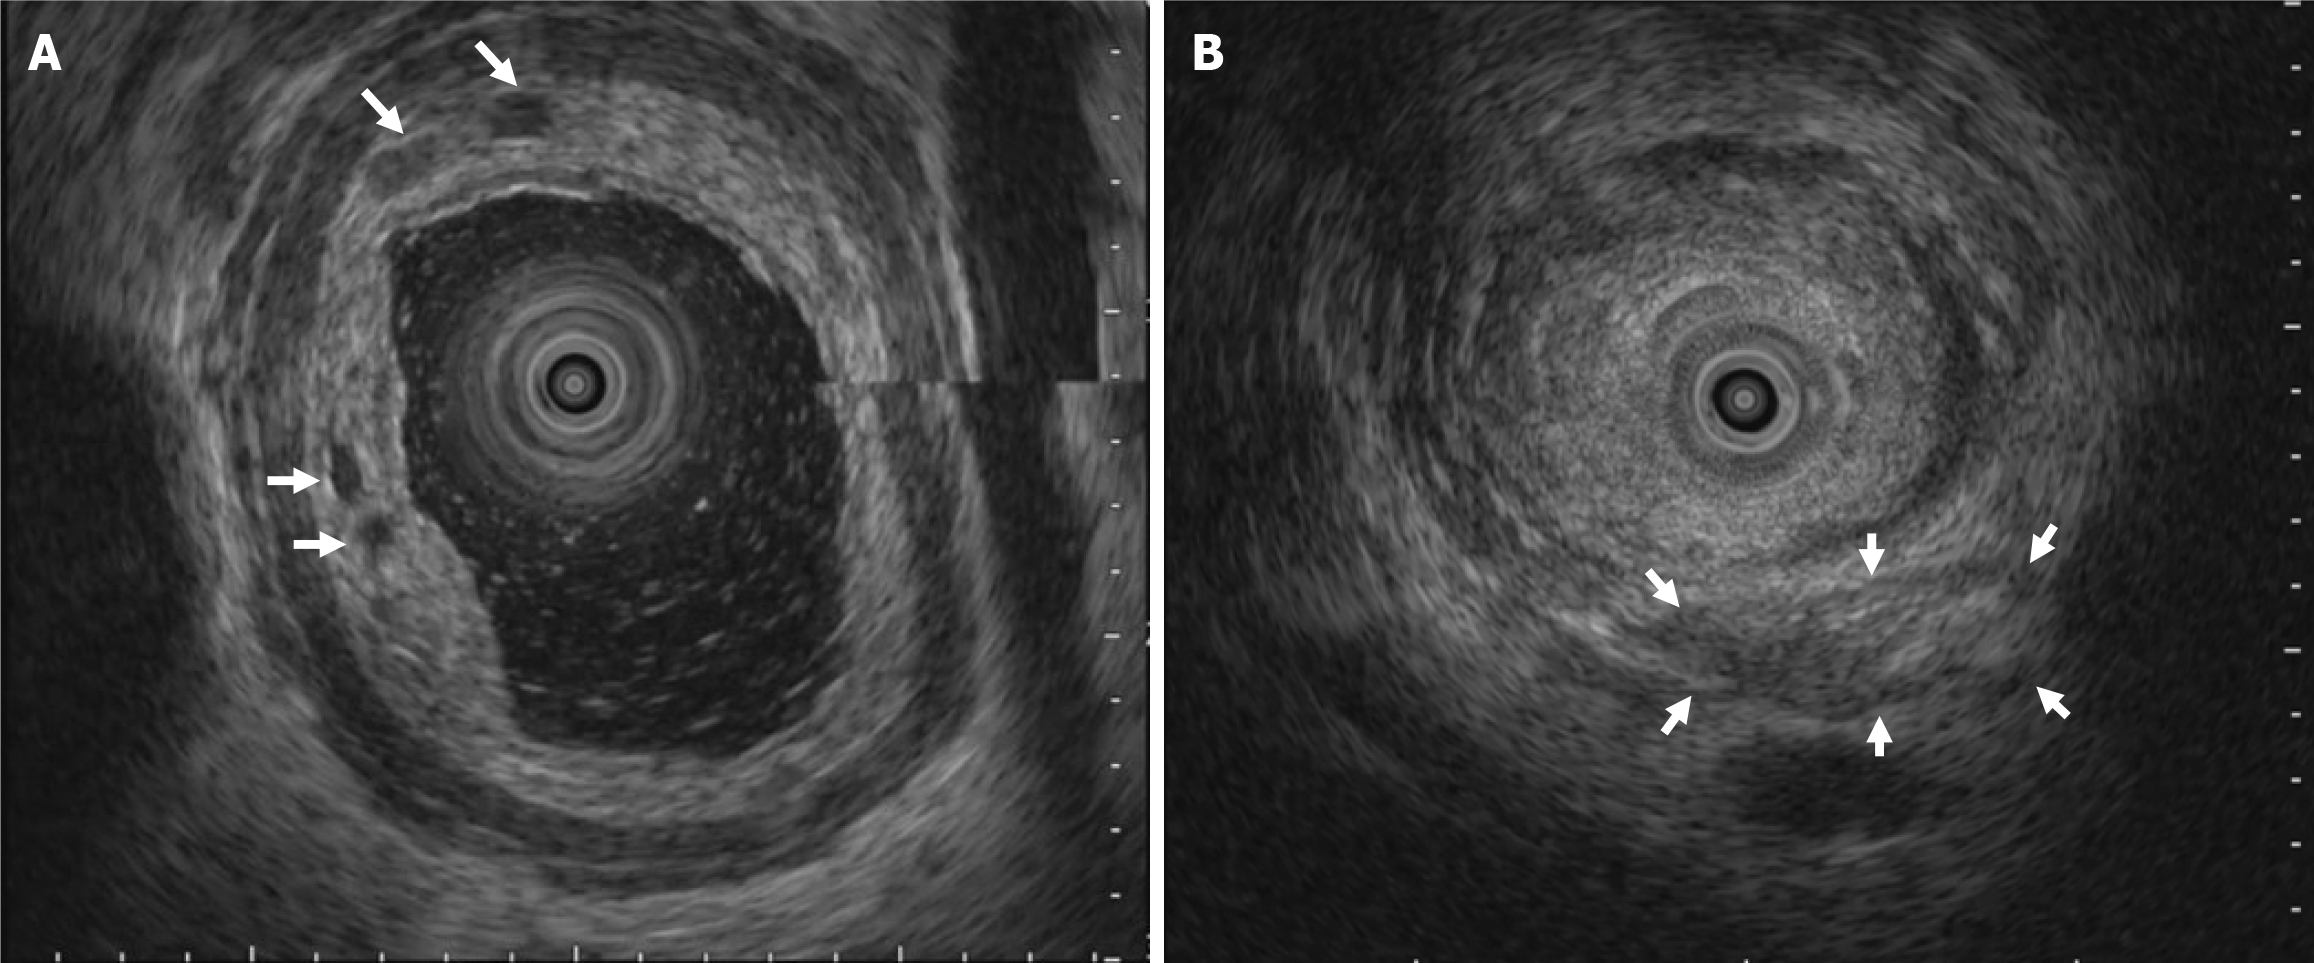
Figure 5 Endoscopic ultrasound.
A: Multiple hypoechoic foci (arrows) in the submucosal layer; B: The tumor infiltrated the muscularis propria (arrows) at the esophagogastric junction, which likely caused the dysphagia.
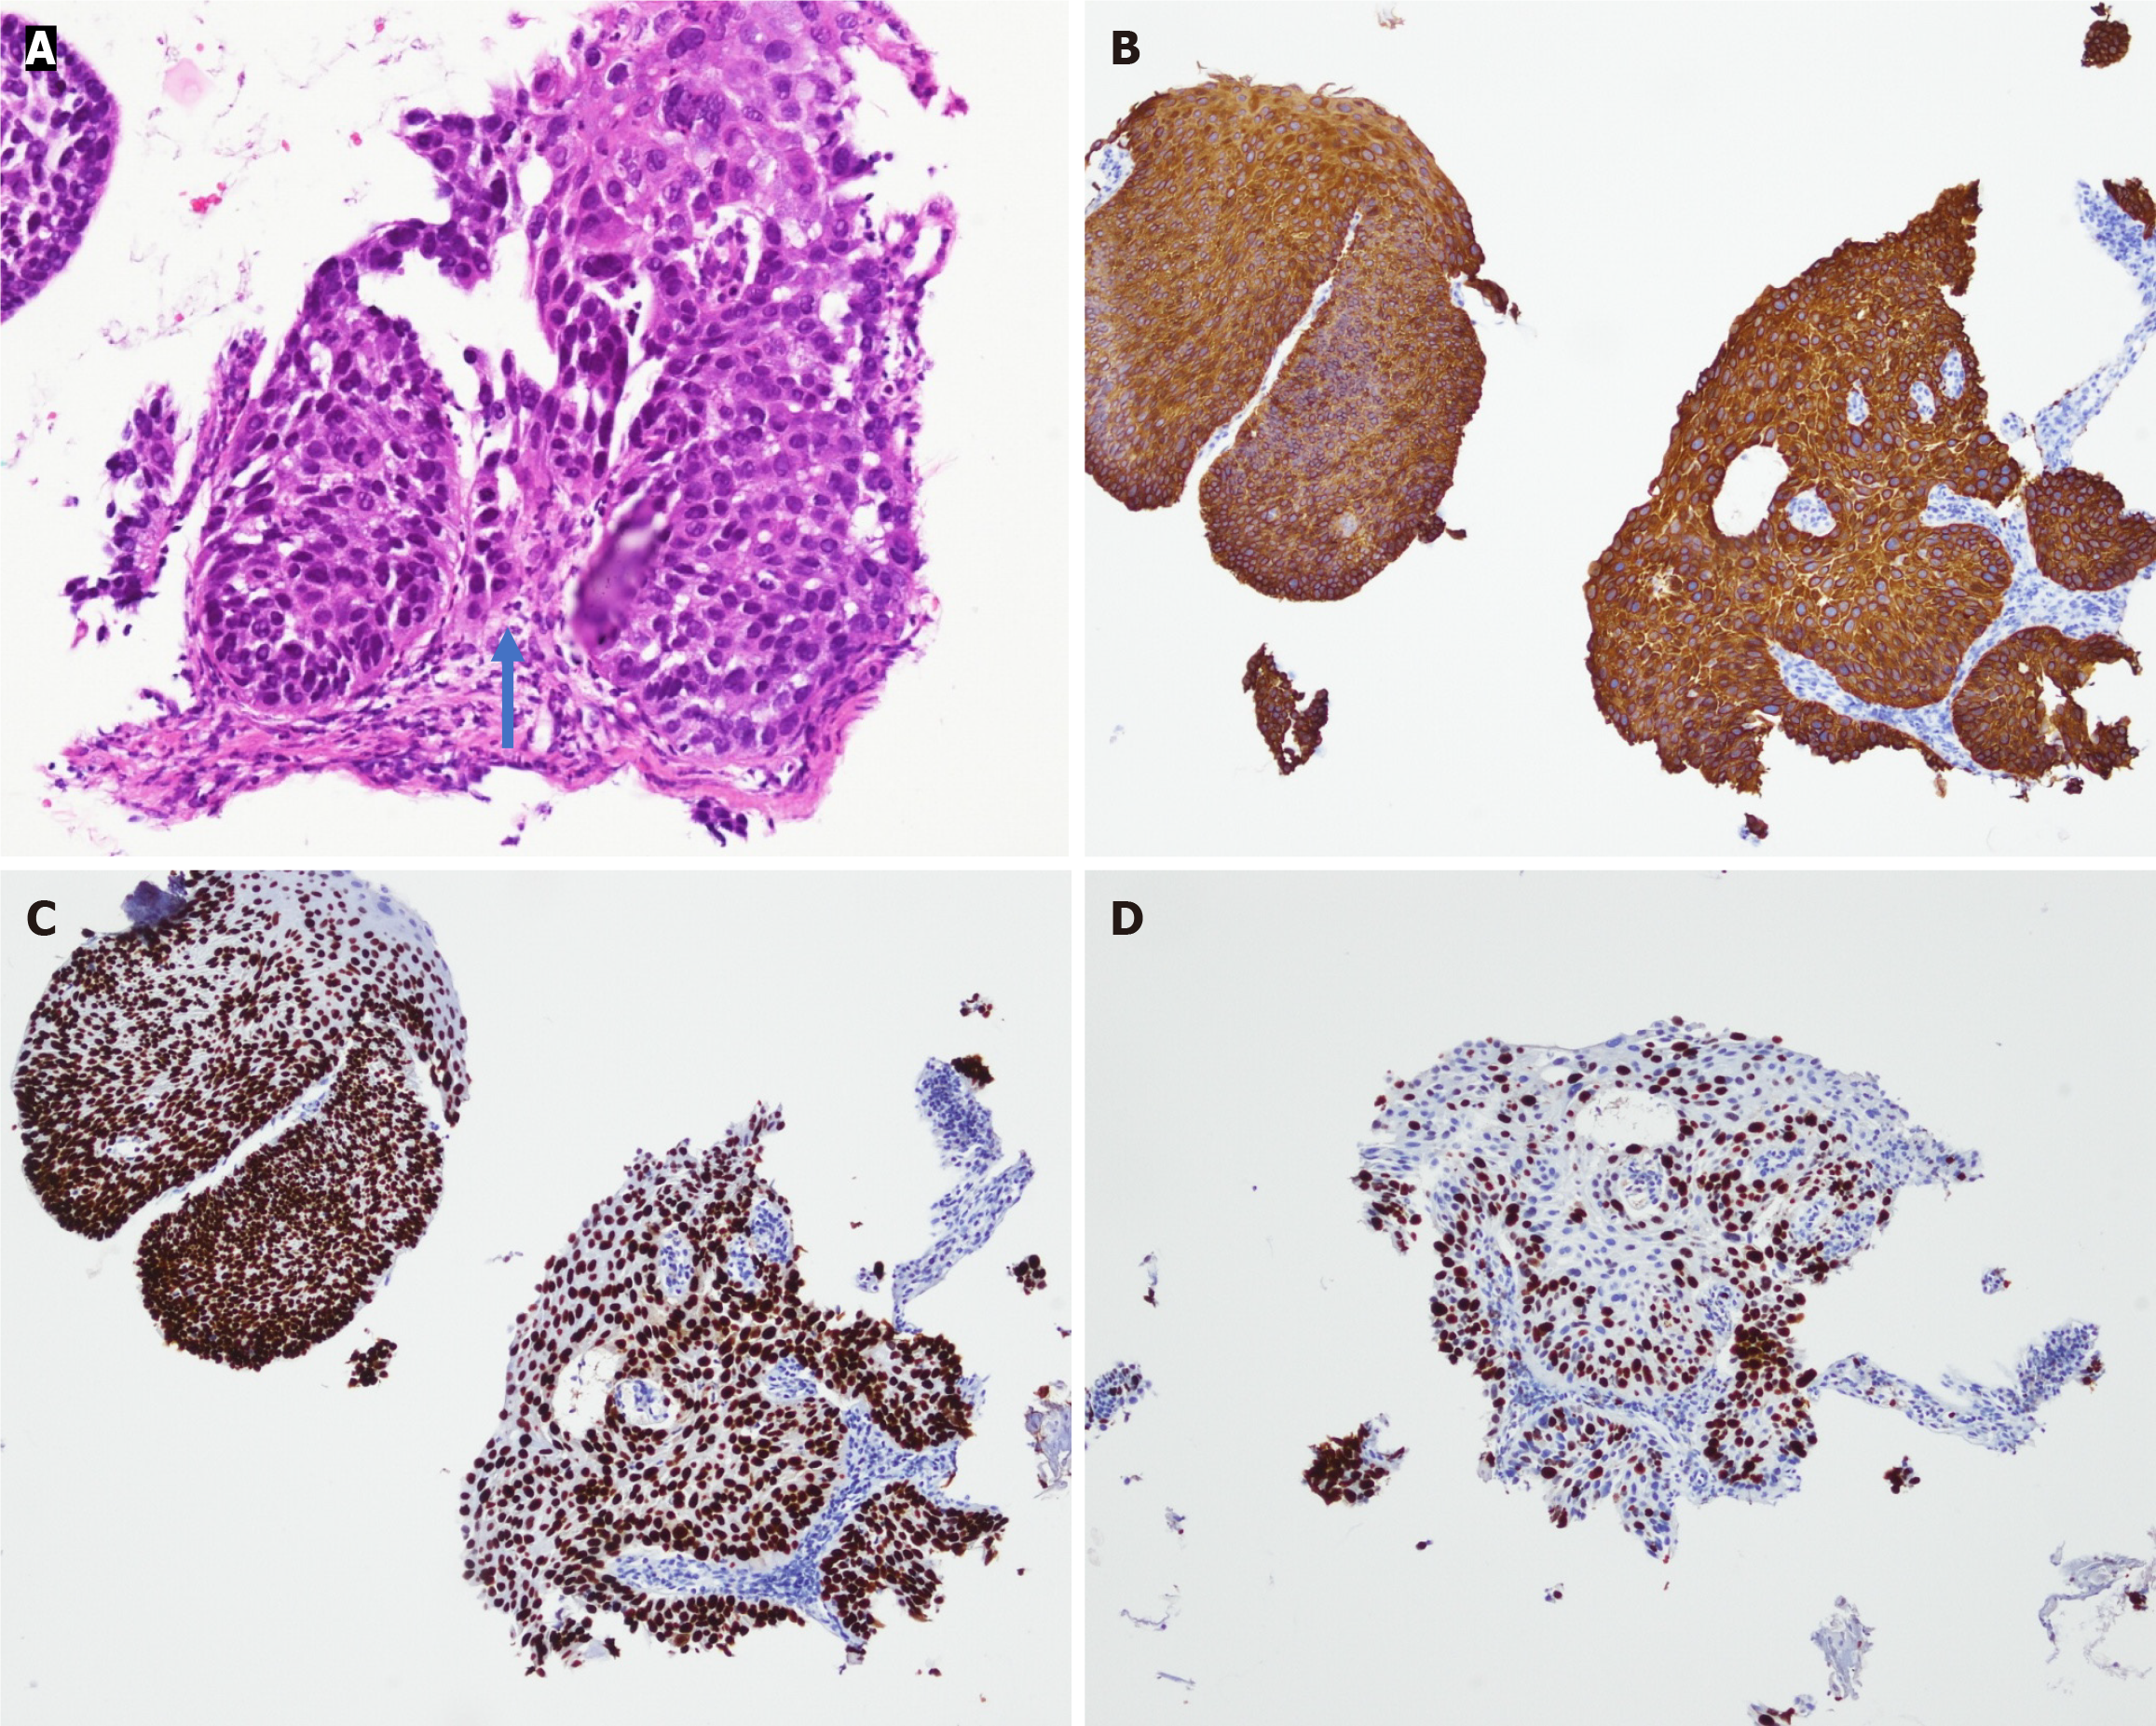
Figure 6 Pathology.
A: 200 ×, Hematoxylin and eosin stain. Diffuse squamous cell carcinoma (SCC) with architectural alteration and focal invasion (blue arrow); B: 100 × CK5/6 stain. Deeper section shows SCC in situ (left) and SCC with desmoplastic stroma (right); C: 100 × p63 stain; D: 100 × Ki-67 index = 65.9%. Indicating high mitotic activity.
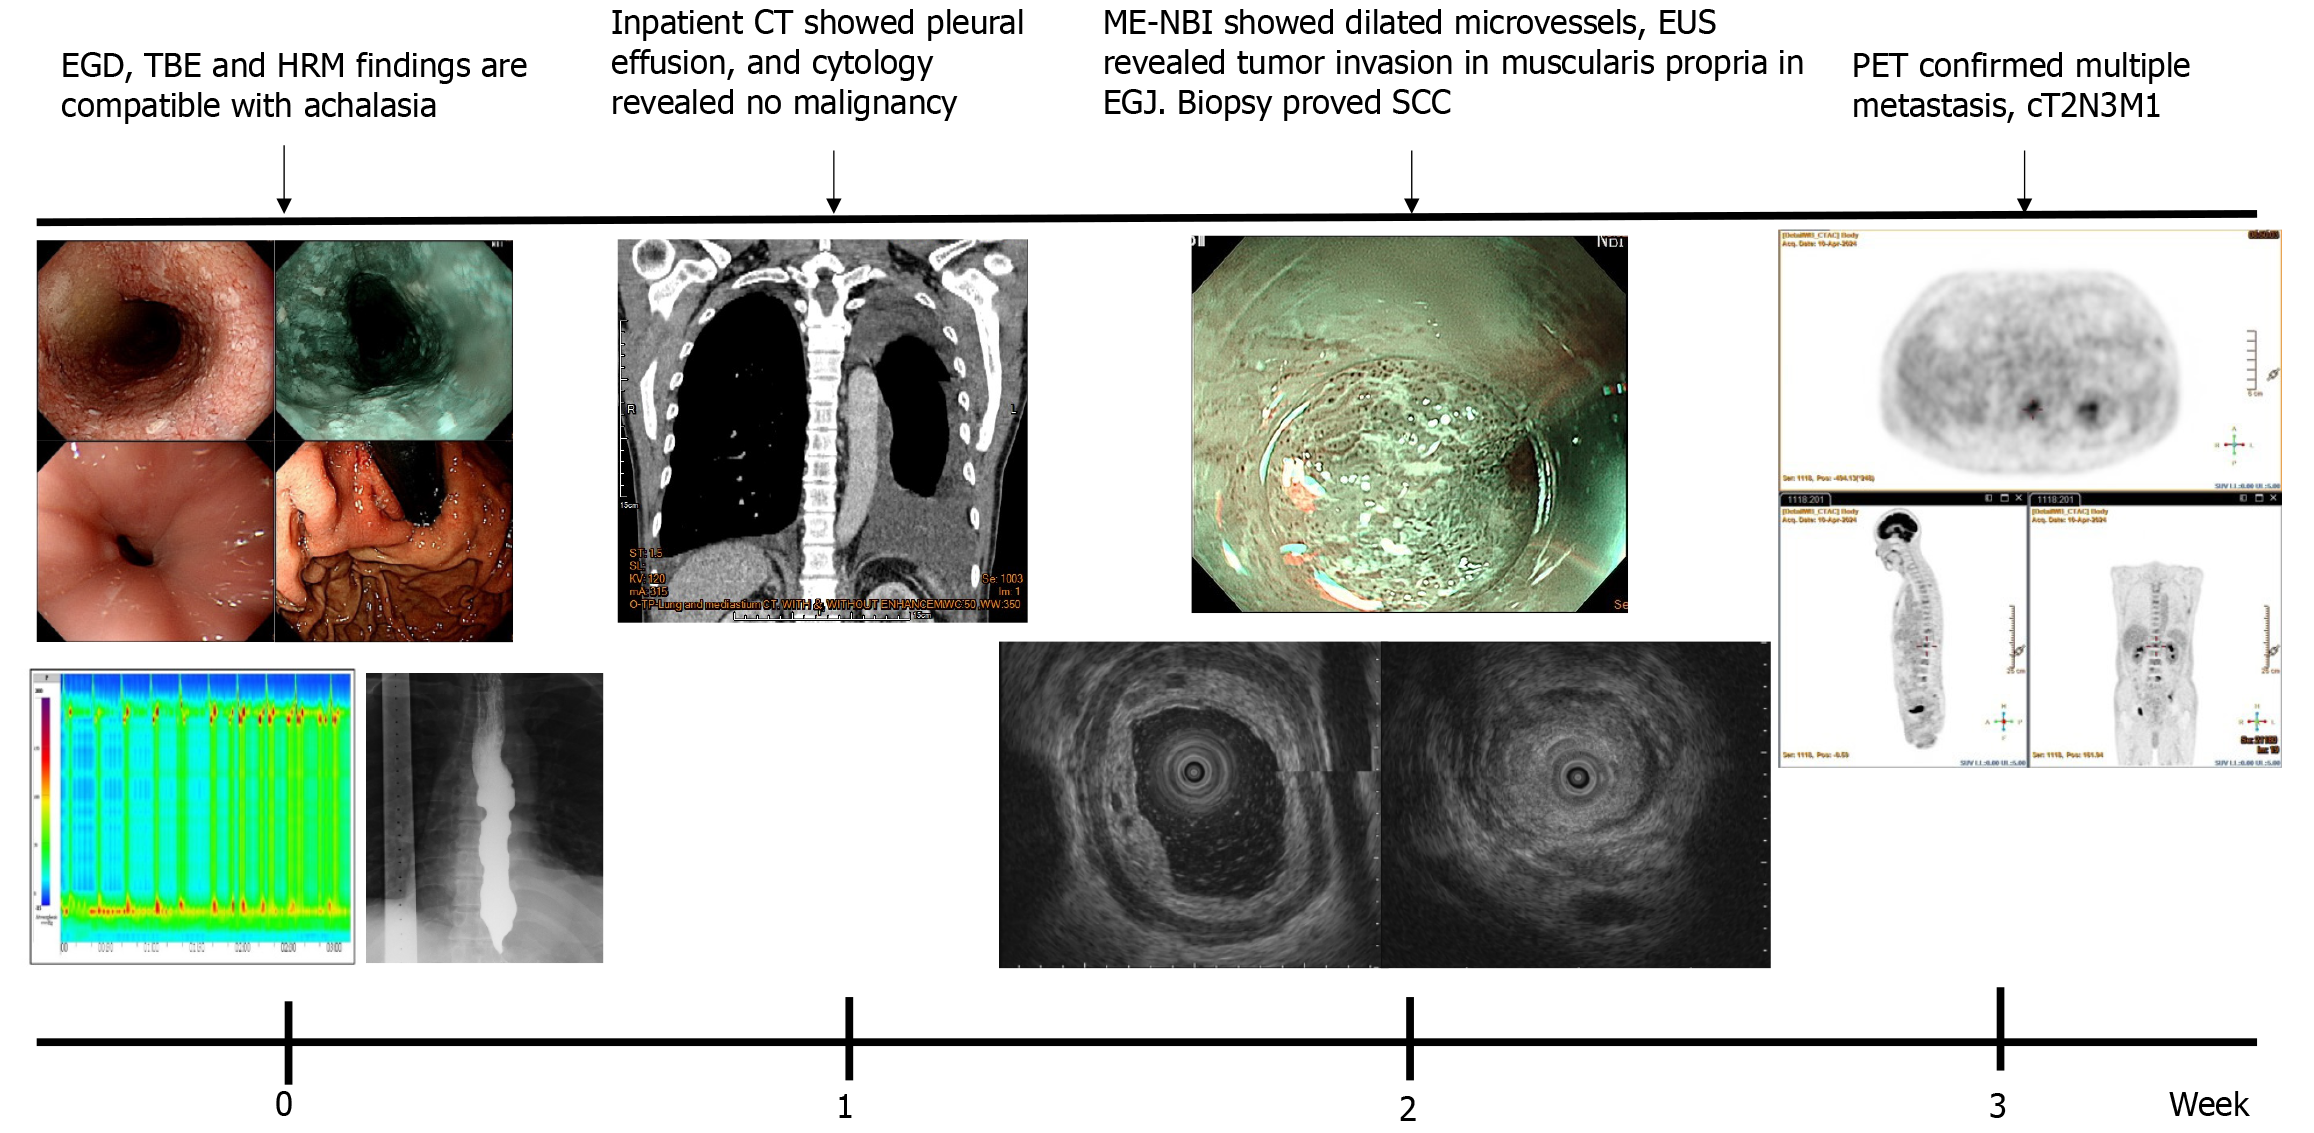
Figure 7 Summary of the clinical course of this case.
EGD: Esophagogastroduodenoscopy; TBE: Timed barium esophagogram; HRM: High resolution manometry; CT: Computed tomography; ME-NBI: Magnifying narrow band imaging; EUS: Endoscopic ultrasound; EGJ: Esophagogastric junction; SCC: Squamous cell carcinoma; PET: Positron emission tomography.
- Citation: He YS, Lee CY, Shieh TY. Pseudoachalasia as first manifestation of a diffusely infiltrative esophageal squamous cell carcinoma: A case report. World J Gastrointest Oncol 2025; 17(7): 108162
- URL: https://www.wjgnet.com/1948-5204/full/v17/i7/108162.htm
- DOI: https://dx.doi.org/10.4251/wjgo.v17.i7.108162


