Copyright
©The Author(s) 2025.
World J Gastrointest Oncol. Jul 15, 2025; 17(7): 104402
Published online Jul 15, 2025. doi: 10.4251/wjgo.v17.i7.104402
Published online Jul 15, 2025. doi: 10.4251/wjgo.v17.i7.104402
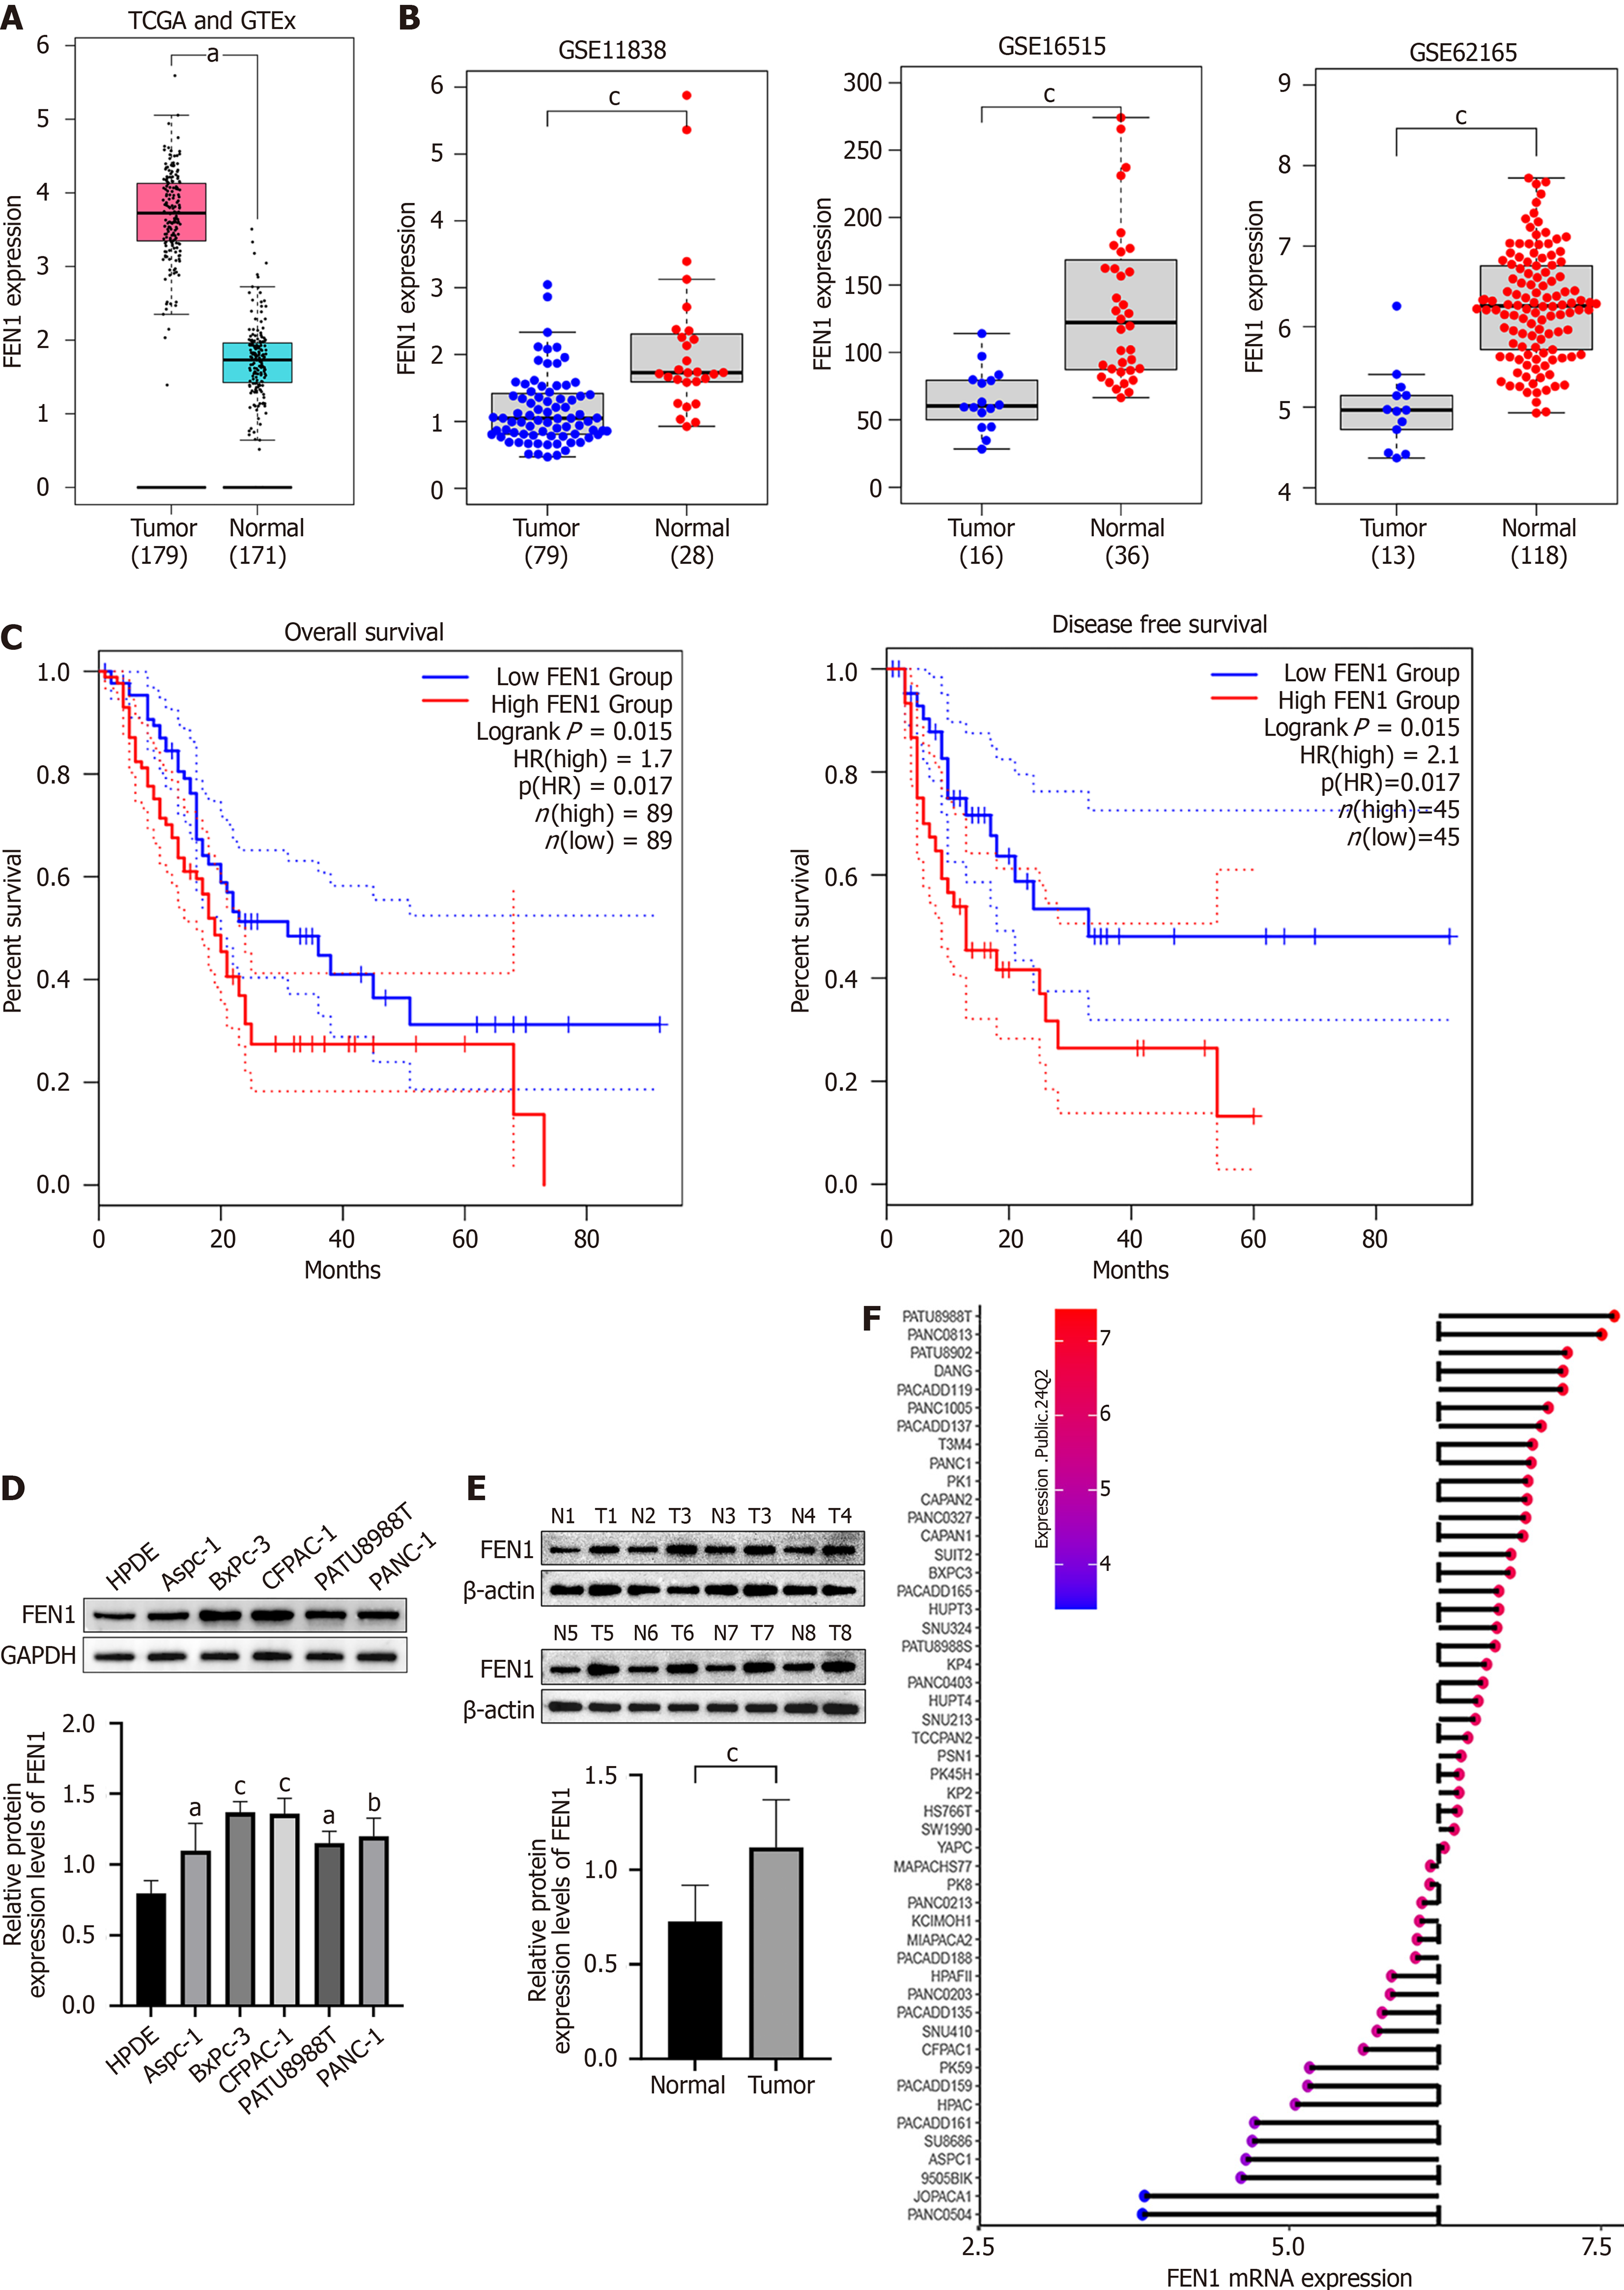
Figure 1 Elevated flap endonuclease-1 expression in pancreatic cancer correlates with poor prognosis.
A: Analysis of flap endonuclease-1 (FEN1) mRNA expression in pancreatic cancer (PC) tissues derived from The Cancer Genome Atlas and Genotype-Tissue Expression databases; B: Box plots depicting FEN1 expression across six independent PC microarray datasets; C: Correlation analysis between FEN1 expression levels and overall survival and disease-free survival in PC patients, based on Gene Expression Profiling Interactive Analysis database; D: Western blot analysis of FEN1 protein expression in human pancreatic cell line cells and five PC cell lines; E: Comparative analysis of FEN1 protein expression in eight paired PC tissues and adjacent non-tumor tissues; F: Analysis of FEN1 expression patterns across PC cell lines from the Cancer Cell Line Encyclopedia database. aP < 0.05, bP < 0.01, cP < 0.001.
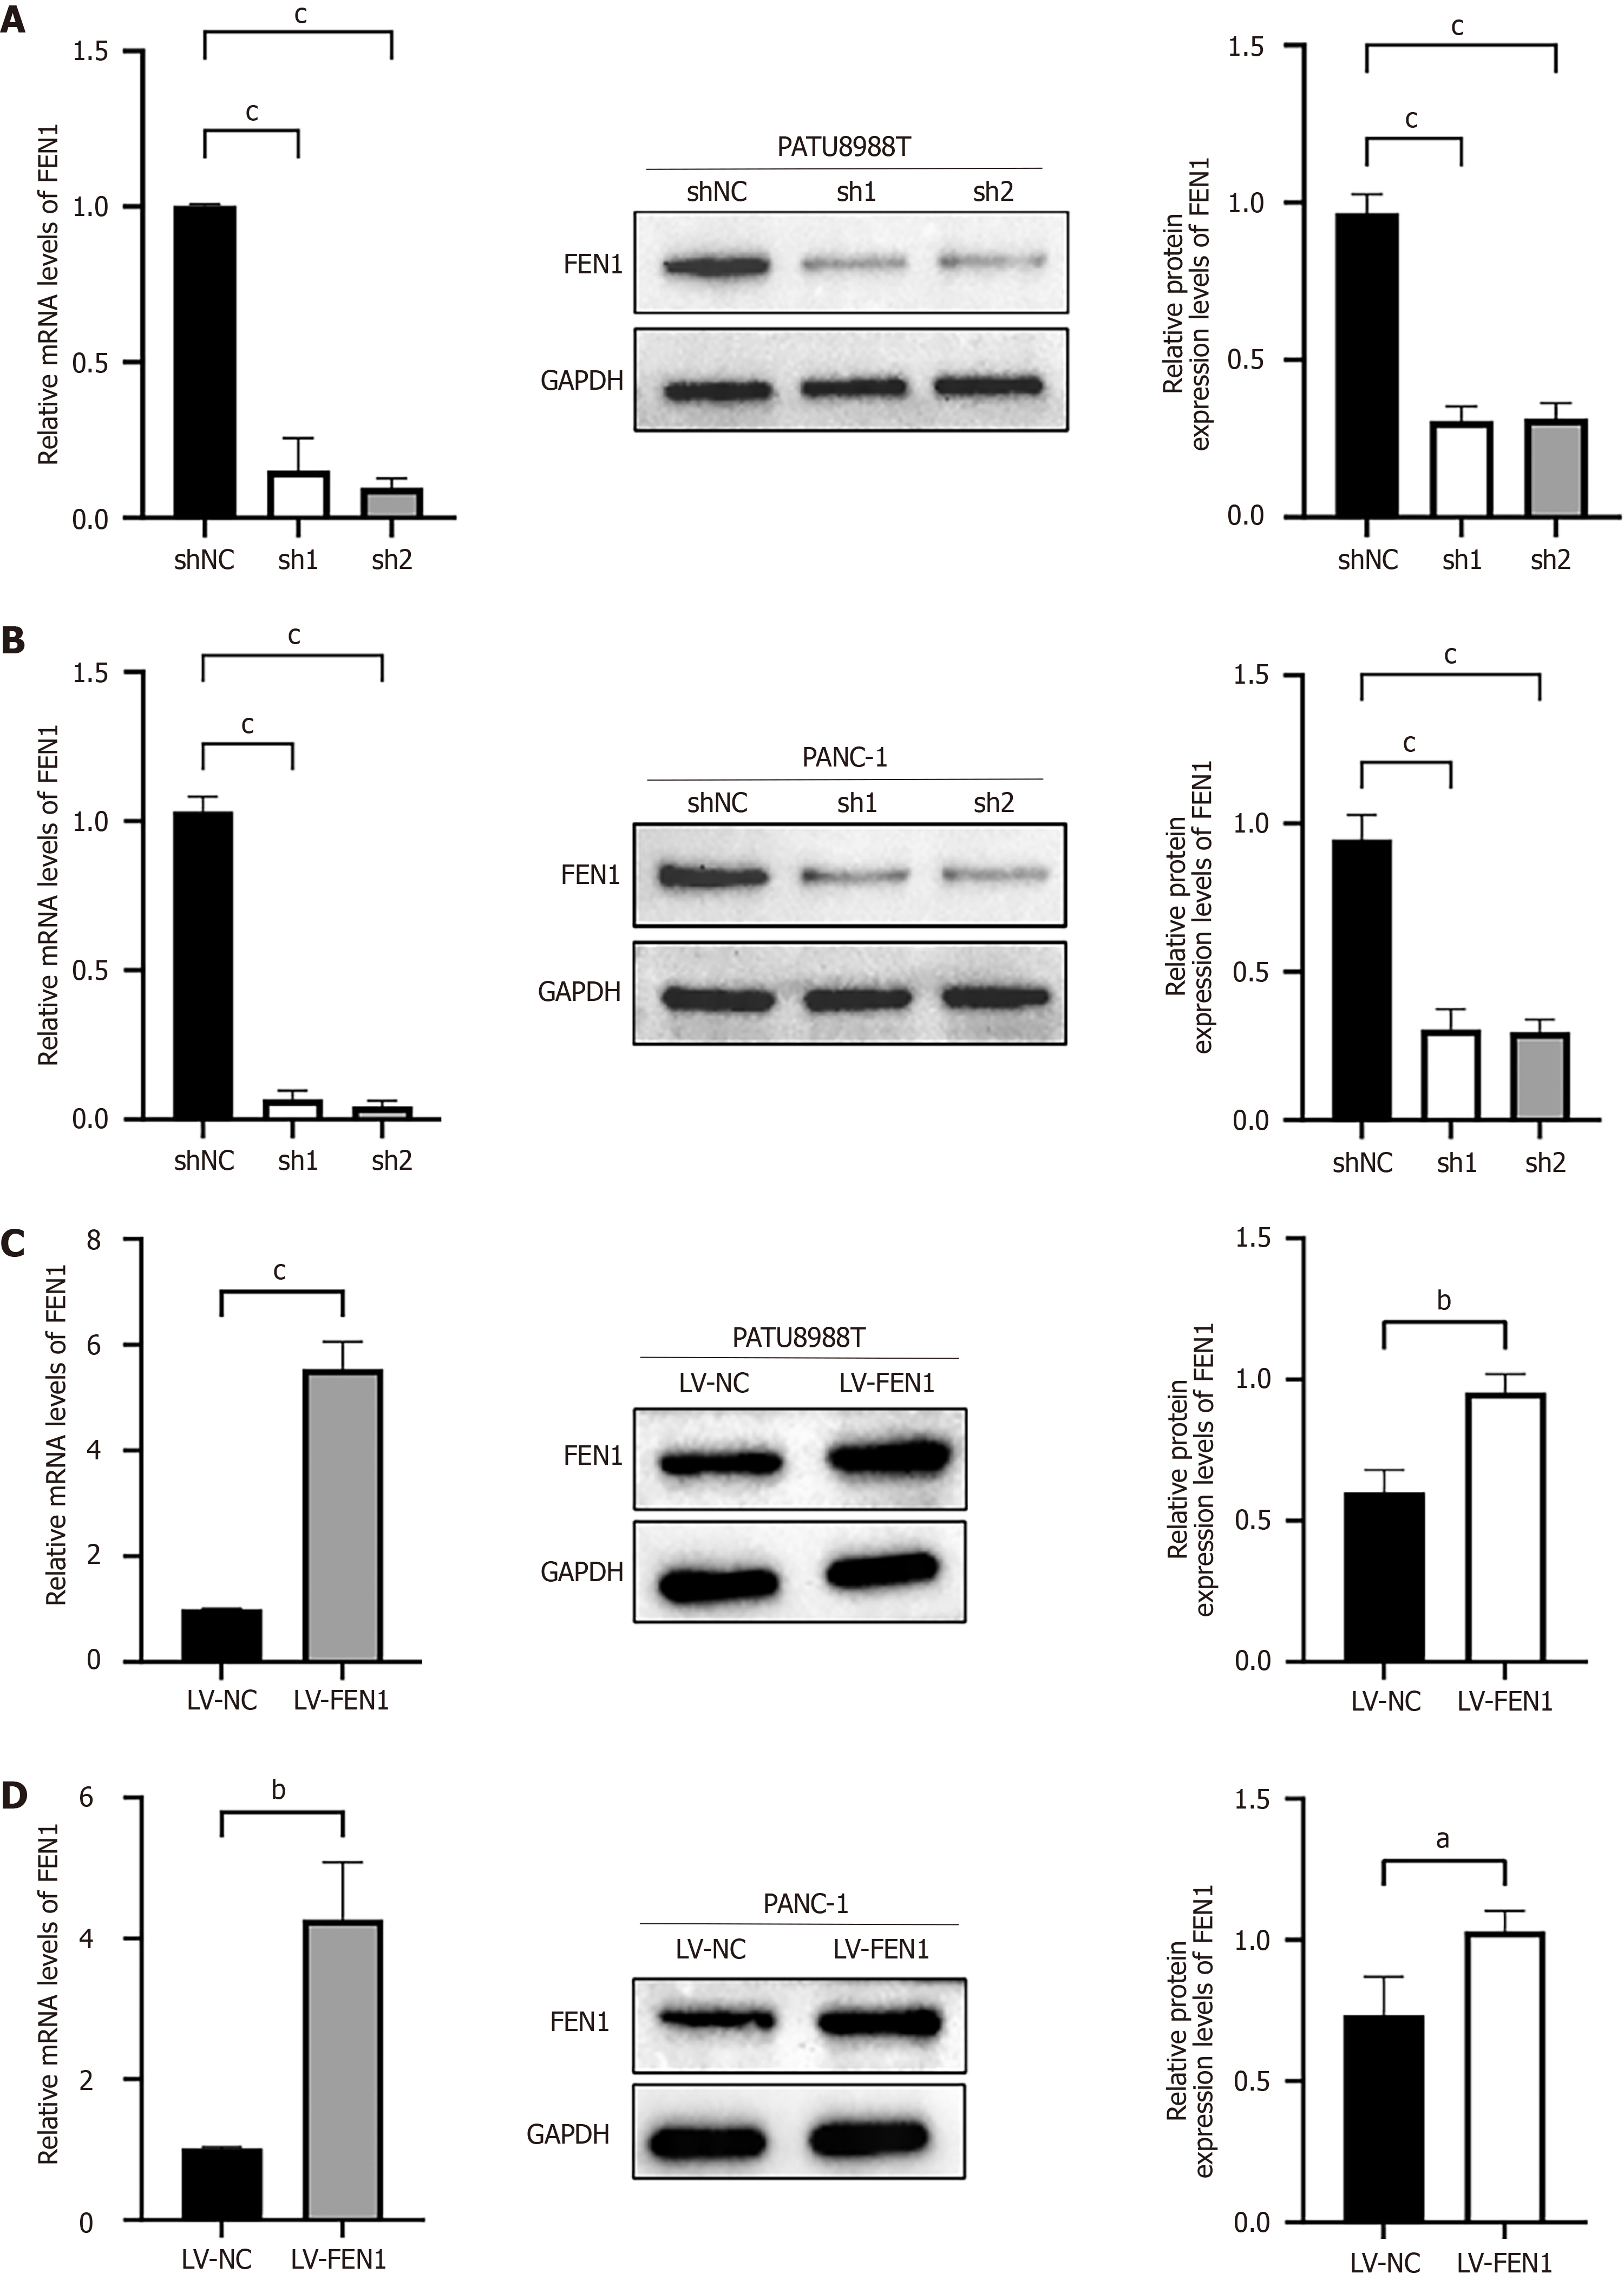
Figure 2 Flap endonuclease-1 knockdown and overexpression in pancreatic cancer cell lines.
A and B: Validation of flap endonuclease-1 (FEN1) knockdown efficiency in PATU8988T and PANC-1 cells using two independent shRNA constructs, as assessed by reverse transcription-quantitative PCR (RT-qPCR) and western blot analyses for mRNA and protein expression, respectively; C and D: Verification of FEN1 overexpression in PATU8988T and PANC-1 cells, evaluated by RT-qPCR for mRNA levels and western blot analysis for protein expression. aP < 0.05, bP < 0.01, cP < 0.001.
Figure 3 Flap endonuclease-1 modulates proliferation, migration, and invasion in pancreatic cancer cells.
A and B: Cell proliferation analysis using EdU incorporation assay in PATU8988T and PANC-1 cells following flap endonuclease-1 (FEN1) knockdown. Scale bar = 100 μm; C: Colony formation assays evaluating the proliferative capacity of PATU8988T and PANC-1 cells following FEN1 knockdown; D and E: Assessment of proliferative potential by EdU incorporation assay in PATU8988T and PANC-1 cells following FEN1 overexpression. Scale bar = 100 μm; F: Colony formation assays evaluating the proliferative capacity of PATU8988T and PANC-1 cells following FEN1 overexpression; G and H: Transwell invasion and migration assays assessing the metastatic potential of PATU8988T and PANC-1 cells following FEN1 knockdown or overexpression. aP < 0.05, bP < 0.01, cP < 0.001.
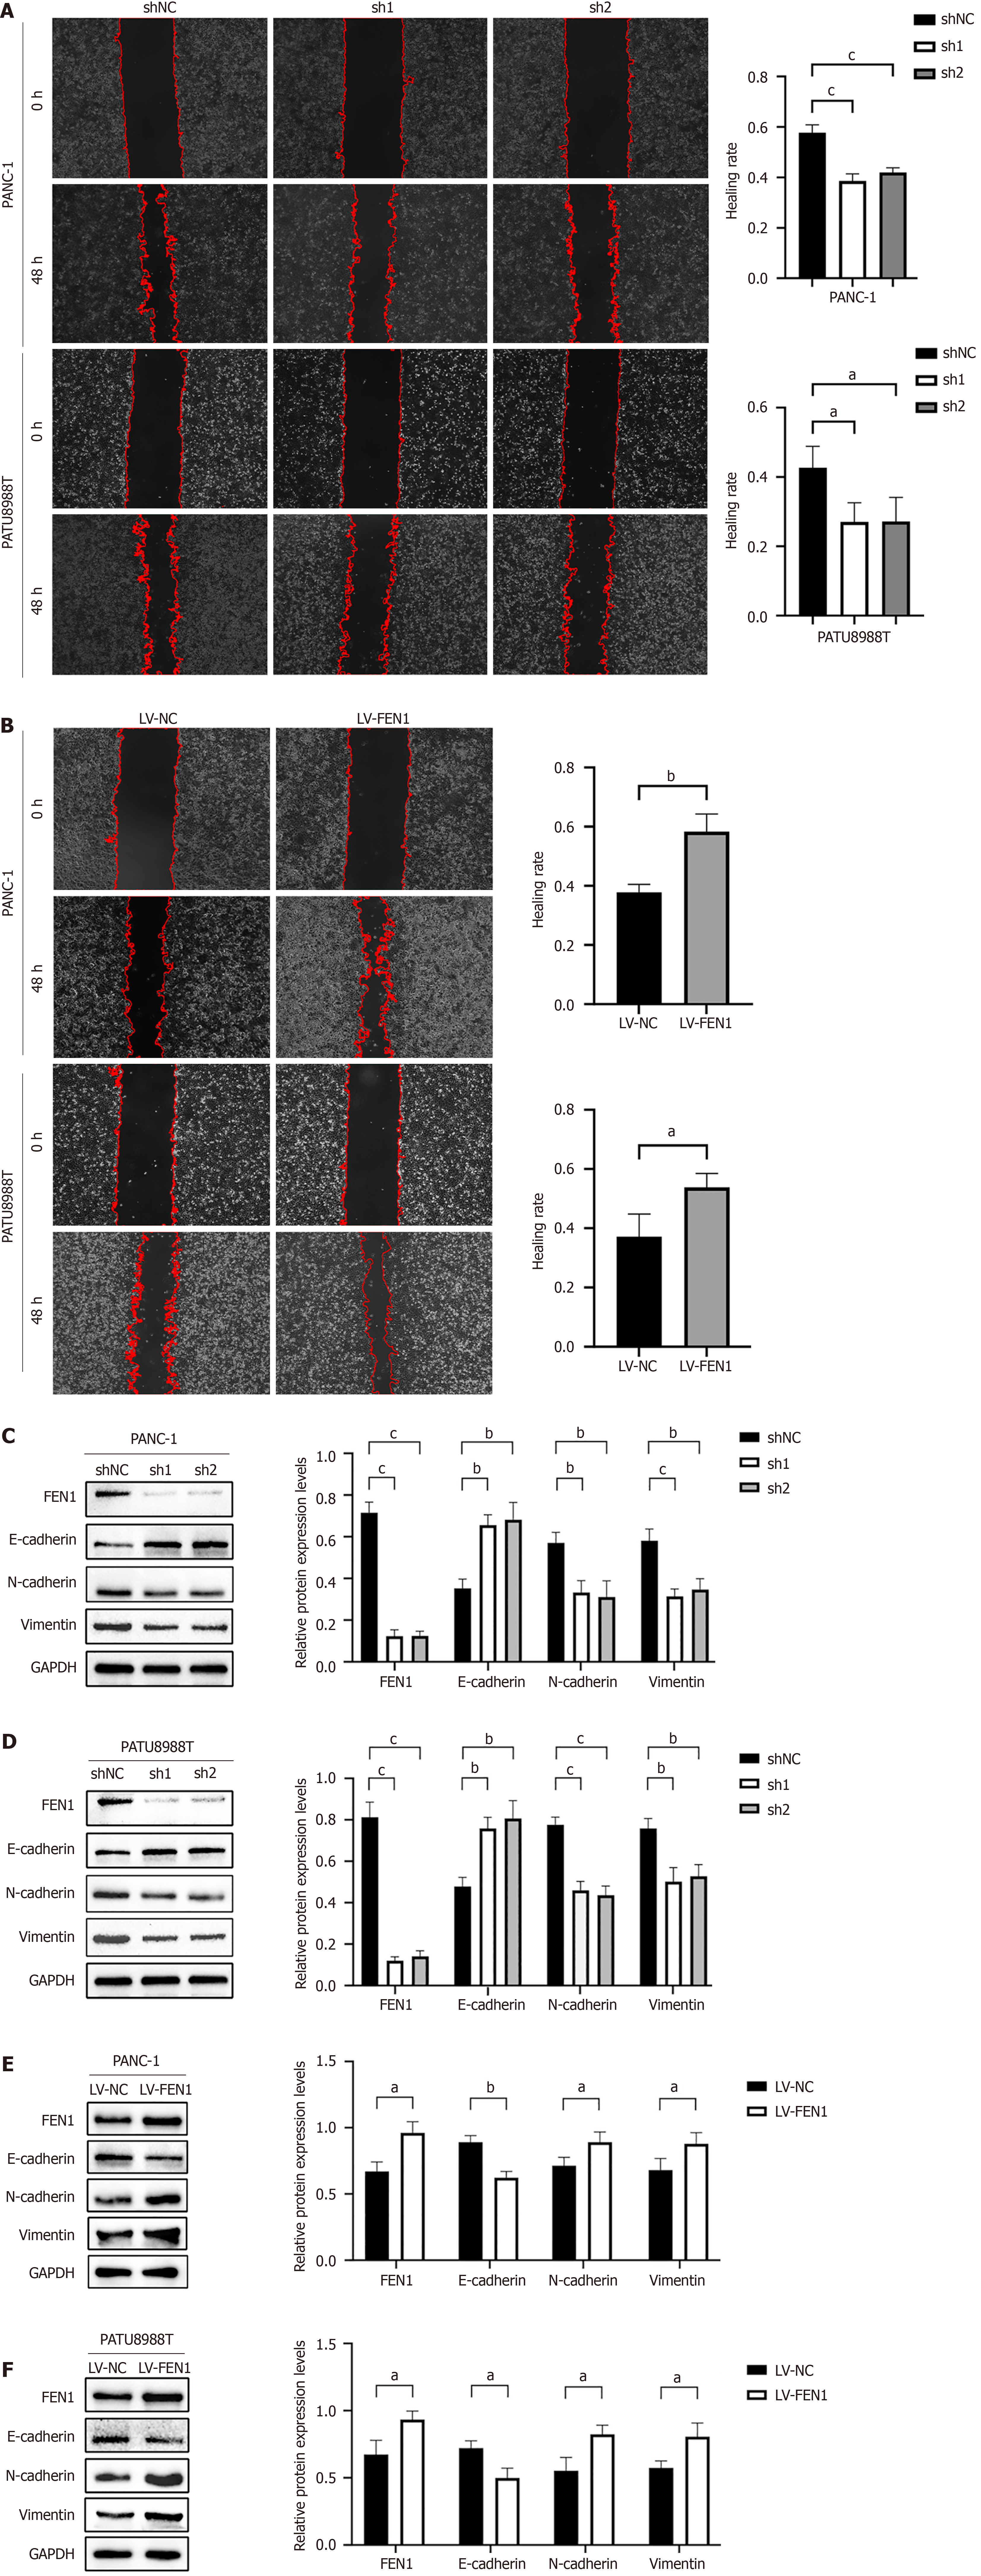
Figure 4 Flap endonuclease-1 regulates cell migration and expression of epithelial-mesenchymal transition-associated proteins in pancreatic cancer cells.
A and B: Wound healing assays measuring cell migration dynamics in PATU8988T and PANC-1 cells following flap endonuclease-1 (FEN1) knockdown or overexpression. Migration rates were quantified at specified time points; C-F: Western blot analysis of epithelial-mesenchymal transition markers, including E-cadherin, N-cadherin, and Vimentin, in PATU8988T and PANC-1 cells with FEN1 knockdown or overexpression. Protein expression levels were normalized to internal controls. aP < 0.05, bP < 0.01, cP < 0.001.
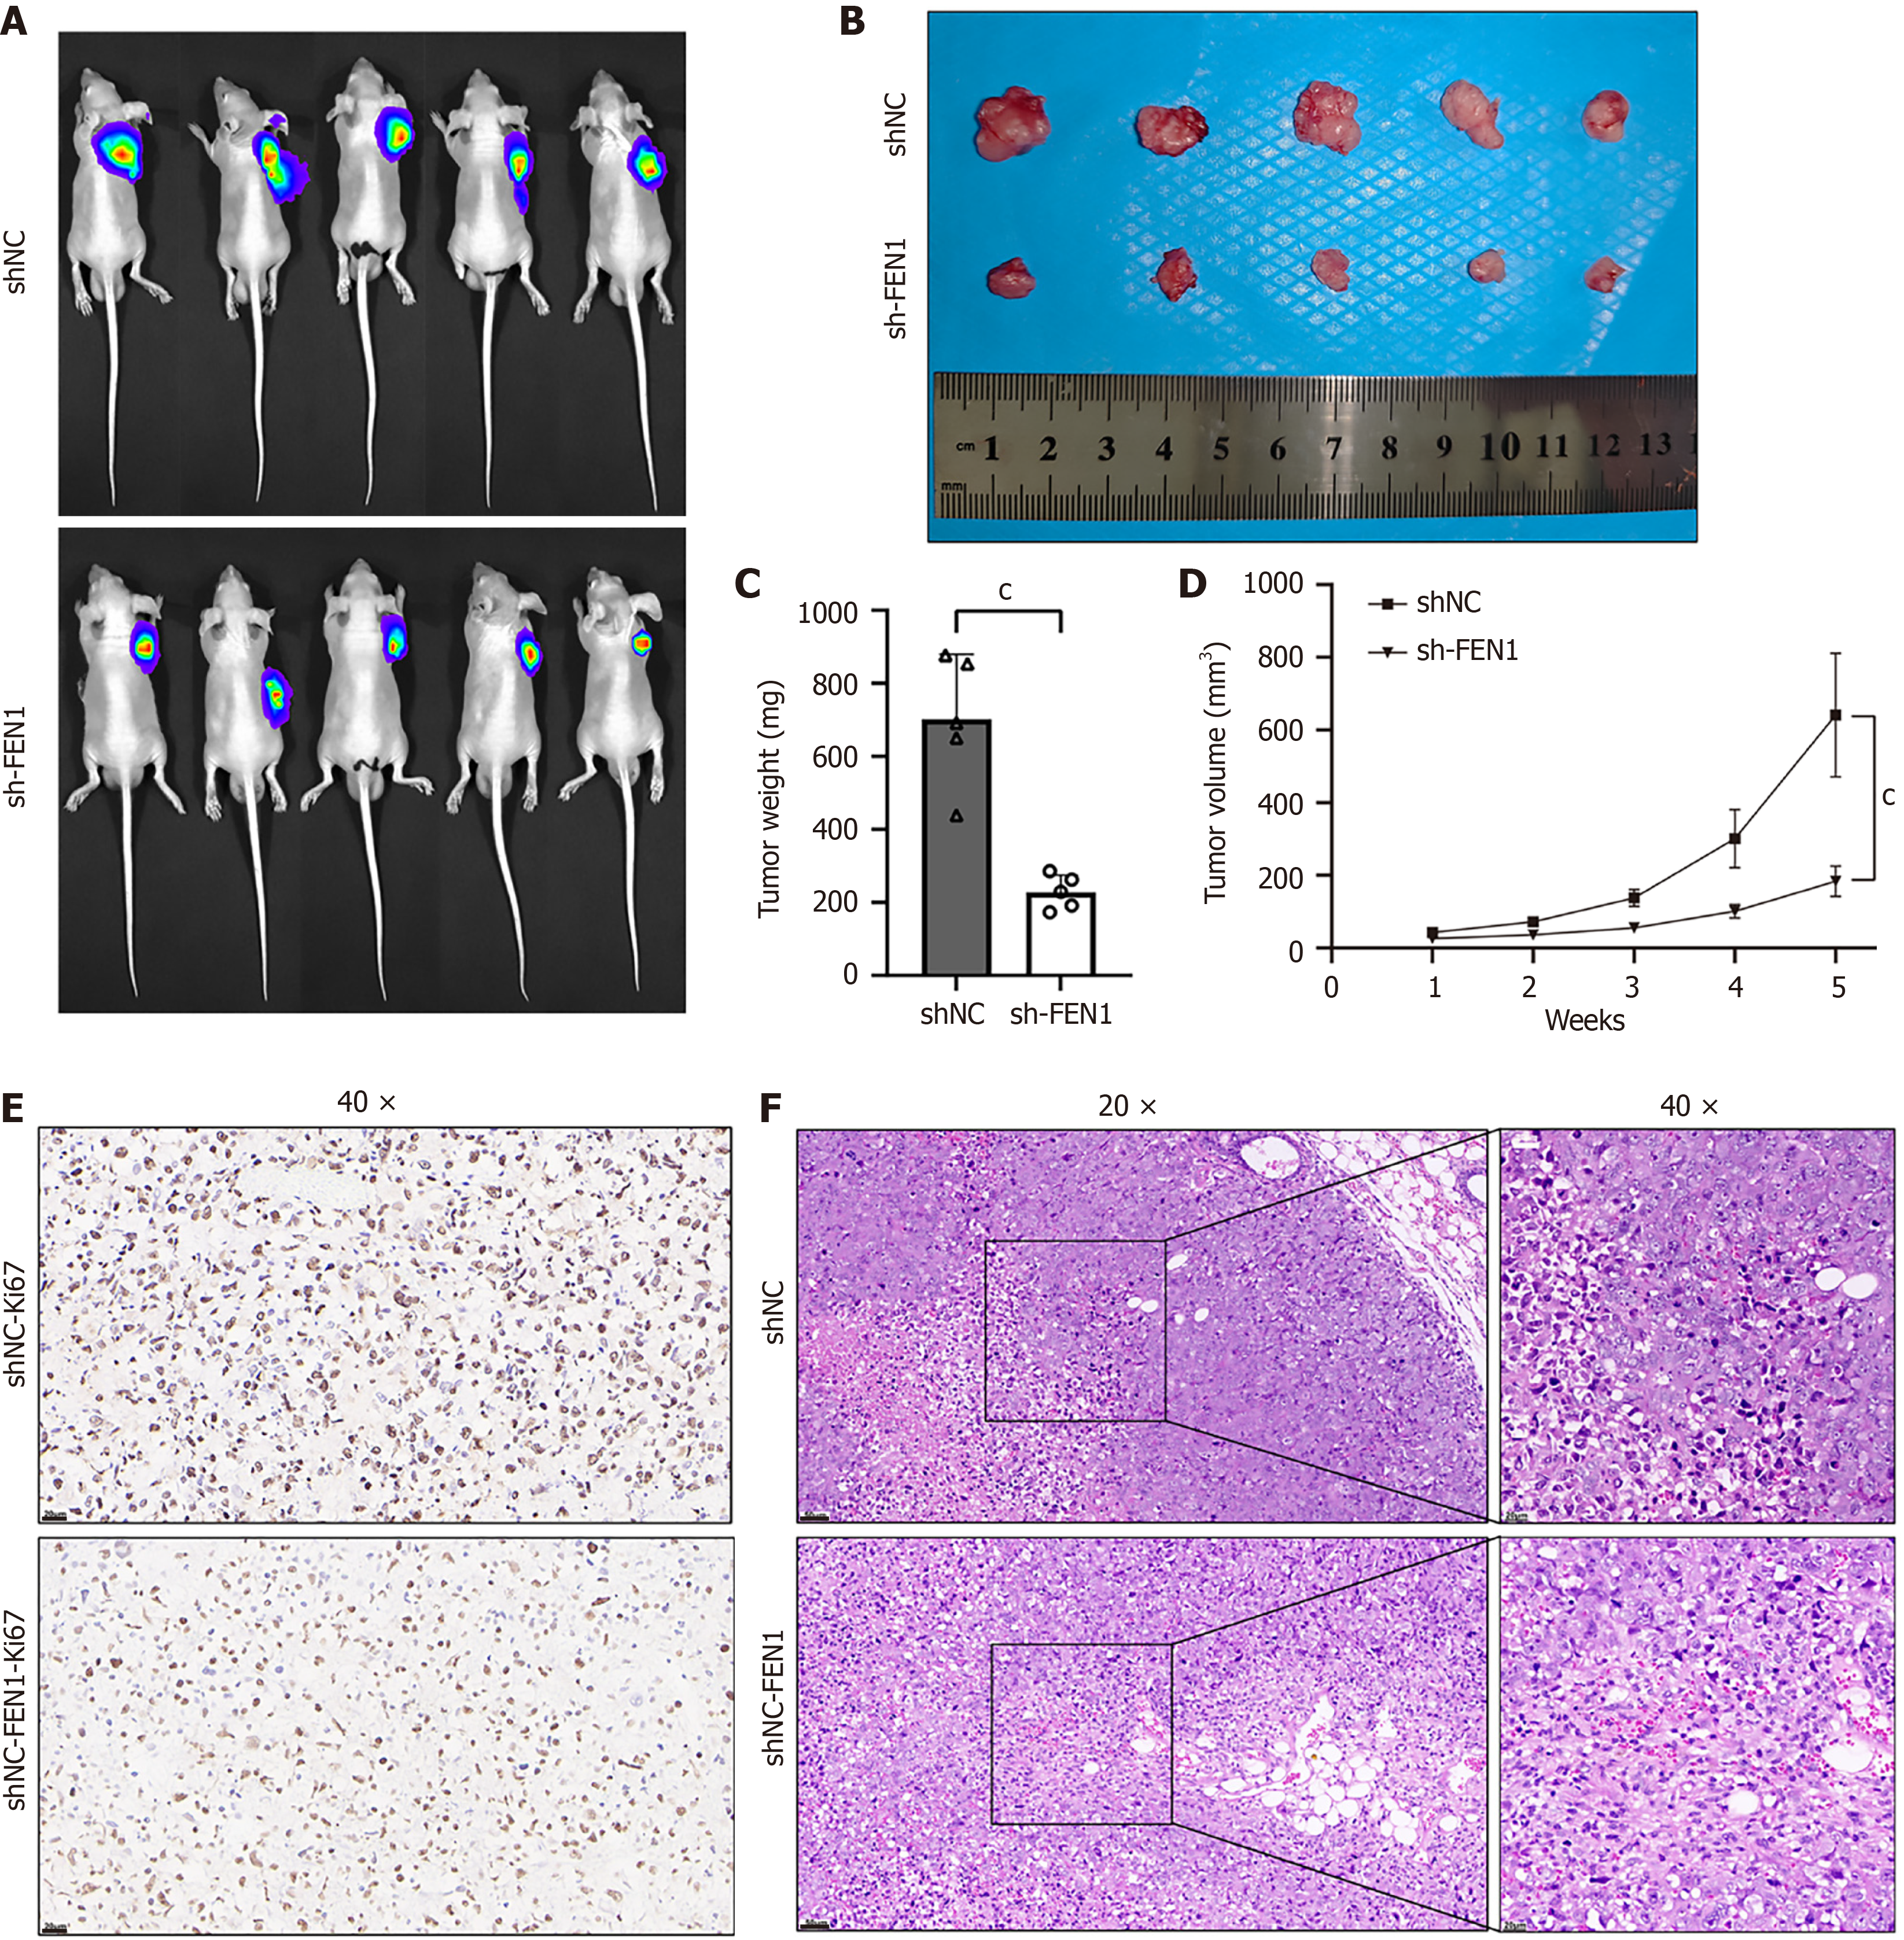
Figure 5 Flap endonuclease-1 enhances tumorigenic potential of pancreatic cancer cells in vivo.
A: Representative in vivo bioluminescence imaging of nude mice bearing subcutaneous xenograft tumors derived from PATU8988T cells with modified FEN1 expression (shFEN1 or shNC); B and C: Representative macroscopic images and quantitative weight analysis of subcutaneous xenograft tumors harvested from nude mice (n = 5 per group) subcutaneously injected with 1 × 10⁷ PATU8988T cells (shFEN1 or shNC) in the axilla; D: Growth kinetics of subcutaneous xenograft tumors measured at indicated time points over the experimental period; E: Immunohistochemical analysis of Ki-67 expression in xenograft tumor sections, indicating proliferation index. Scale bar = 20 μm; F: Representative hematoxylin and eosin staining of xenograft tumor sections showing histological features. Scale bar = 50 μm (left panels) or 20 μm (right panels). aP < 0.05, bP < 0.01, cP < 0.001.
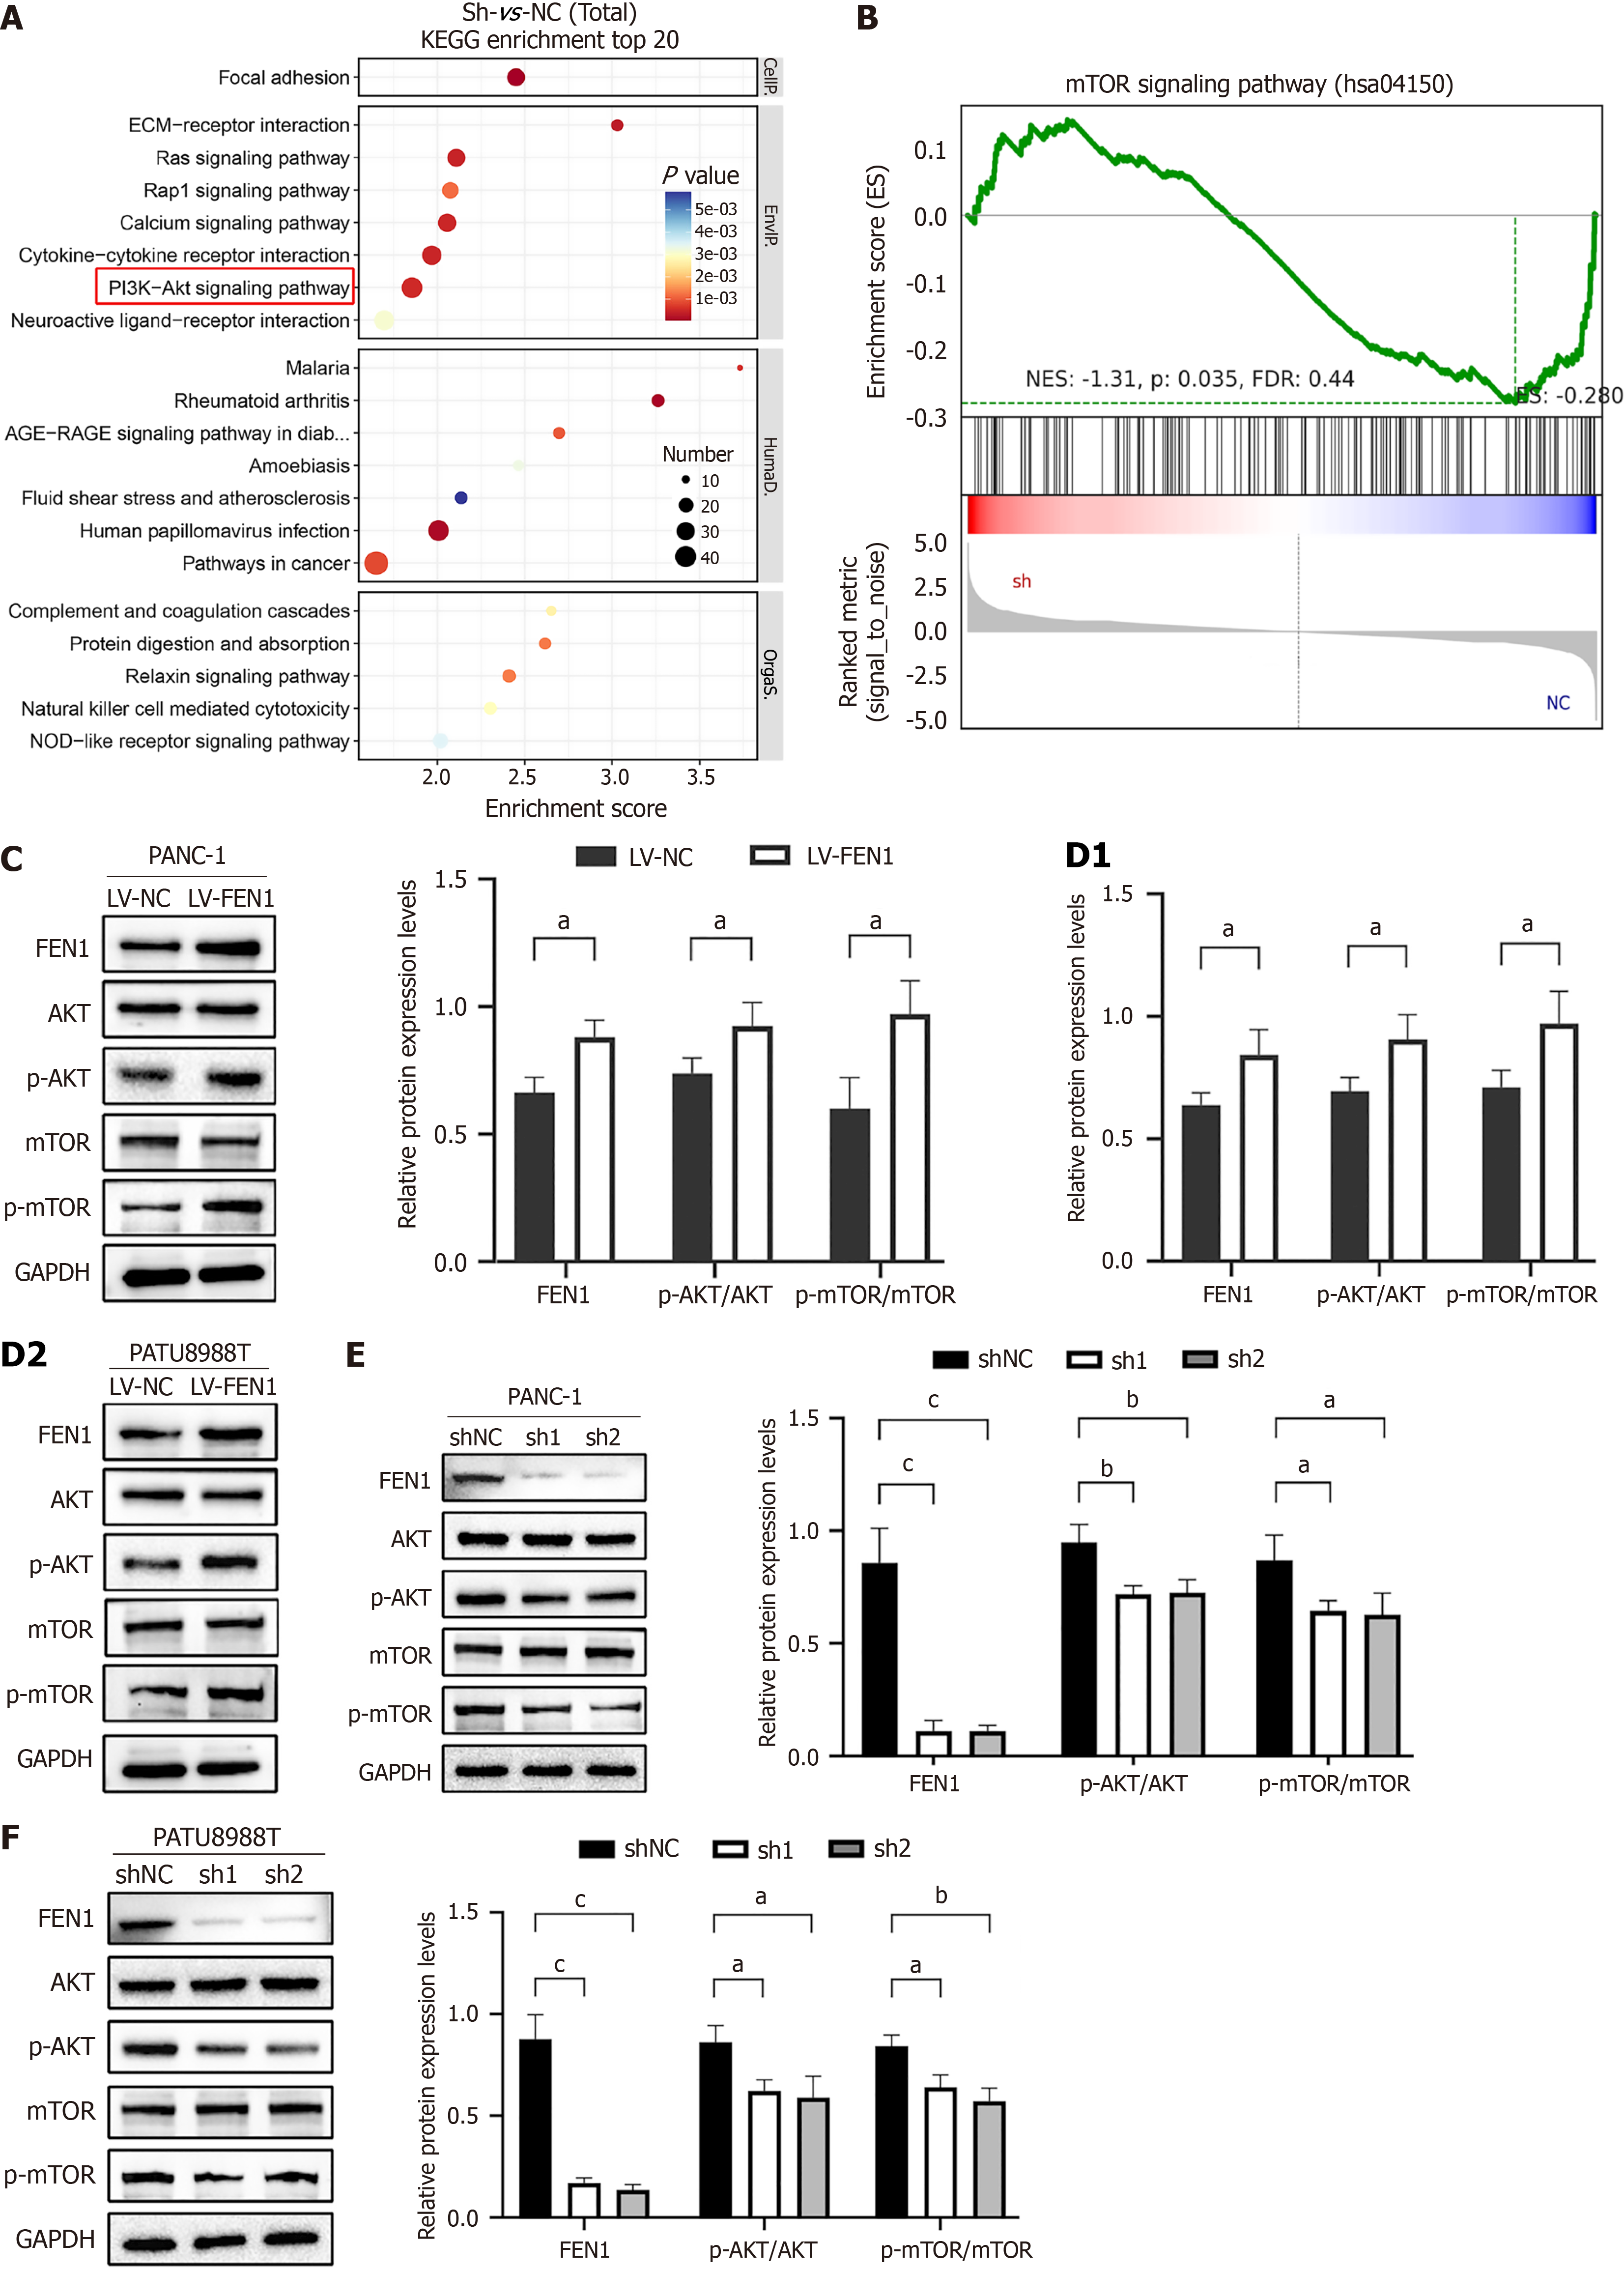
Figure 6 Flap endonuclease-1 modulation regulates the AKT/mTOR signaling pathway in pancreatic cancer.
A: Bubble plot representation of KEGG pathway enrichment analysis for genes differentially co-expressed with flap endonuclease-1 (FEN1) in pancreatic cancer. Bubble size indicates gene count; color intensity represents significance level (-log10 P value); B: GSEA enrichment plot showing correlation between FEN1 co-expressed genes and the mTOR signaling pathway (nominal P value and false discovery rate are indicated); C-F: Western blot analysis of key AKT/mTOR signaling pathway components in PATU8988T and PANC-1 cells following FEN1 knockdown or overexpression. Phosphorylation status and total protein levels were assessed for AKT, mTOR, and downstream effectors. Protein expression was normalized to appropriate loading controls. aP < 0.05, bP < 0.01, cP < 0.001.
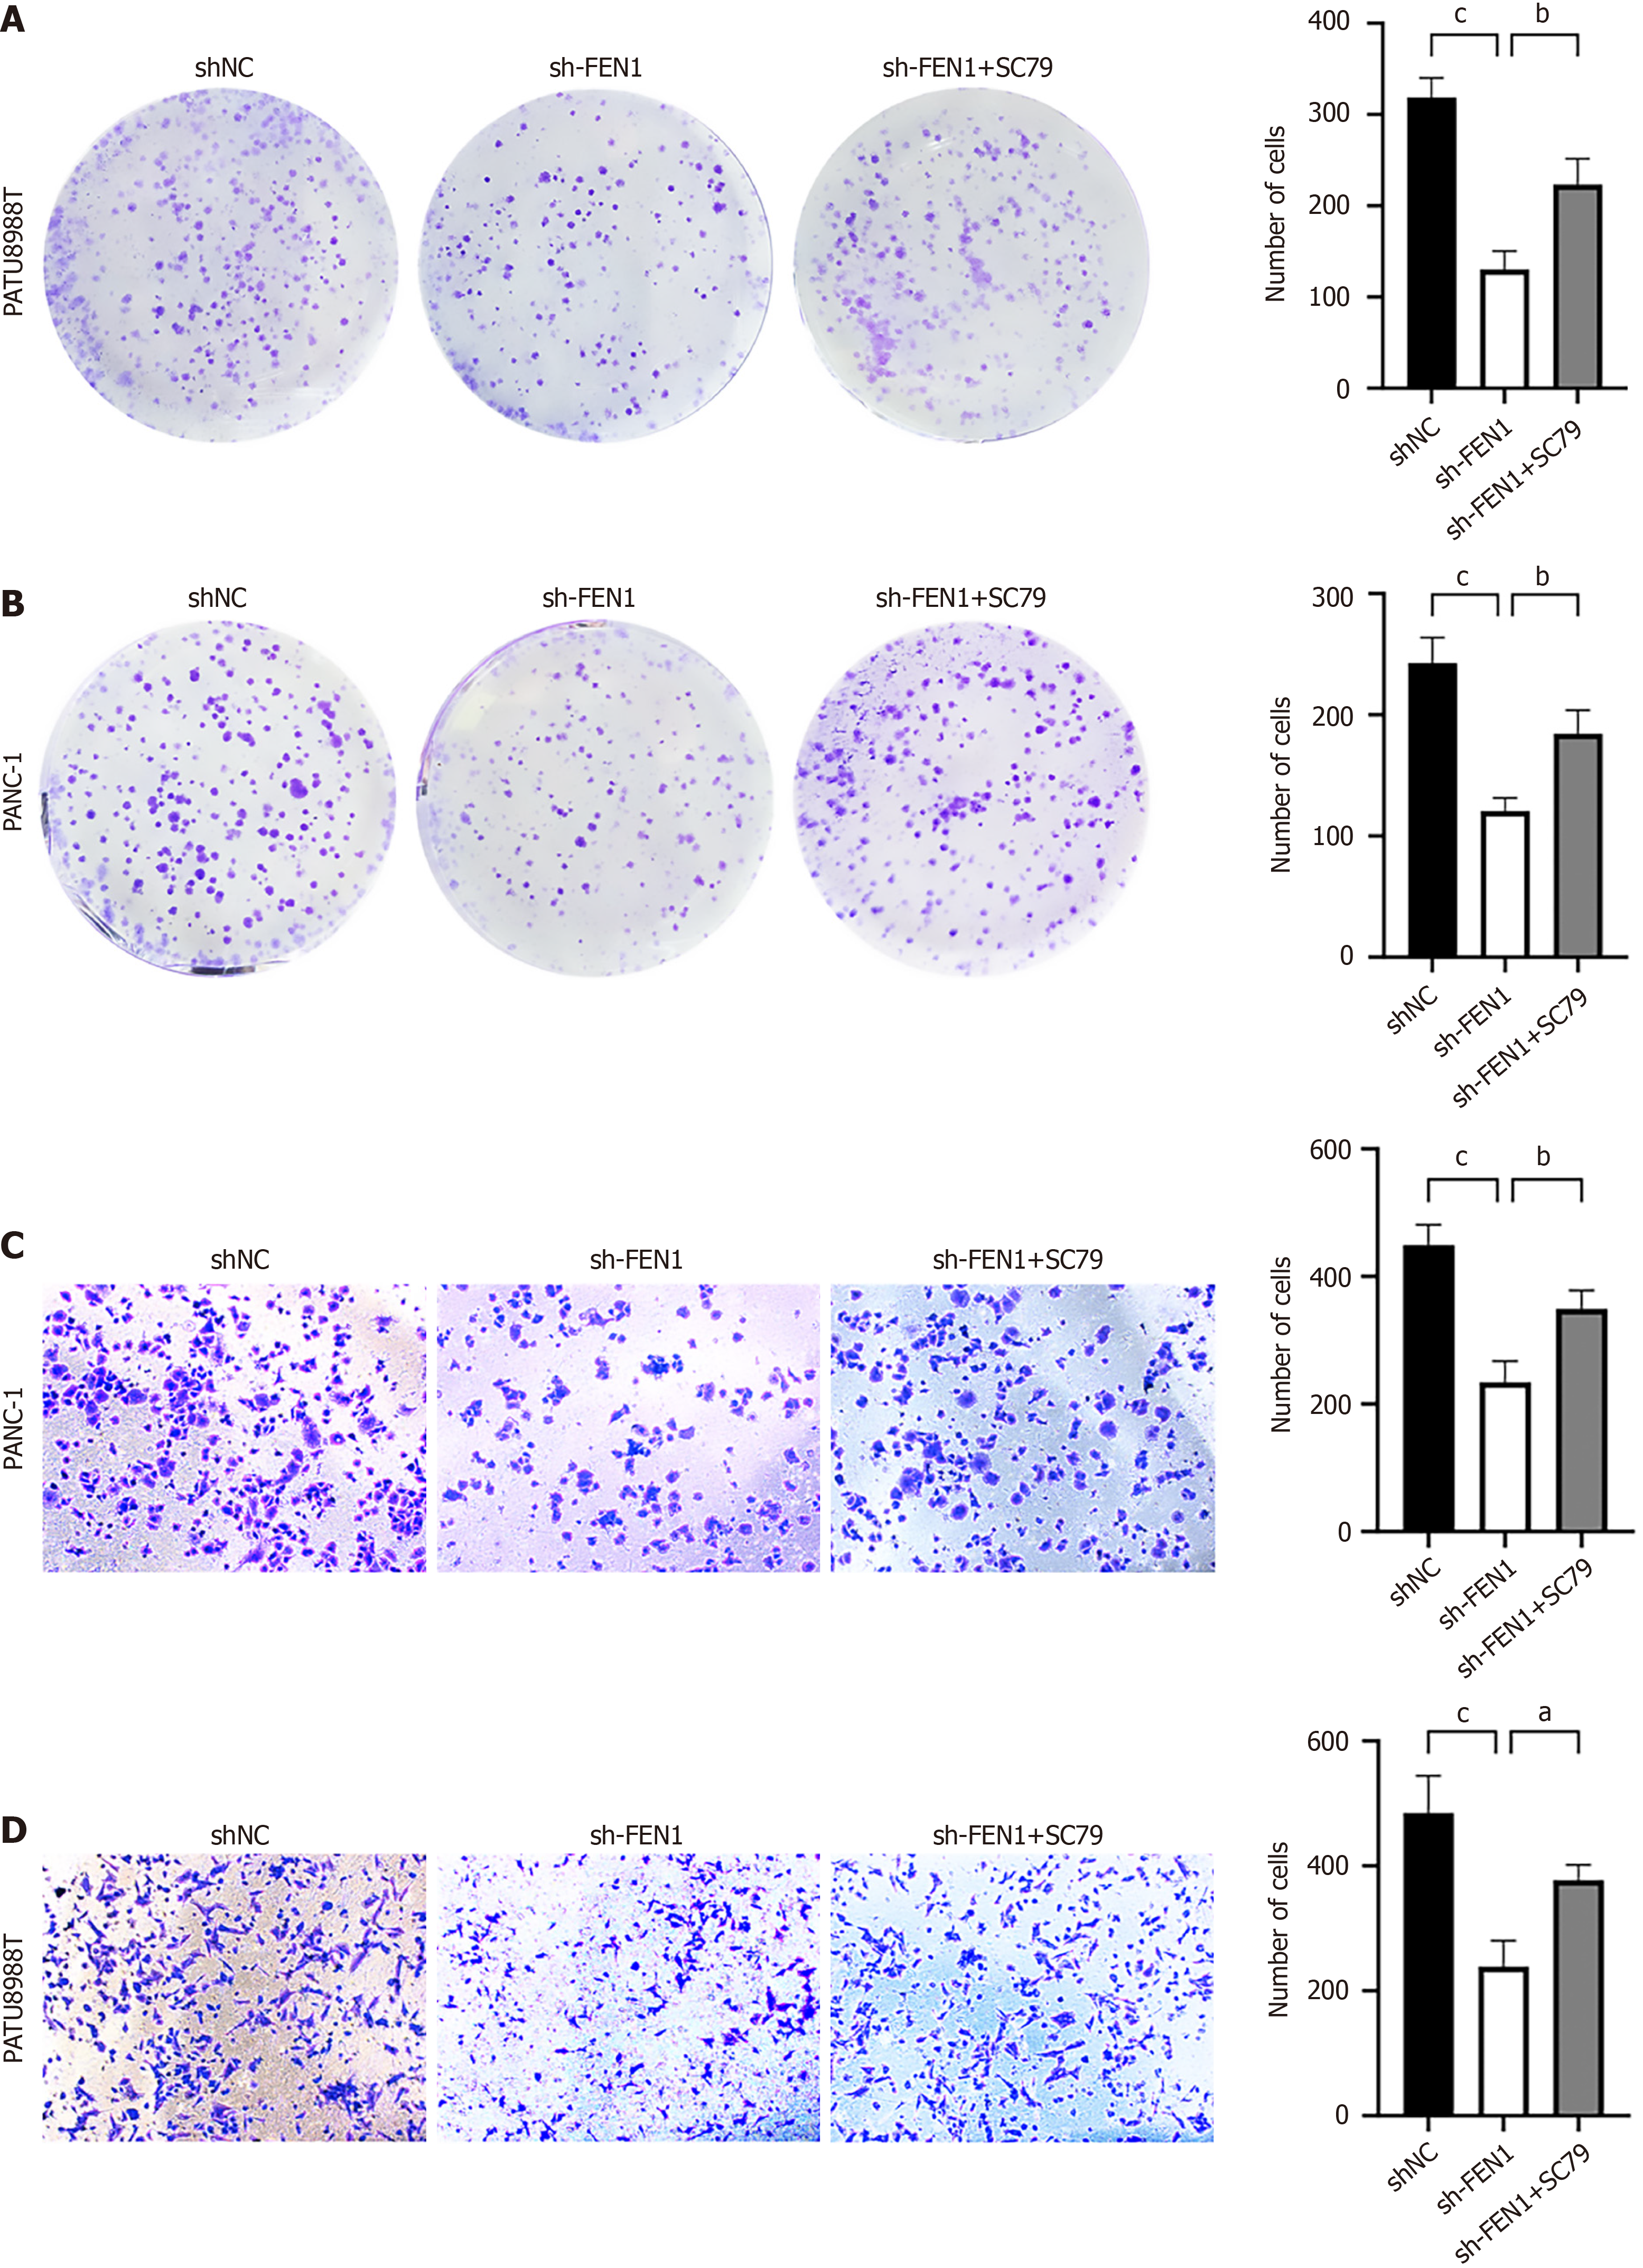
Figure 7 mTOR pathway activation rescues the suppressive effects of flap endonuclease-1 knockdown on pancreatic cancer cell proliferation and migration.
A and B: Colony formation assays evaluating the proliferative capacity of flap endonuclease-1 (FEN1)-knockdown PATU8988T and PANC-1 cells following treatment with the AKT activator SC79; C and D: Transwell migration assays assessing the migratory potential of FEN1-knockdown PATU8988T and PANC-1 cells treated with SC79. Representative images and quantitative analysis of migrated cells are shown (data represent mean ± SD from three independent experiments). aP < 0.05, bP < 0.01, cP < 0.001.
- Citation: Xia Y, Guo N, Zhu CL, Gao JY, Da MX. Flap endonuclease-1 promotes pancreatic cancer progression via AKT/mTOR signaling pathway. World J Gastrointest Oncol 2025; 17(7): 104402
- URL: https://www.wjgnet.com/1948-5204/full/v17/i7/104402.htm
- DOI: https://dx.doi.org/10.4251/wjgo.v17.i7.104402


