Copyright
©The Author(s) 2025.
World J Gastrointest Oncol. Jun 15, 2025; 17(6): 107980
Published online Jun 15, 2025. doi: 10.4251/wjgo.v17.i6.107980
Published online Jun 15, 2025. doi: 10.4251/wjgo.v17.i6.107980
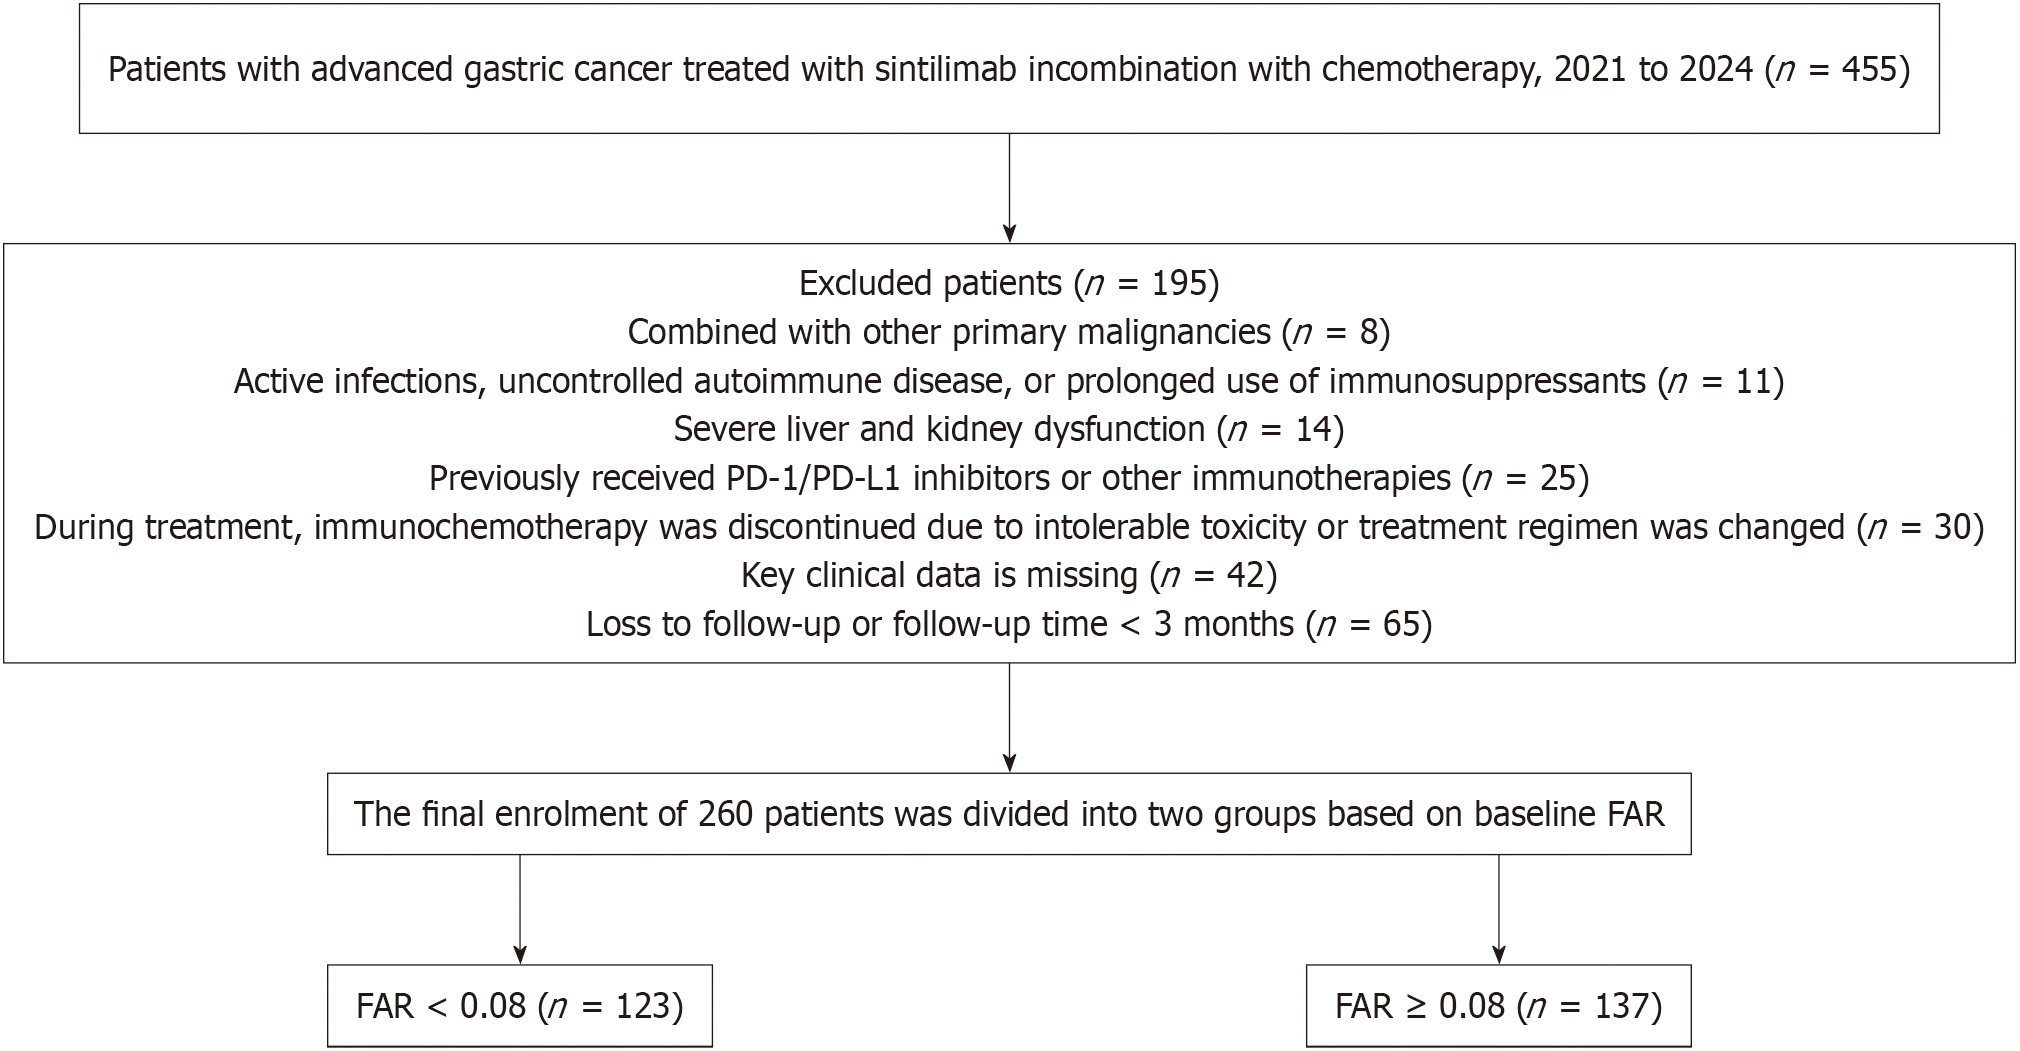
Figure 1 Flow chart of the screening process for advanced gastric cancer patients receiving immunotherapy combined with chemotherapy.
PD-1: Programmed cell death protein 1; PD-L1: Programmed cell death ligand 1; FAR: Fibrinogen-to-albumin ratio.
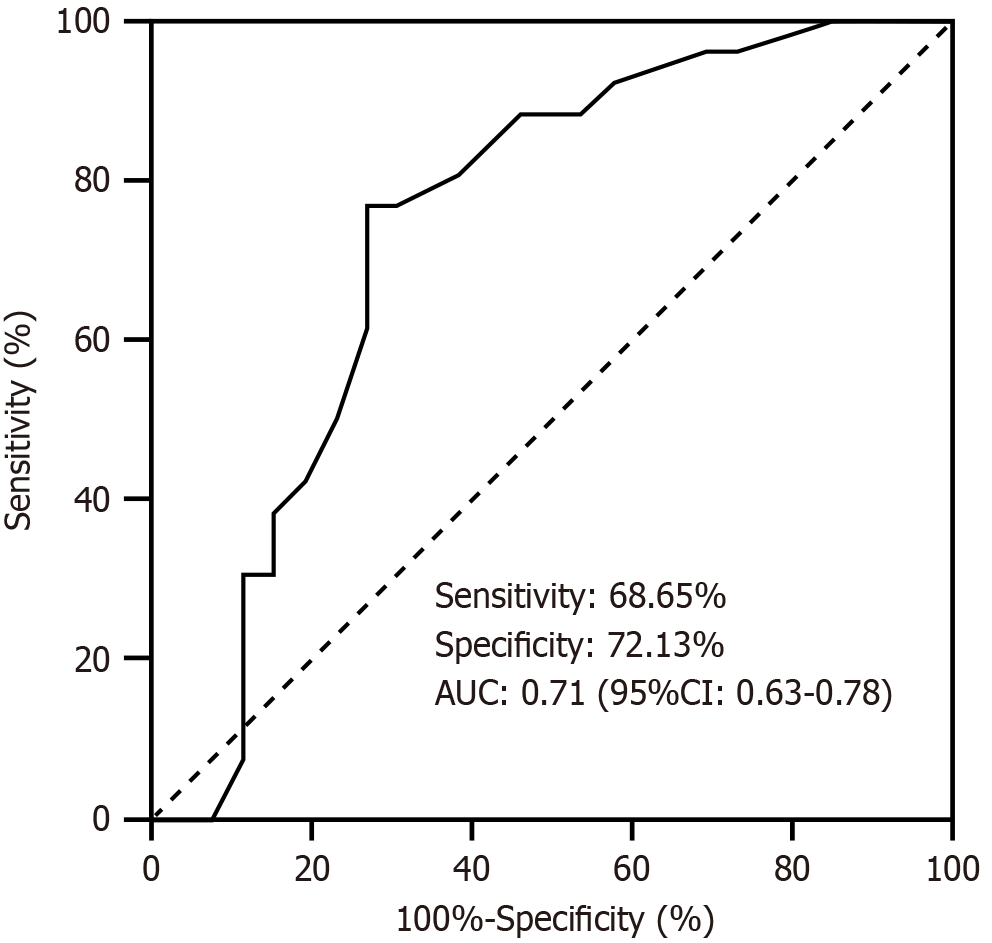
Figure 2 Receiver operating characteristics curve analysis based on fibrinogen to albumin ratio for overall survival.
AUC: Area under the curve.
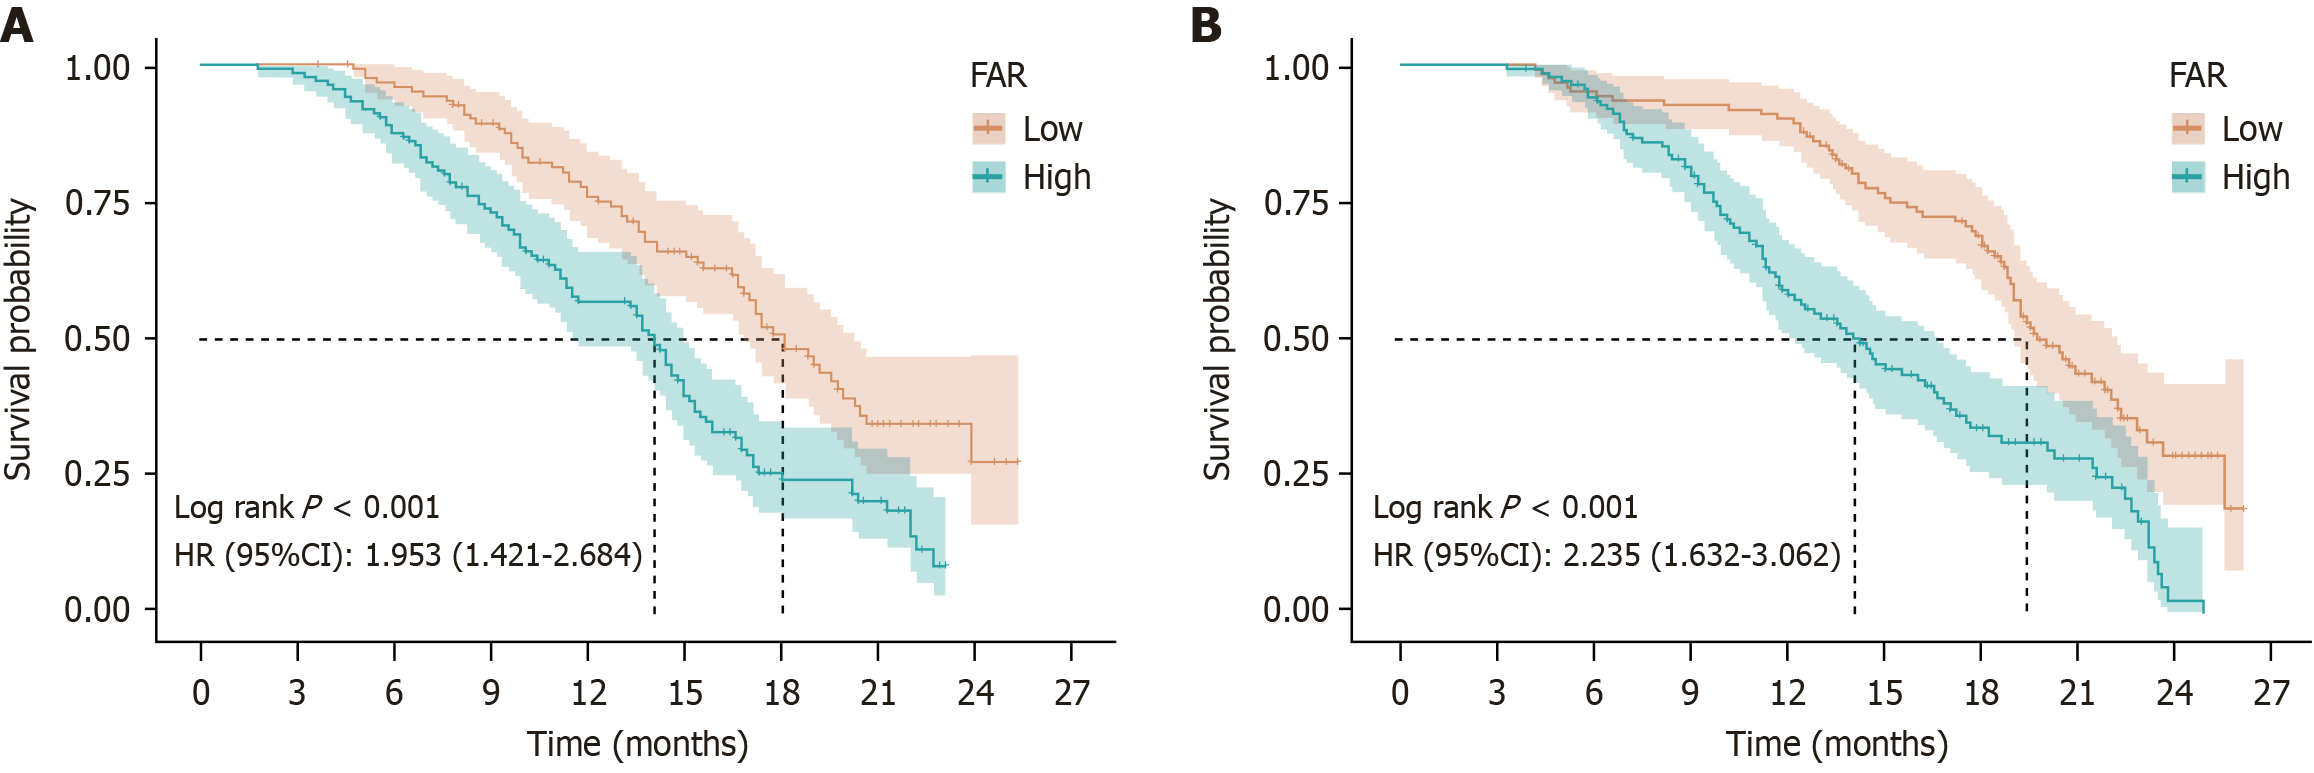
Figure 3 Effects of different fibrinogen to albumin on the long-term prognosis of gastric cancer patients.
A: Kaplan-Meier plot of the fibrinogen-to-albumin ratio (FAR) < 0.08 and FAR ≥ 0.08 groups; B: Kaplan-Meier plot of overall survival in the FAR < 0.08 and FAR ≥ 0.08 groups. FAR: Fibrinogen-to-albumin ratio; HR: Hazard ratio.
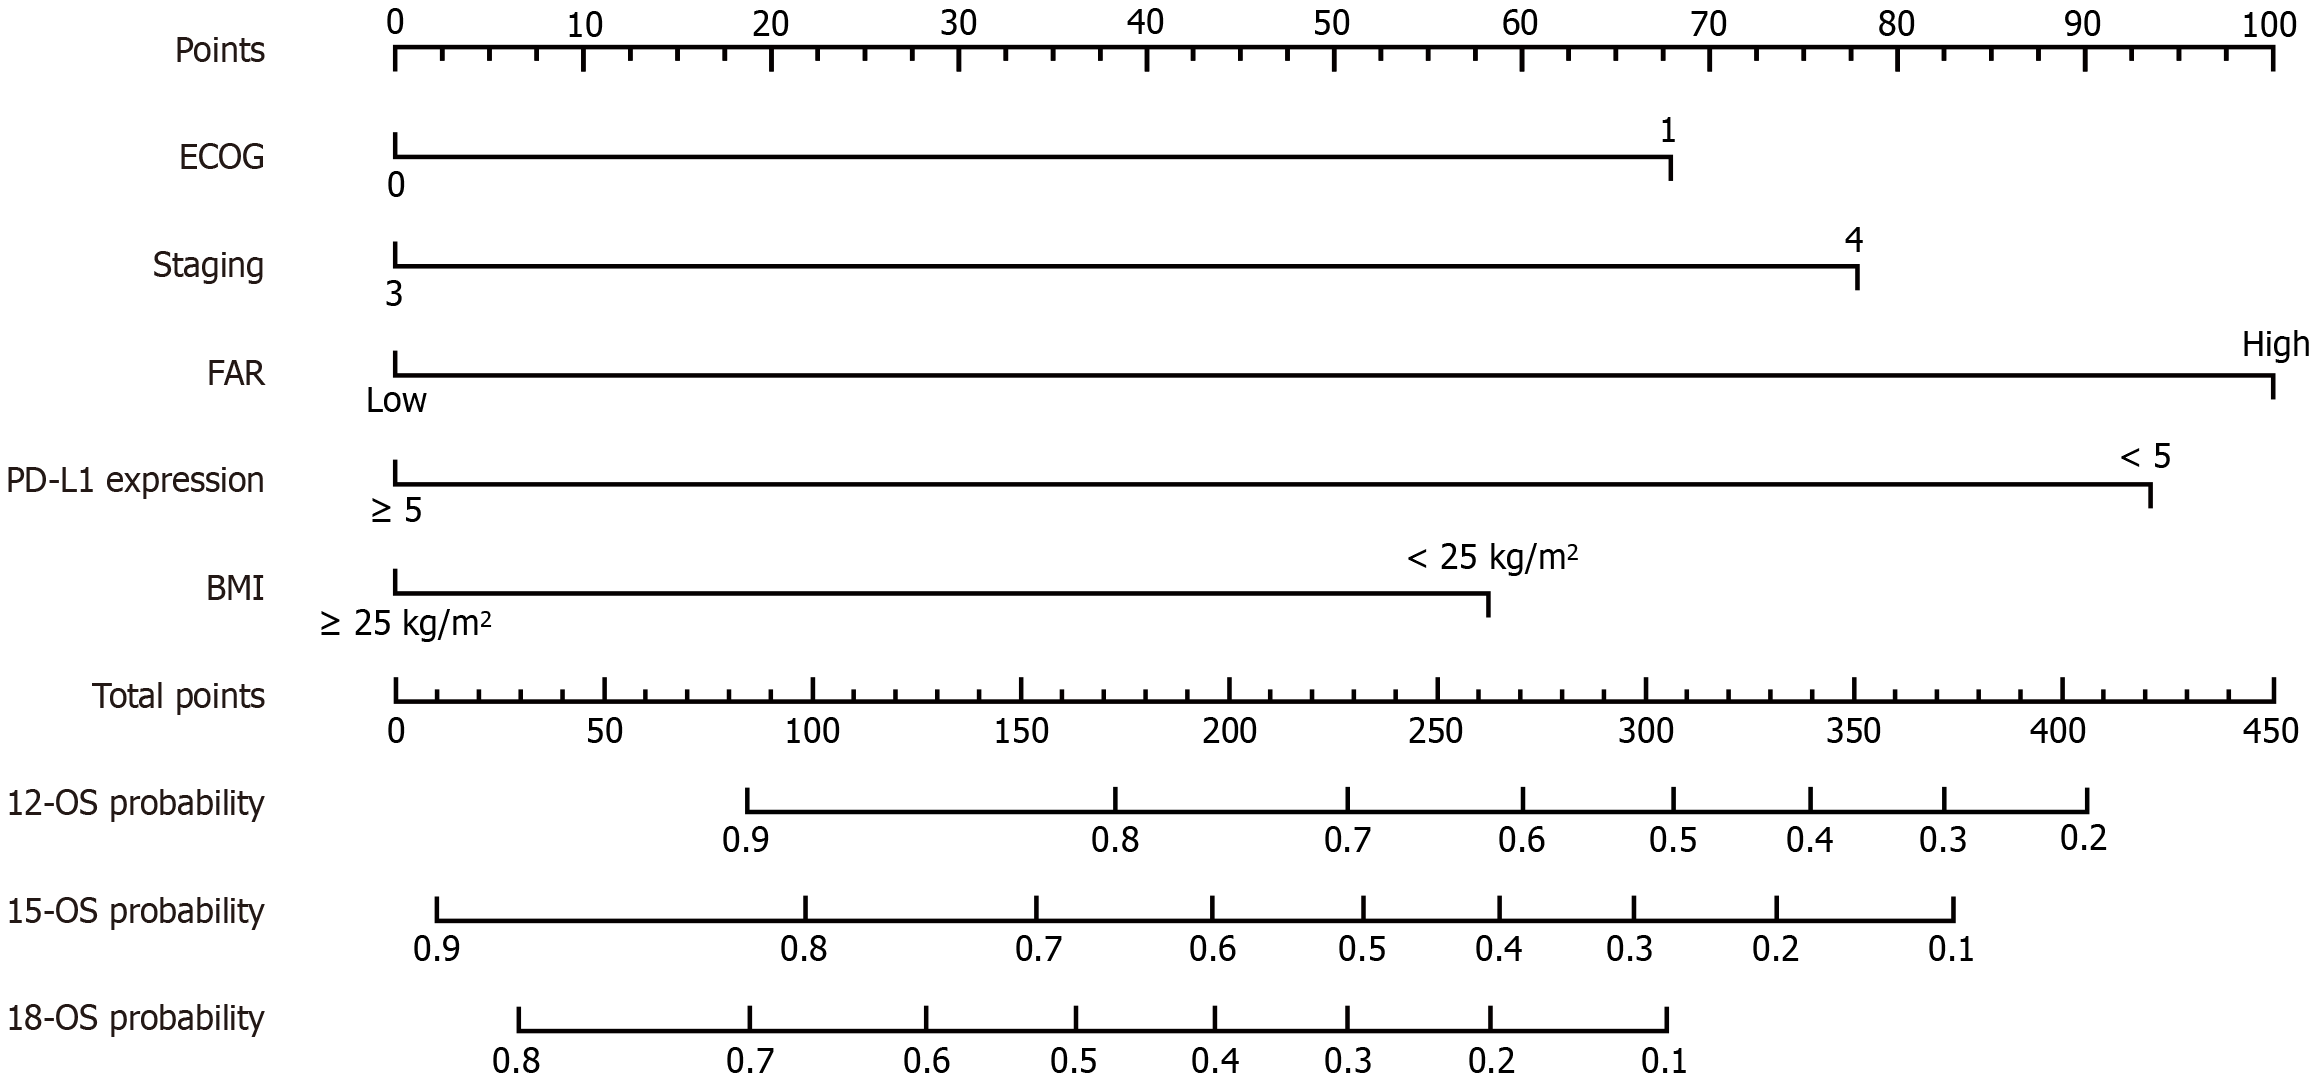
Figure 4 Graph depicting the prognostic model for predicting 12-, 15-, and 18-month overall survival.
ECOG: Eastern Cooperative Oncology Group; FAR: Fibrinogen-to-albumin ratio; BMI: Body mass index; PD-L1: Programmed cell death ligand 1; OS: Overall survival.
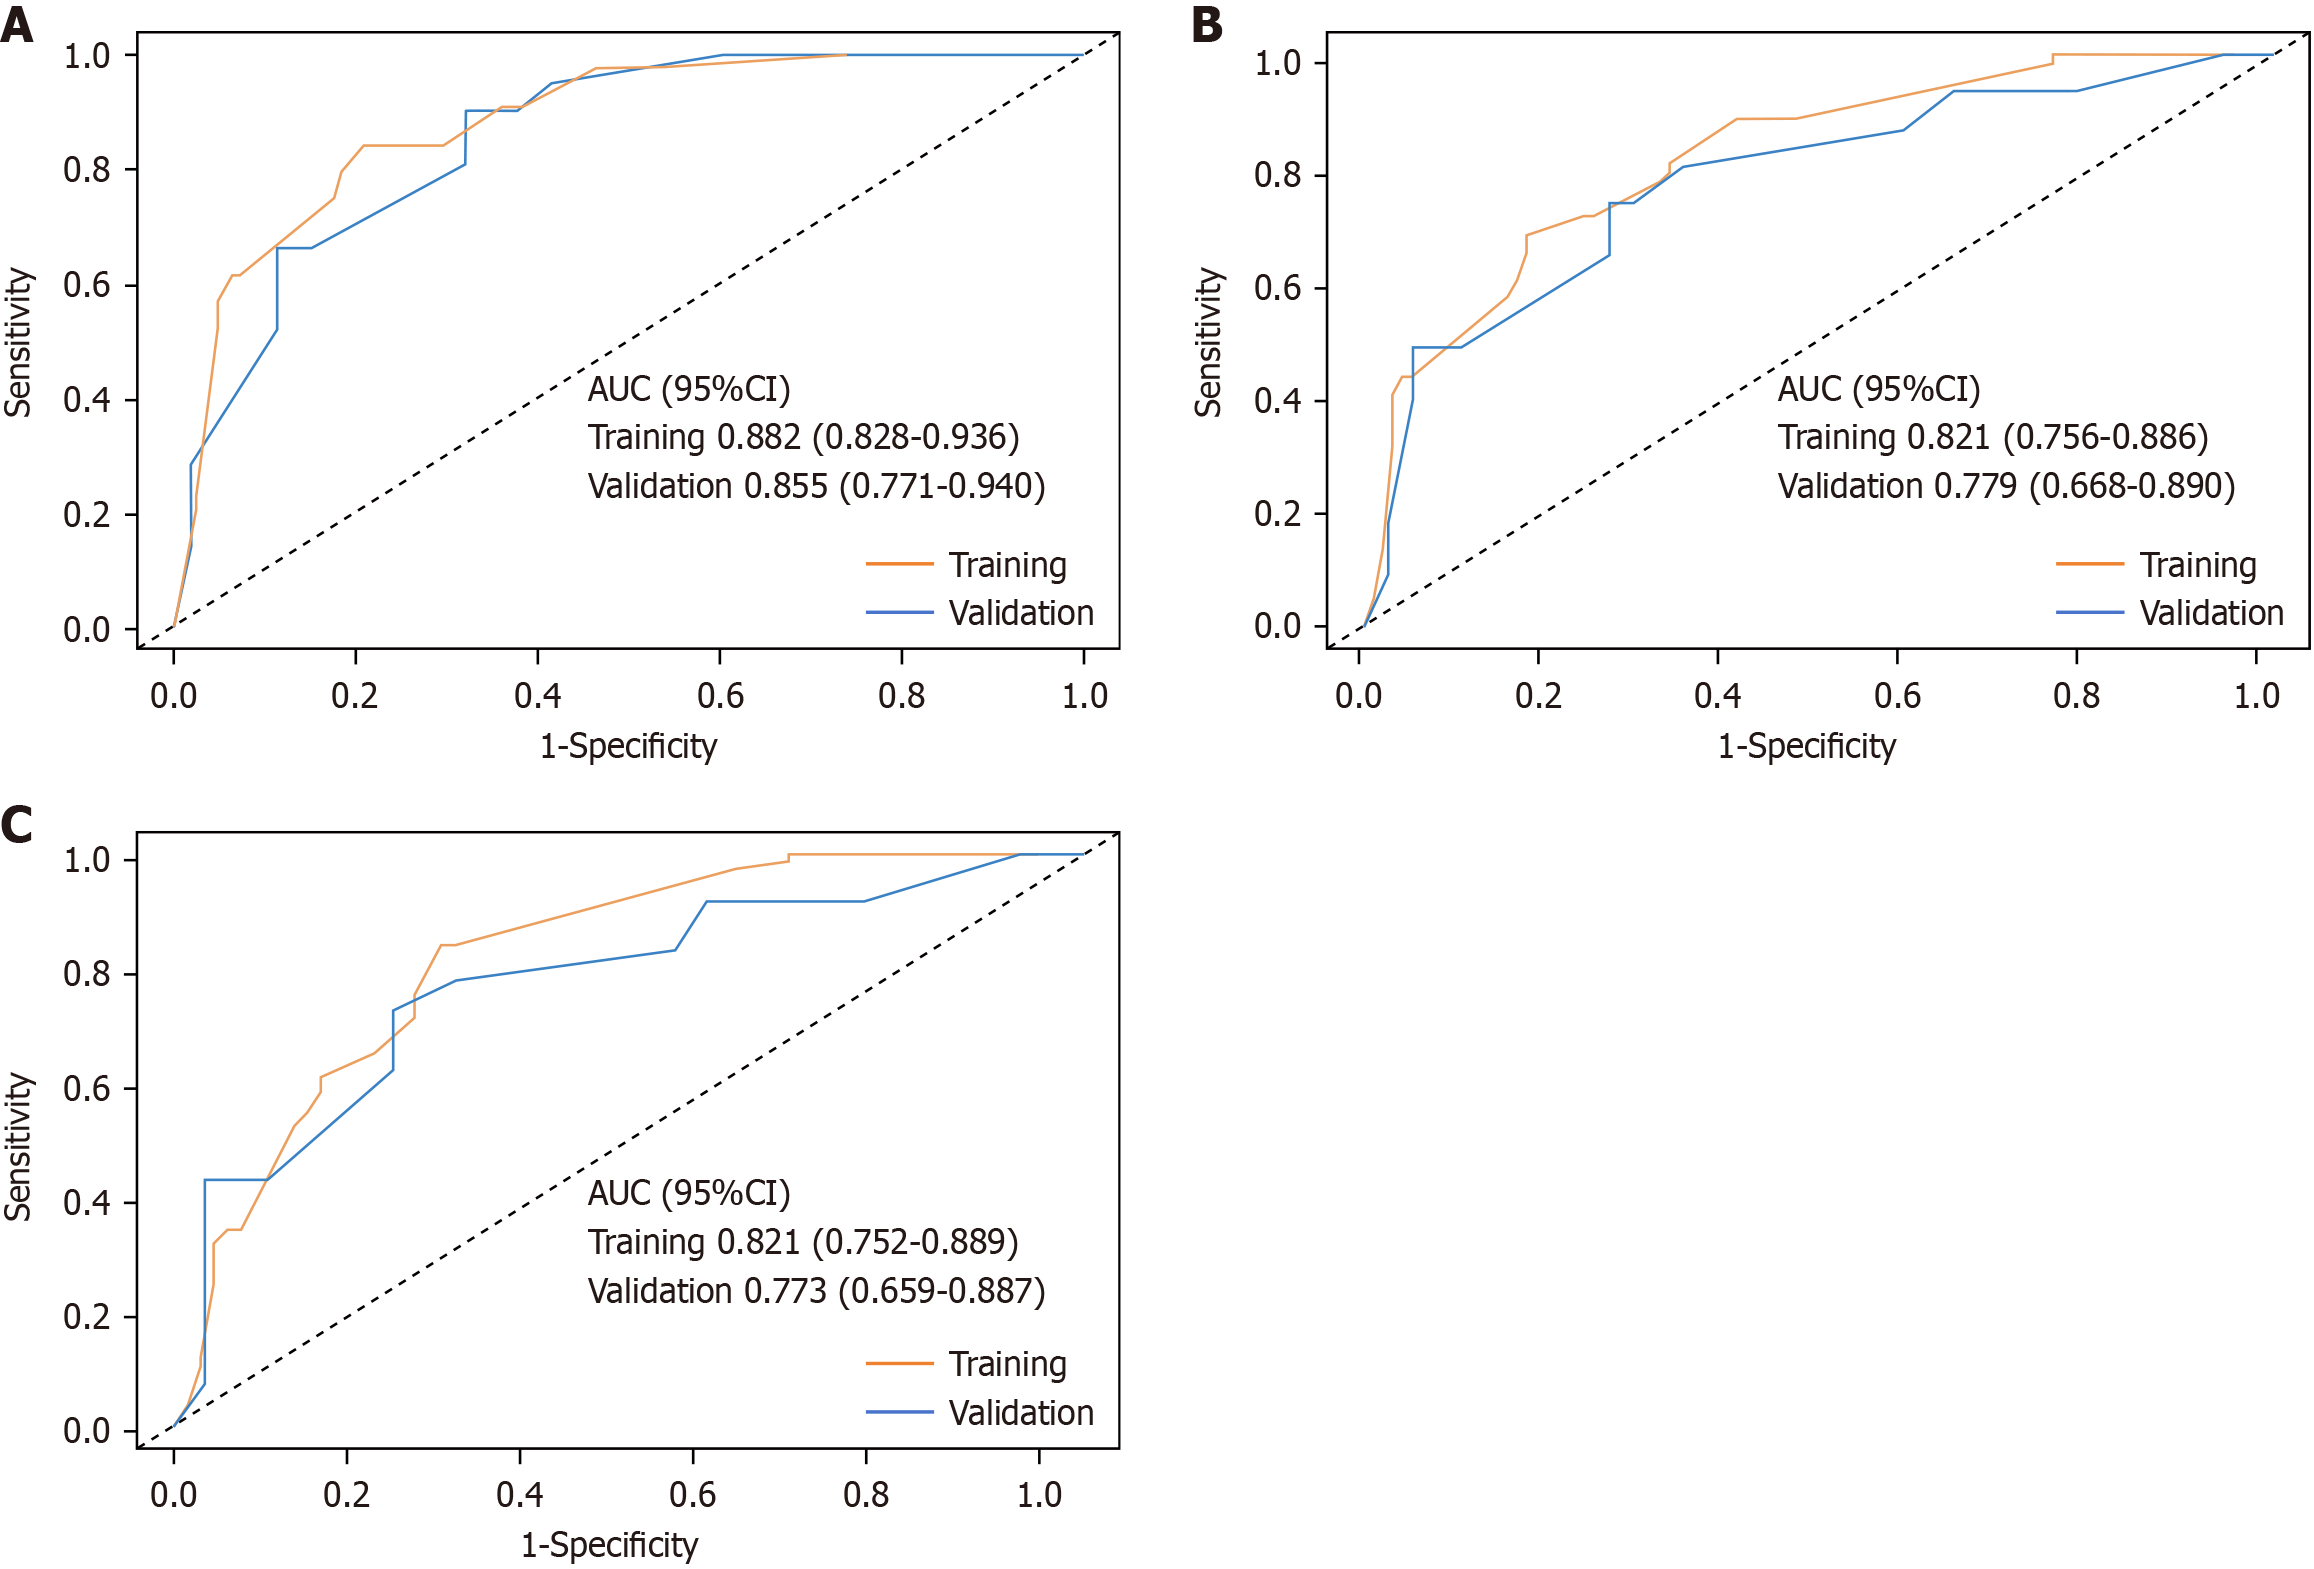
Figure 5 Graph depicting the operating characteristic evaluation plot for a prognostic model.
A: Graph showing the training set and validation set receiver operating characteristic (ROC) evaluation plots for 12-month prognostic prediction model; B: Graph showing the training set and validation set ROC evaluation plots for 15-month prognostic prediction model; C: Graph showing the training set and validation set ROC evaluation plots for 18-month prognostic prediction model. AUC: Area under the curve.
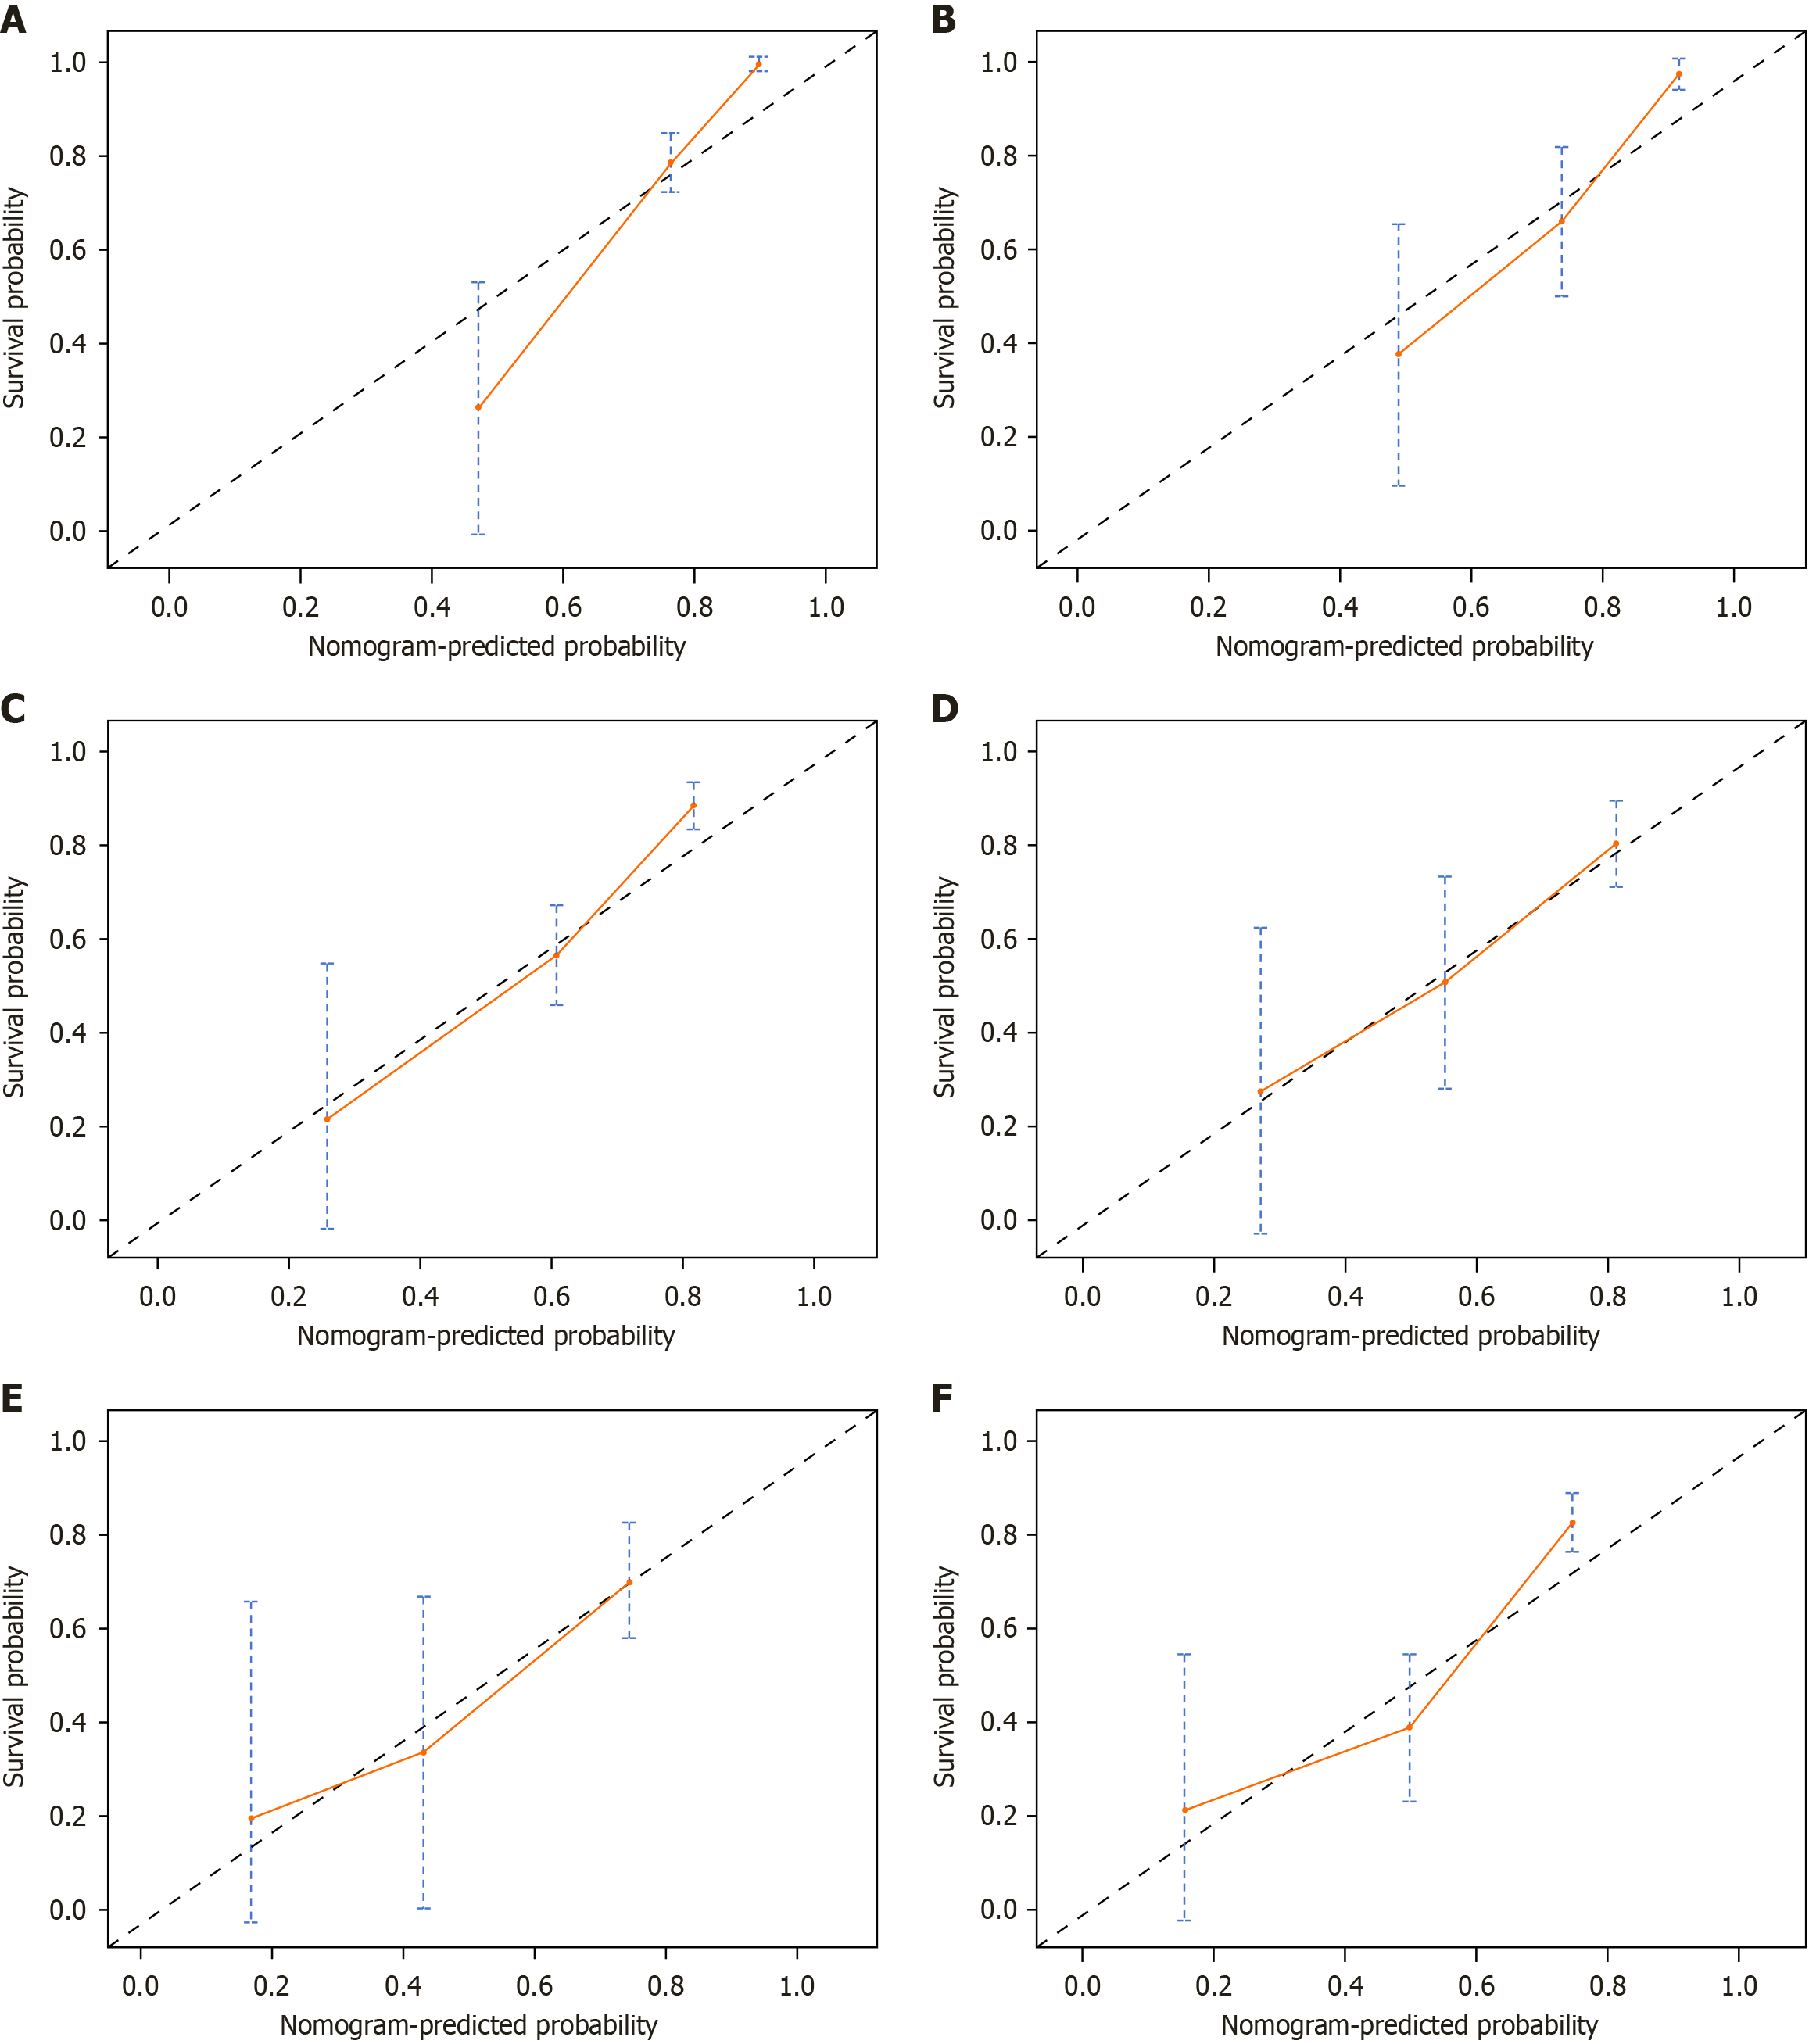
Figure 6 Graph illustrating the calibration plots for a prognostic model.
A: Calibration plots for the training set 12-month overall survival (OS); B: Calibration plots for the validation set 12-month OS; C: Calibration plots for the training set 15-month OS; D: Calibration plots for the validation set 15-month OS; E: Calibration plots for the training set 18-month OS; F: Calibration plots for the validation set 18-month OS.
- Citation: Yao ZY, Liu J, Ma X, Li WT, Shen Y, Cui YZ, Fang Y, Han ZX, Yang CH. Impact of fibrinogen-to-albumin ratio on the long-term prognosis of patients with advanced HER2-negative gastric cancer receiving immunochemotherapy. World J Gastrointest Oncol 2025; 17(6): 107980
- URL: https://www.wjgnet.com/1948-5204/full/v17/i6/107980.htm
- DOI: https://dx.doi.org/10.4251/wjgo.v17.i6.107980


