Copyright
©The Author(s) 2025.
World J Gastrointest Oncol. Jun 15, 2025; 17(6): 107272
Published online Jun 15, 2025. doi: 10.4251/wjgo.v17.i6.107272
Published online Jun 15, 2025. doi: 10.4251/wjgo.v17.i6.107272
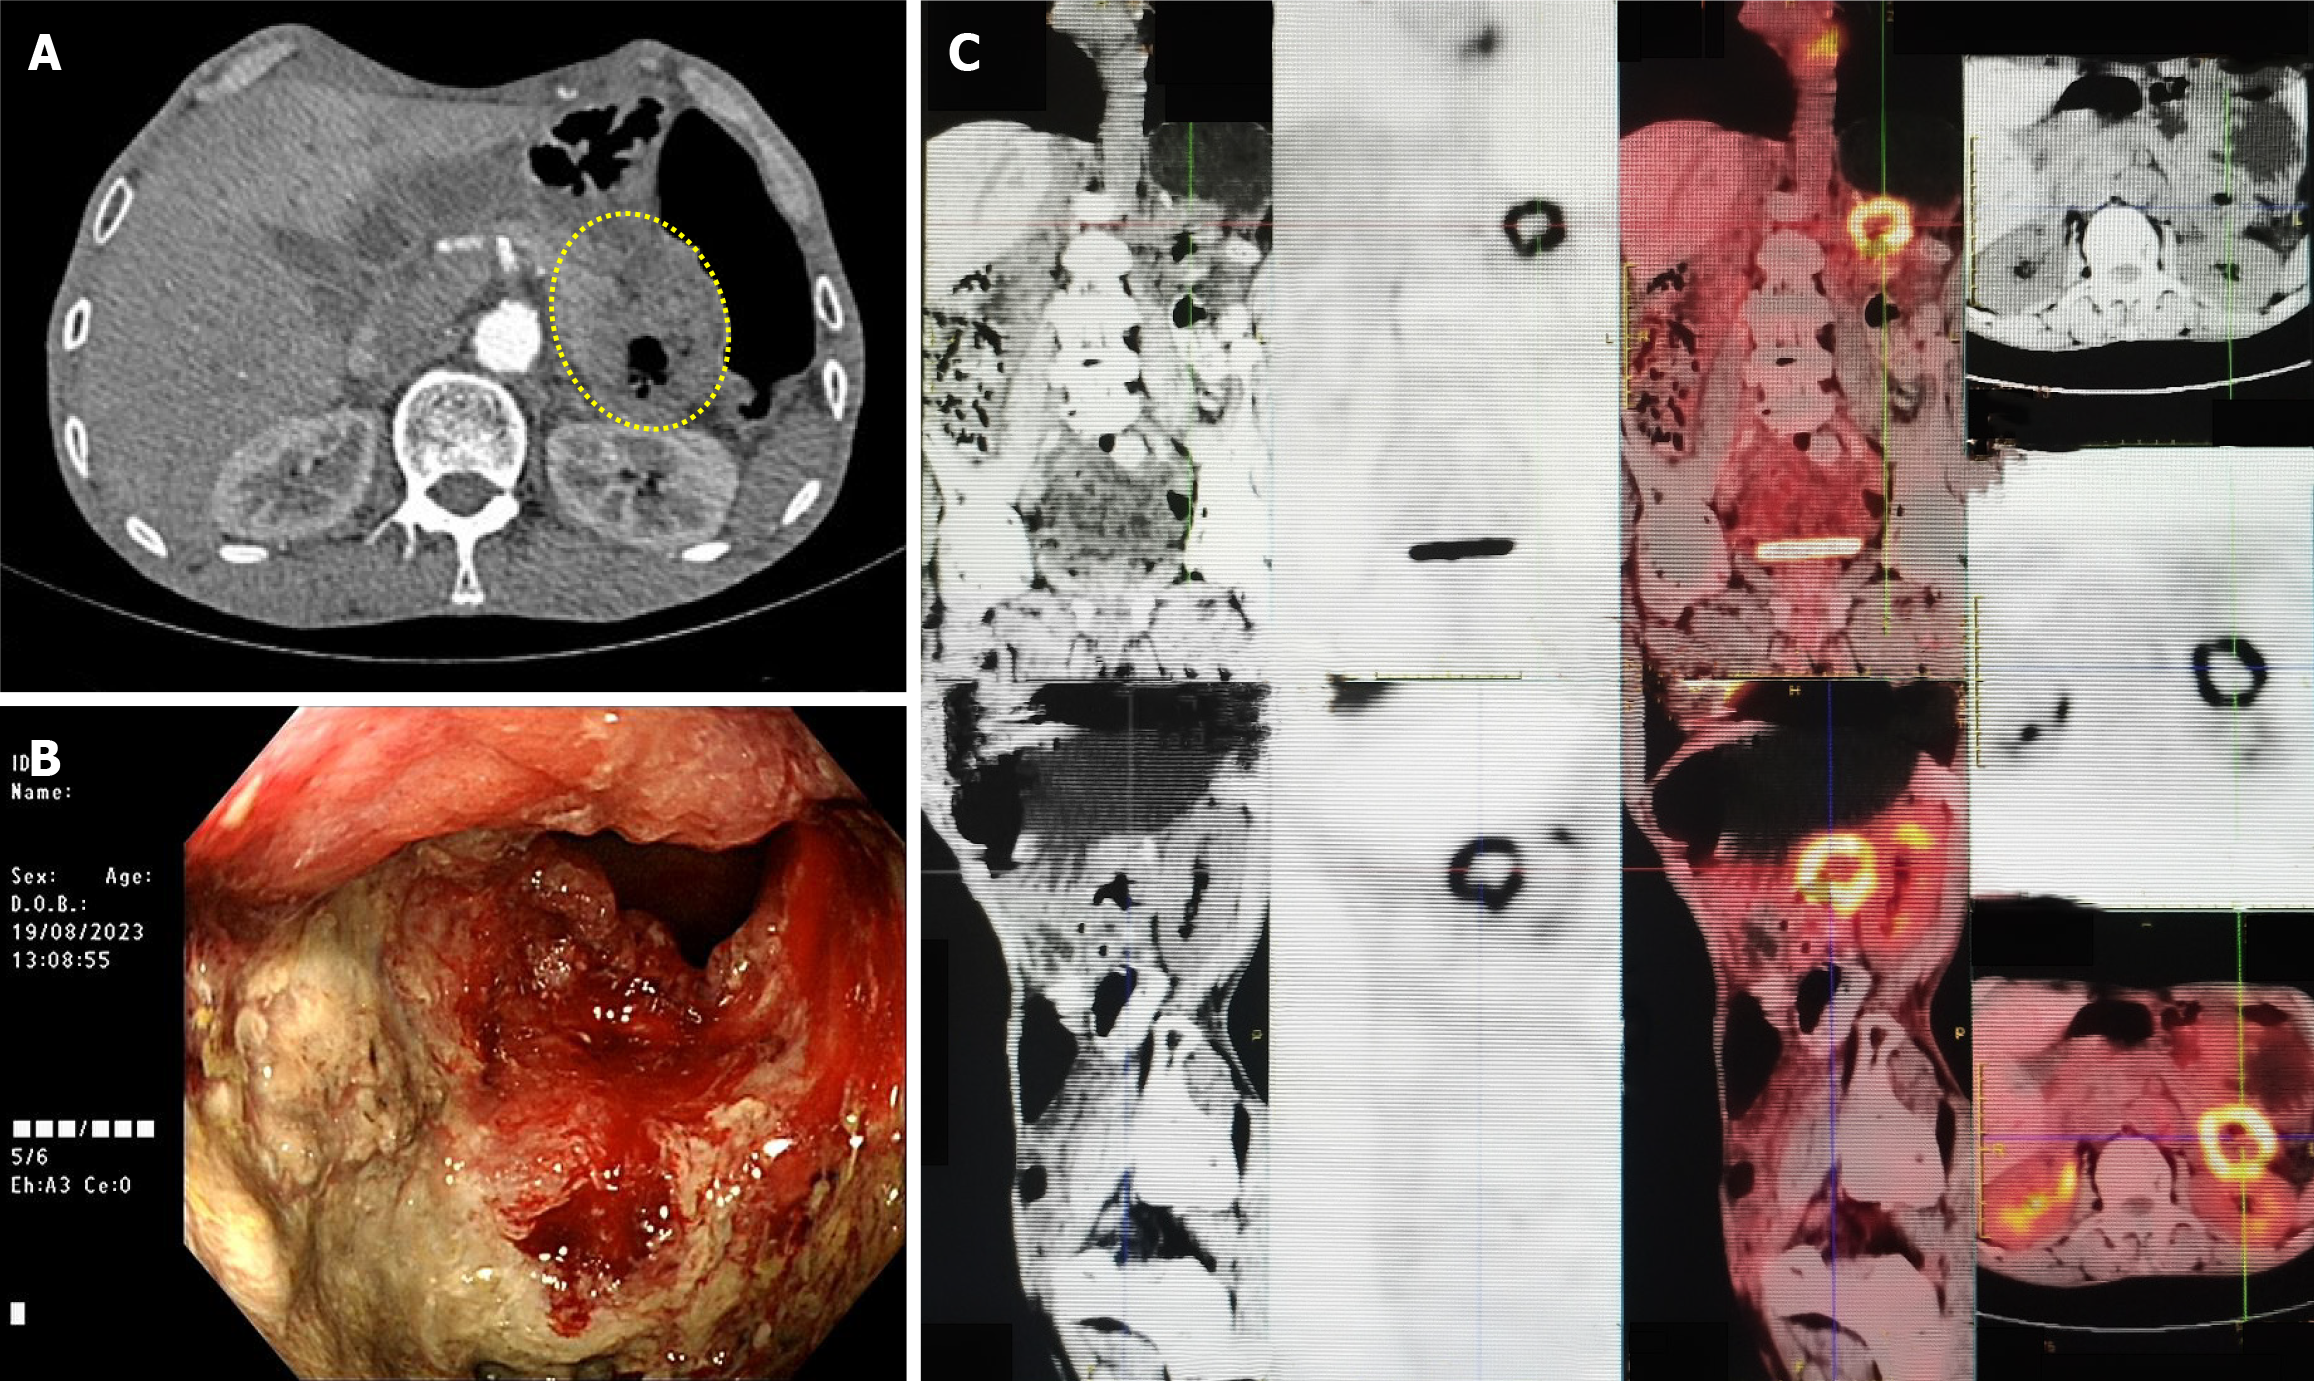
Figure 1 Imaging findings.
A: Computed tomography image showing circumferential wall thickening of the descending colon with luminal narrowing (yellow circle); B: Colonoscopic image of a circumferential ulcerative mass in the descending colon; C: Positron emission tomography-computed tomography image demonstrating hypermetabolic activity in the descending colon.
Figure 2 Pathology findings.
A: Colon (20 × hematoxylin and eosin staining): Atypical cells arranged in nests and sheets with focal keratinization (indicated by yellow circles); B: Pancreas (20 × hematoxylin and eosin staining): Atypical cells arranged in nests and sheets with focal keratinization (indicated by yellow circles); C: 100 × Immunohistochemistry (IHC): Ki67 (+); D: 100 × IHC: P40 (+); E: 100 × IHC: Cytokeratin (CK) 5/6 (+); F: 100 × IHC: P63 (+); G: 100 × IHC: CK20 (-); H: 100 × IHC: Caudal-type homeobox protein 2 (-); I: 100 × IHC: Villin (-); J: 100 × IHC: CK7 (+); K: 100 × IHC: Pan-CK (+); L: 100 × IHC: Somatostatin receptor 2 (-).
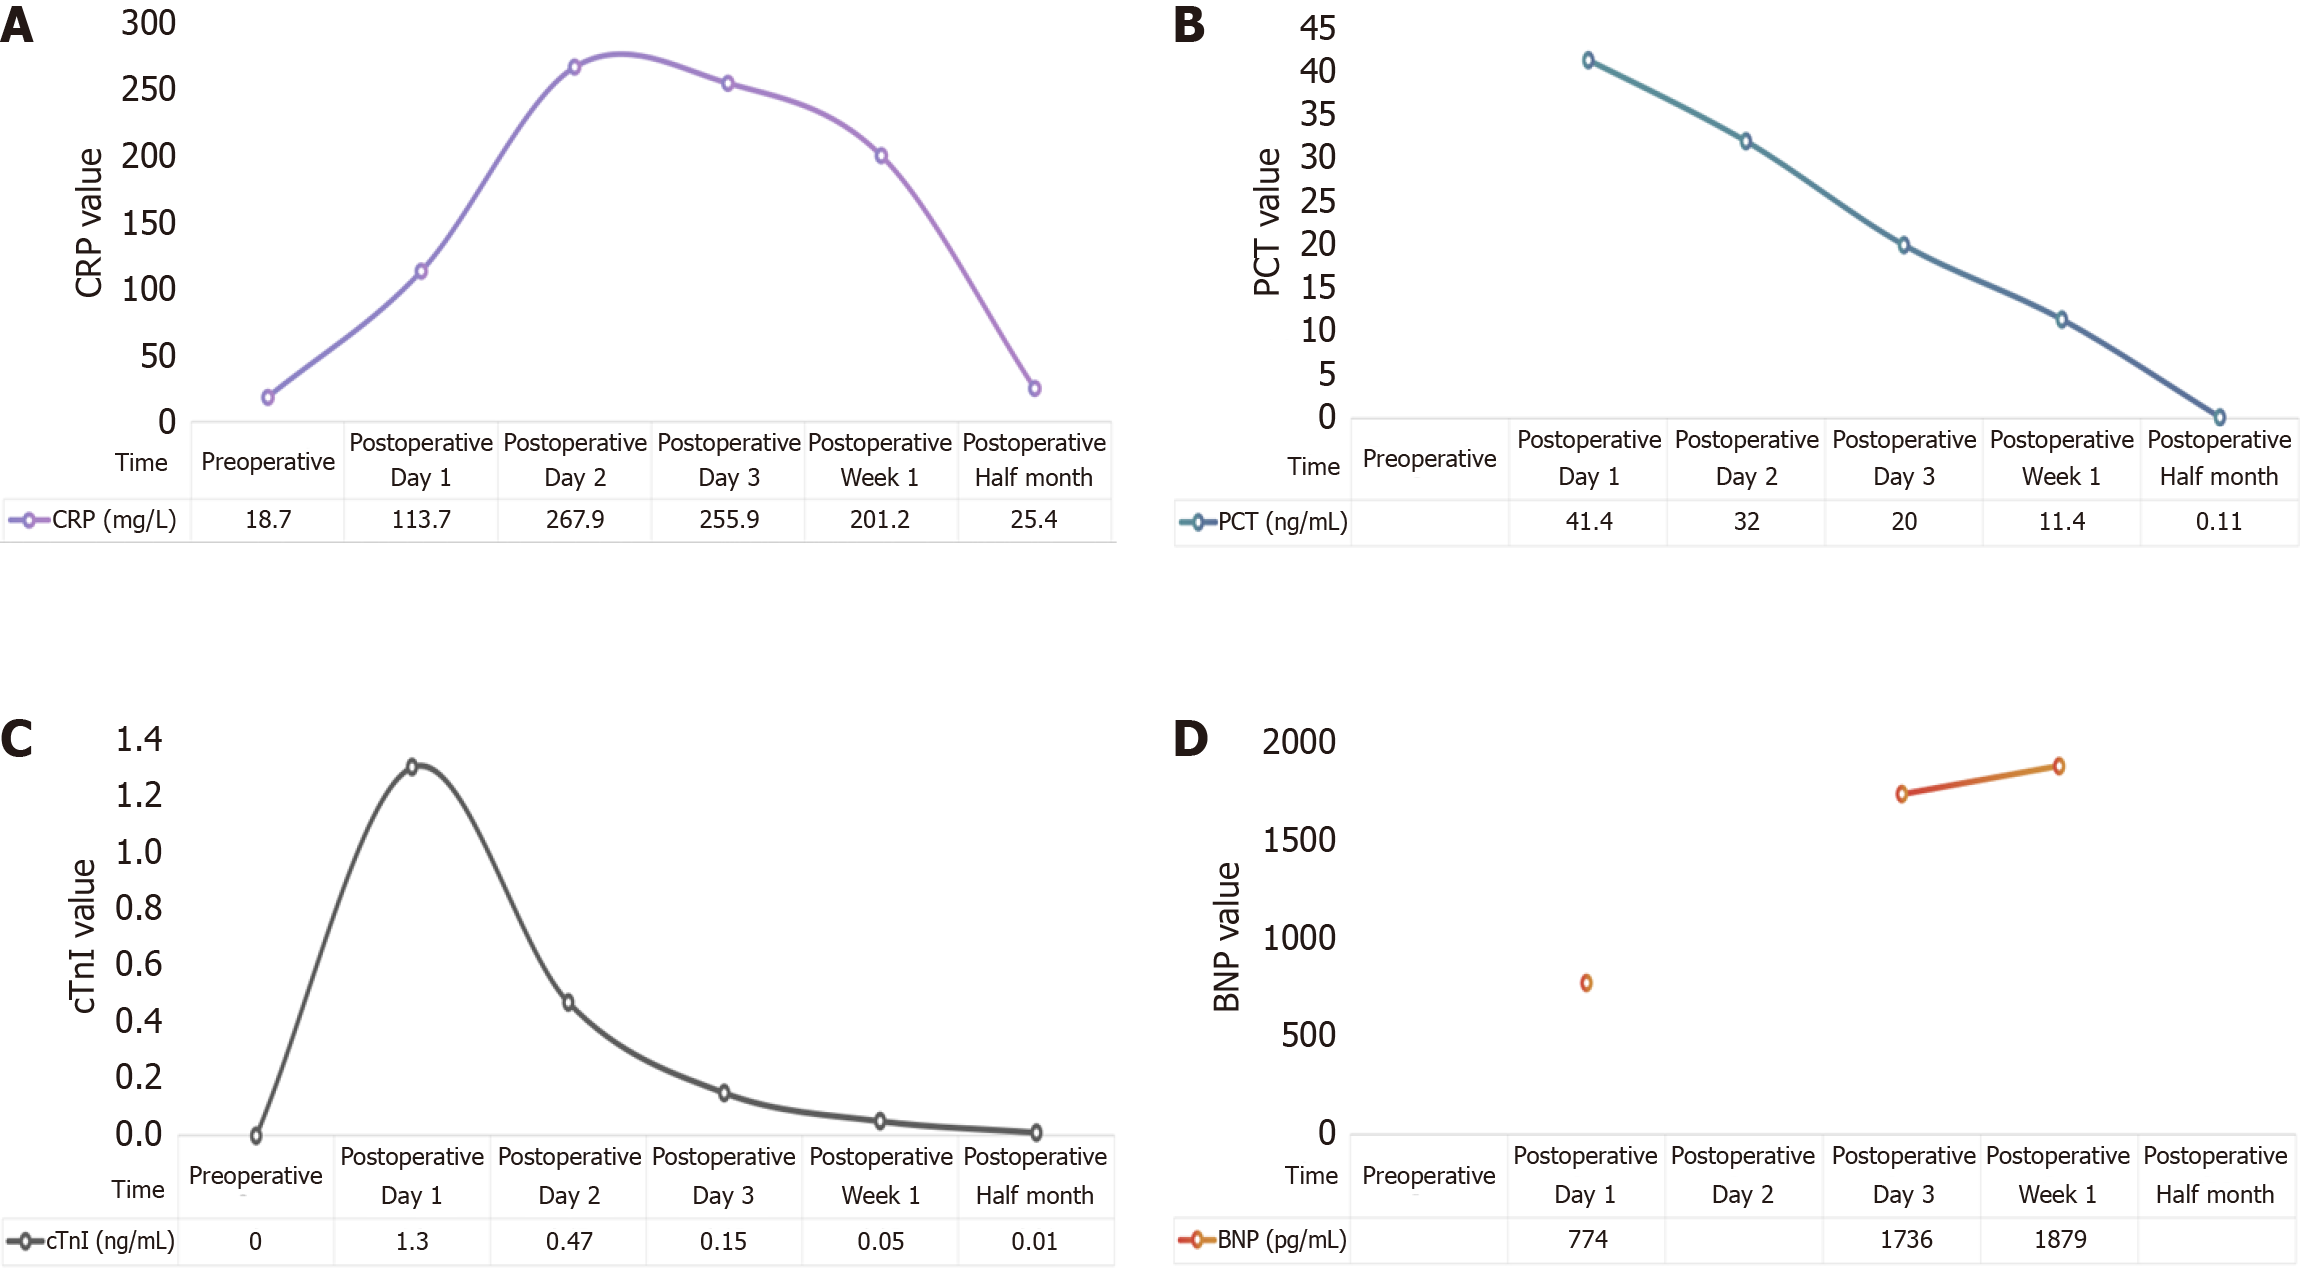
Figure 3 Evolution of blood biomarkers.
A: C-reactive protein; B: Procalcitonin; C: Cardiac troponin I; D: B-type natriuretic peptide. CRP: C-reactive protein; PCT: Procalcitonin; cTnI: Cardiac troponin I; BNP: B-type natriuretic peptide.
- Citation: Hu RR, Liu M, Li HY. Primary squamous cell carcinoma of the descending colon with pancreatic metastasis: A case report. World J Gastrointest Oncol 2025; 17(6): 107272
- URL: https://www.wjgnet.com/1948-5204/full/v17/i6/107272.htm
- DOI: https://dx.doi.org/10.4251/wjgo.v17.i6.107272


