Copyright
©The Author(s) 2025.
World J Gastrointest Oncol. Jun 15, 2025; 17(6): 106608
Published online Jun 15, 2025. doi: 10.4251/wjgo.v17.i6.106608
Published online Jun 15, 2025. doi: 10.4251/wjgo.v17.i6.106608
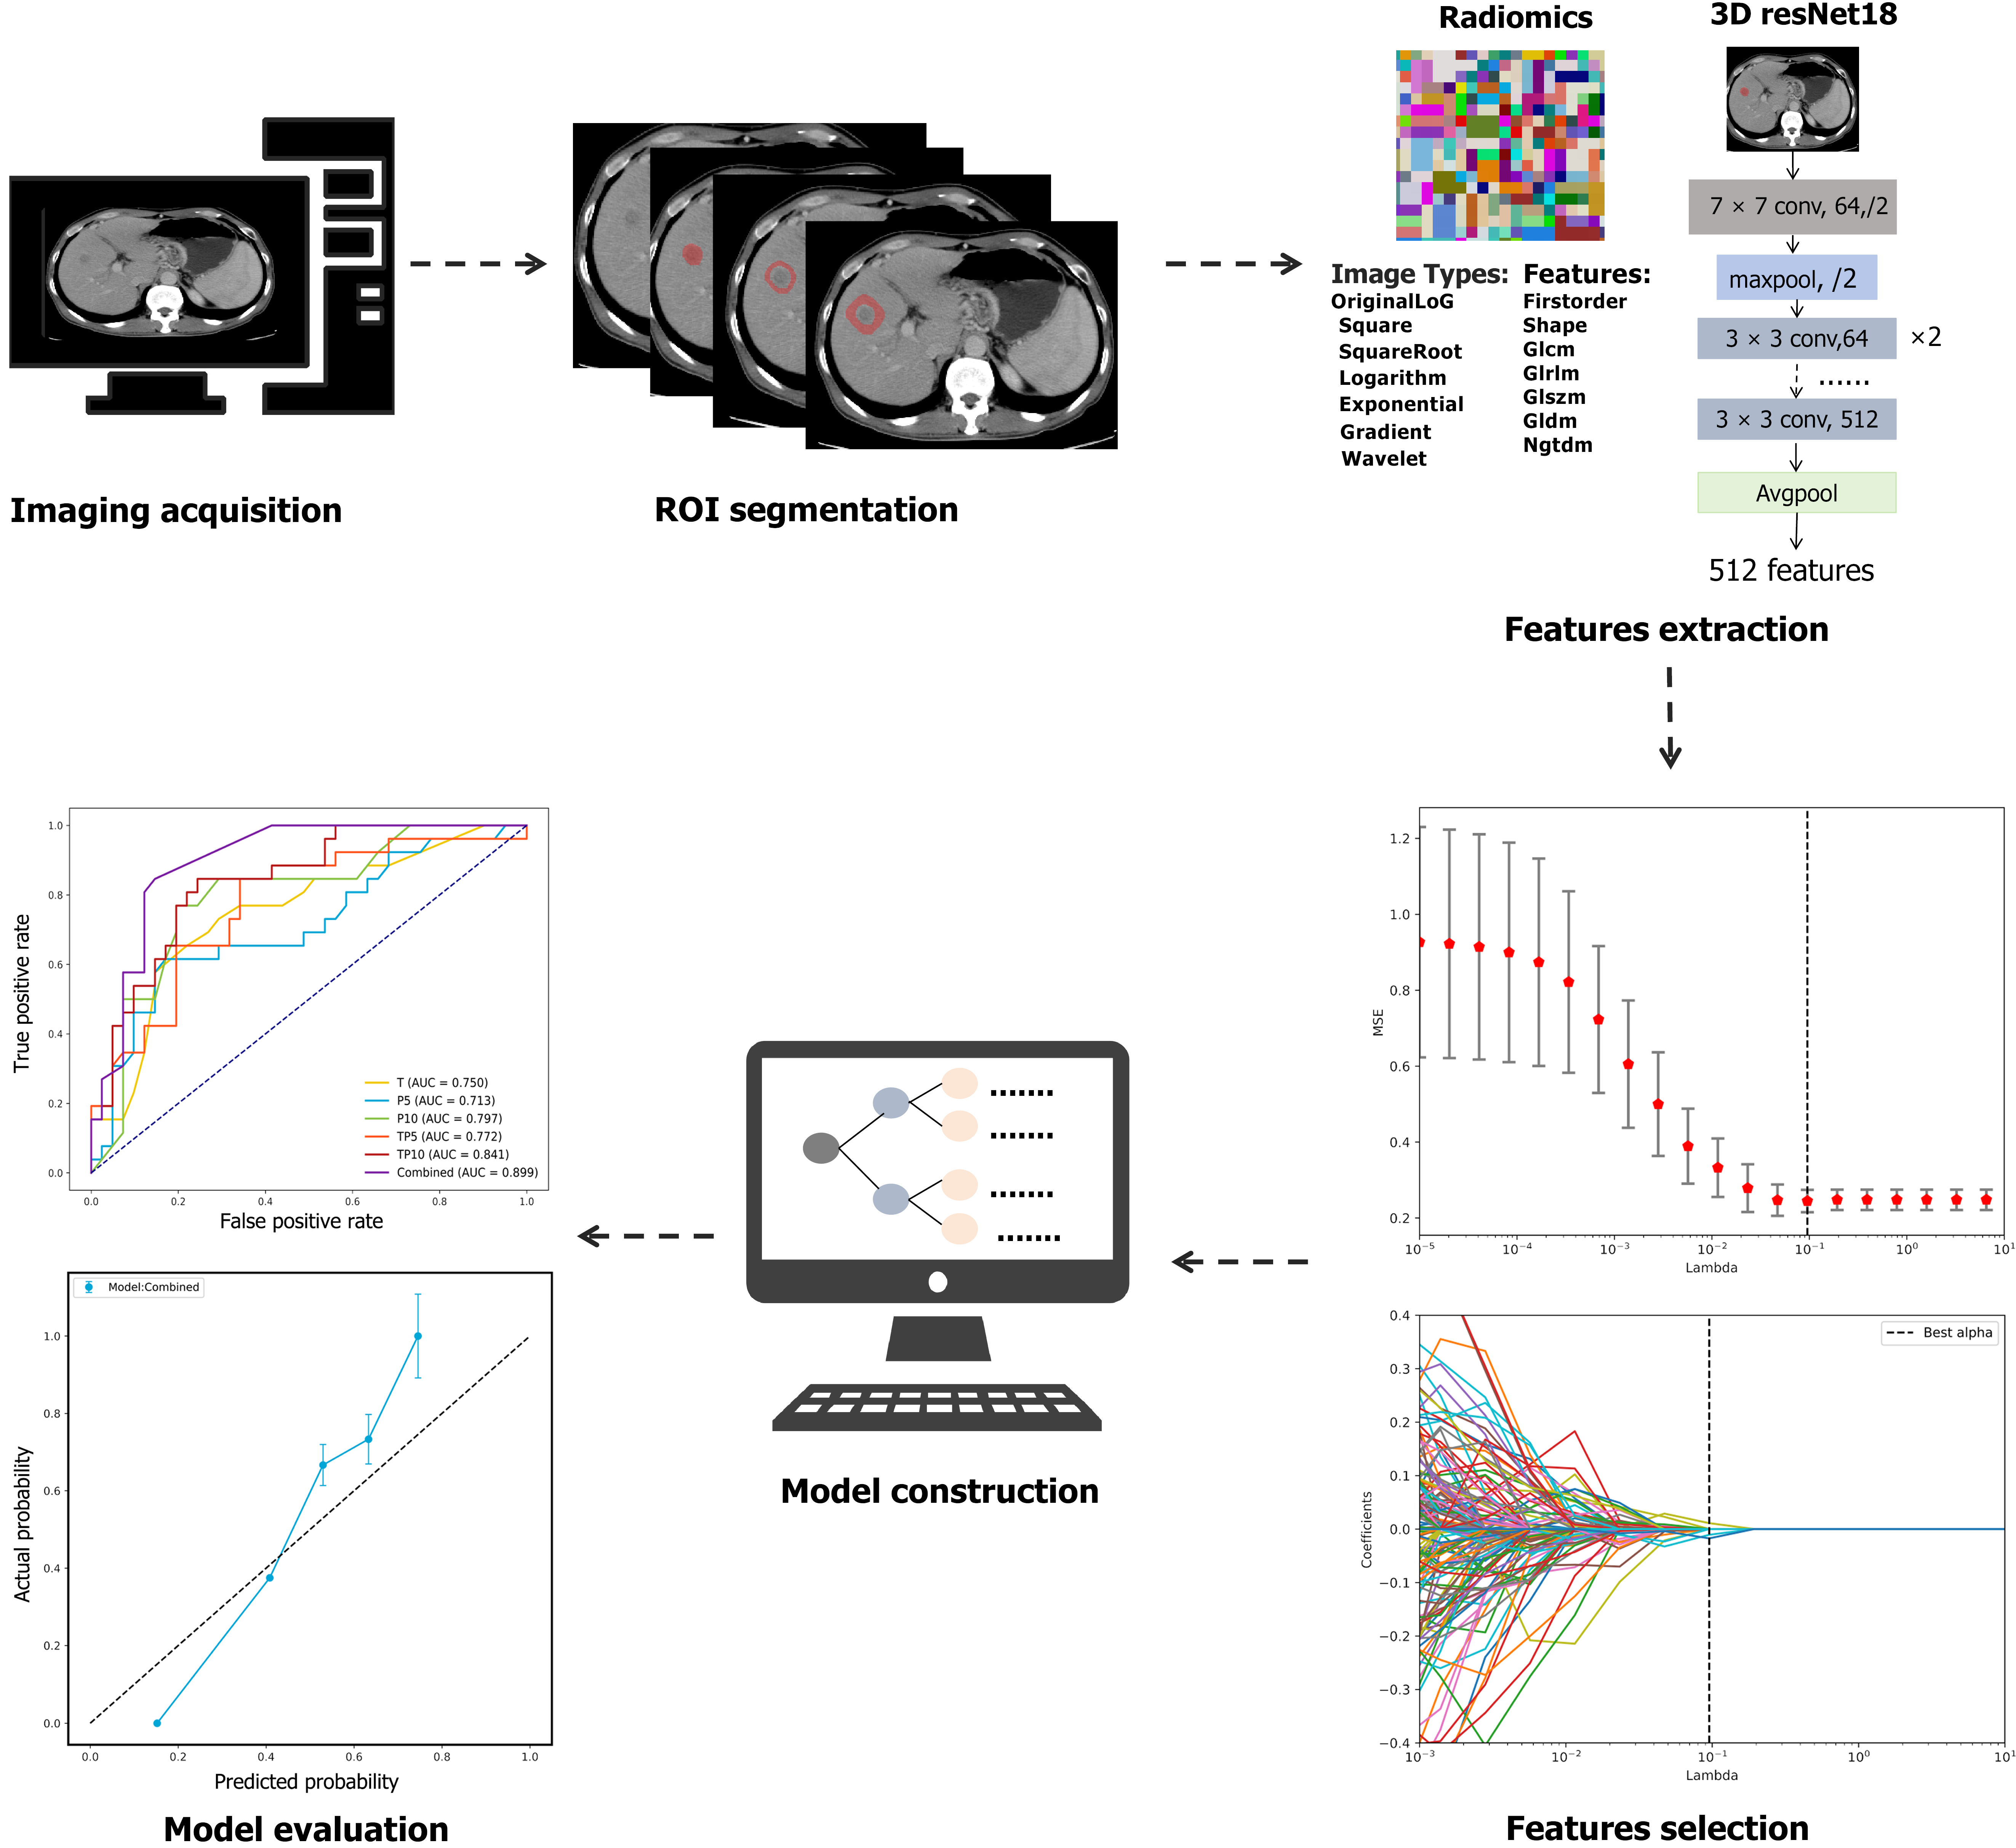
Figure 1 A diagram of the research process.
ROI: Region of interest.
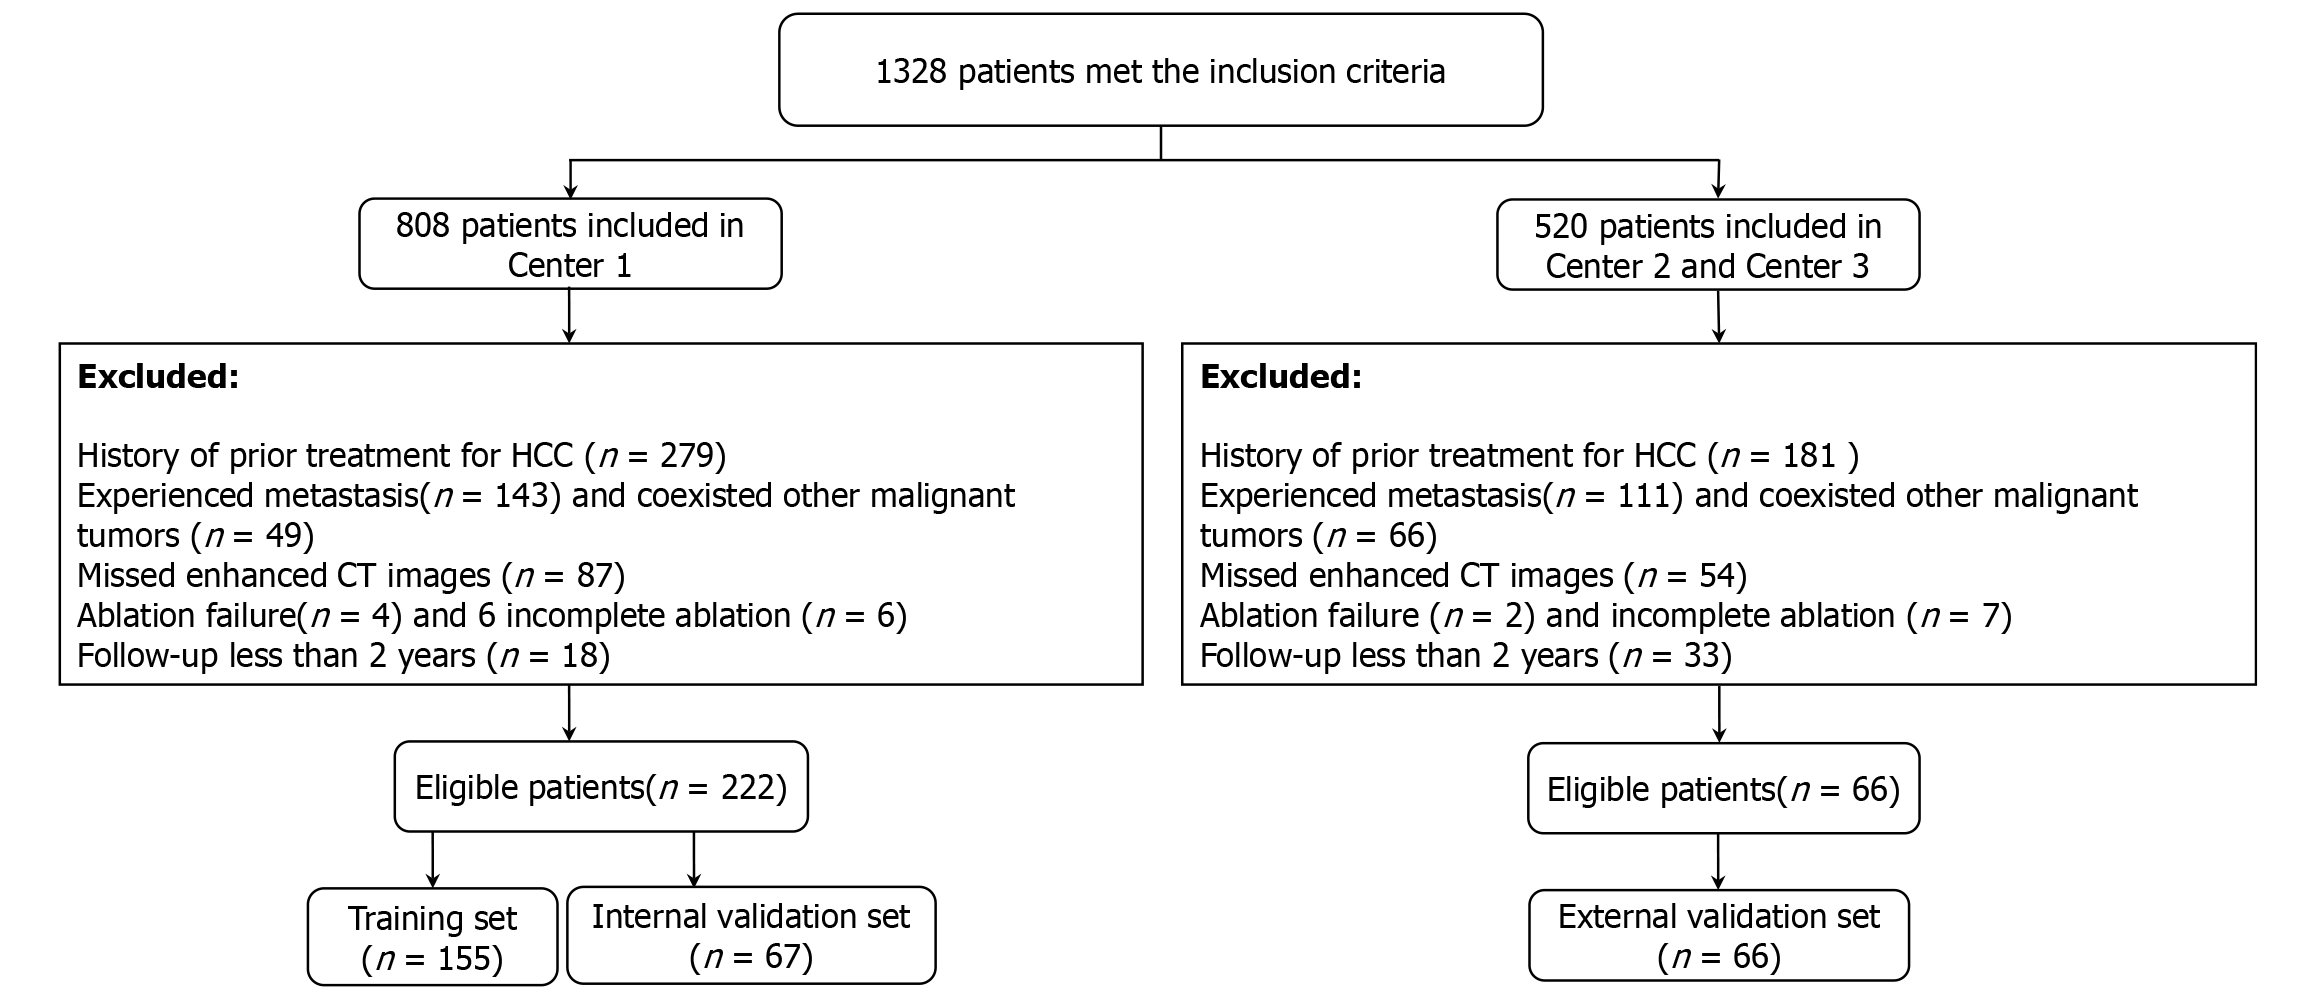
Figure 2 The process of patient selection.
CT: Computed tomography; HCC: Hepatocellular carcinoma.
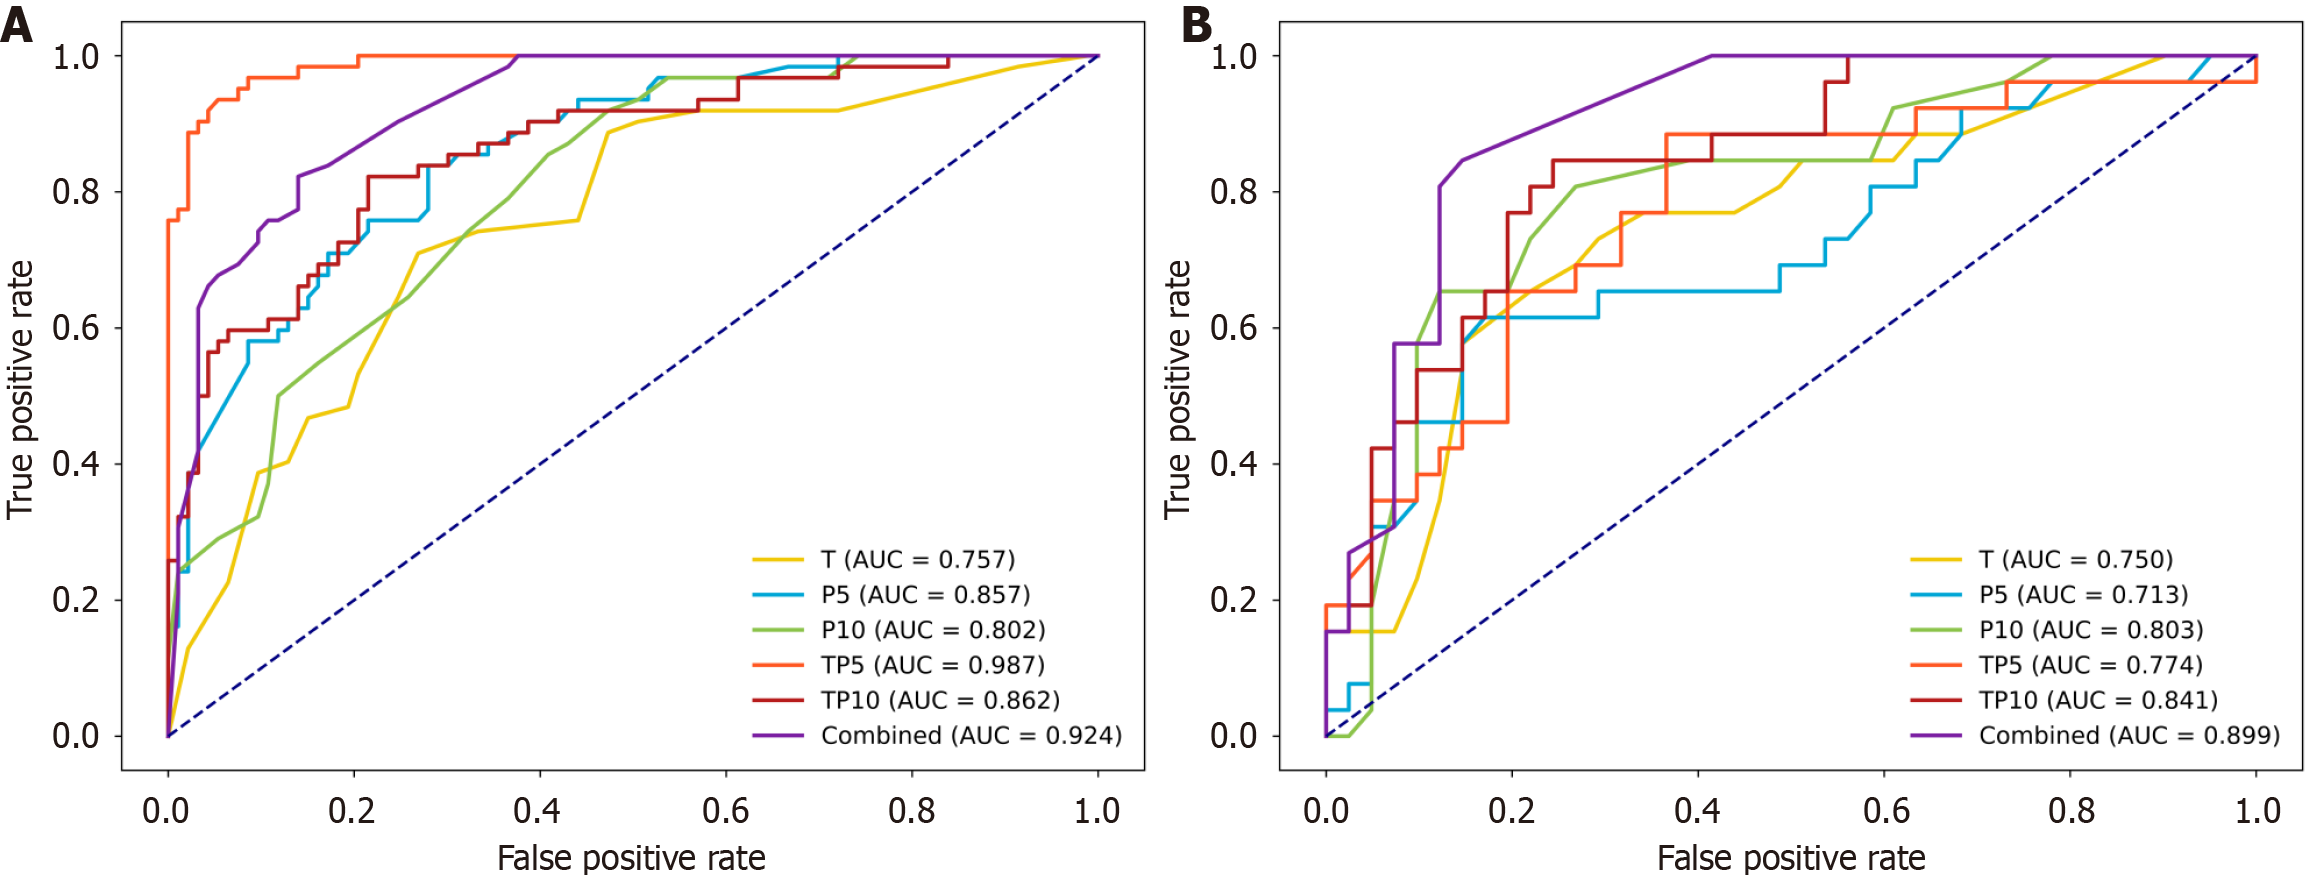
Figure 3 Comparative analysis of area under the receiver operating characteristic curve for the six models.
A: Comparison of area under the receiver operating characteristic curve (AUC) for the six models on the training set; B: Comparison of AUC for the six models on the internal validation set. AUC: Area under the receiver operating characteristic curve; Combined: The model that incorporates features from all regions—tumor, 5 mm, and 10 mm; P5: The 5 mm peri-tumor model; P10: The 10 mm peri-tumor model; T: The tumor-only model; TP5: The tumor-peri-tumor 5 mm model; TP10: The tumor-peri-tumor 10 mm model.
Figure 4 Area under the receiver operating characteristic curve curves for training set, internal validation set, and external validation set.
A: Area under the receiver operating characteristic curve (AUC) for the training set; B: AUC for the internal validation set; C: AUC for the external validation set. AUC: Area under the receiver operating characteristic curve; Combined: The model that incorporates features from all regions—tumor, 5 mm, and 10 mm.
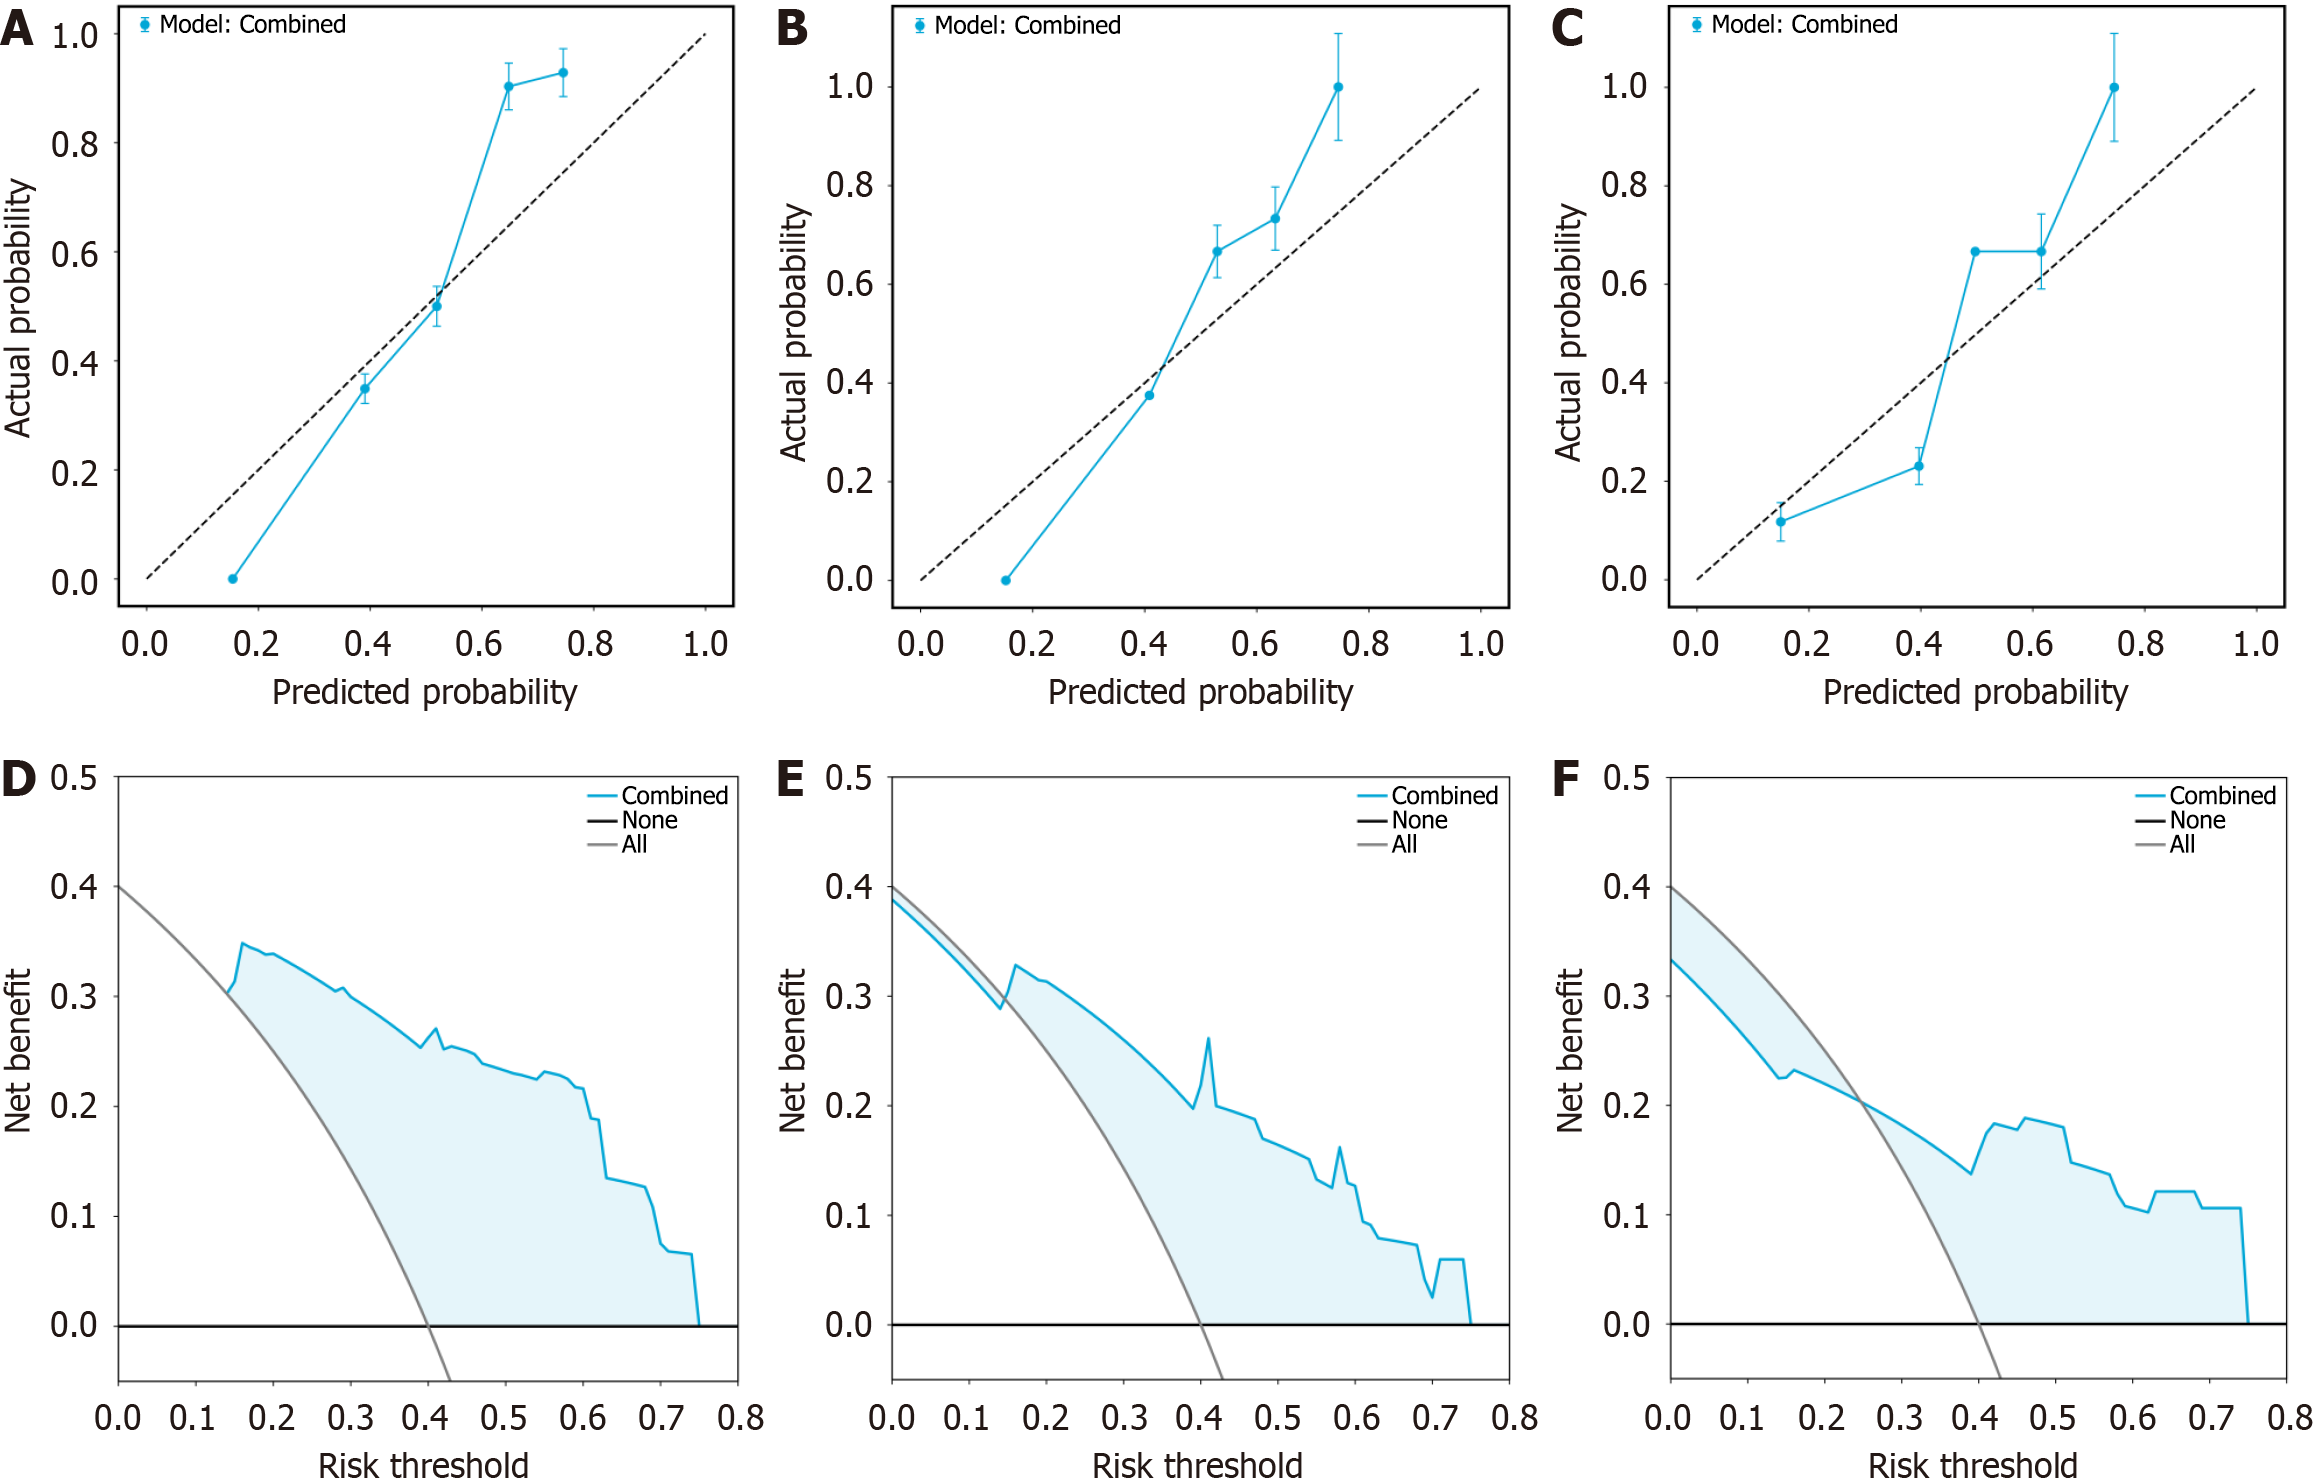
Figure 5 Calibration curve and decision curve analysis curve of the model that incorporates features from all regions—tumor, 5 mm, and 10 mm model.
A: Represent the calibration curves of the model that incorporates features from all regions—tumor, 5 mm, and 10 mm (combined) model on the training set, internal validation set, and external validation set, respectively; B: Represent the calibration curves of the combined model on the internal validation set; C: Represent the calibration curves of the combined model on the external validation set; D: Represent the decision curve analysis (DCA) curves of the combined model on the training set; E: Represent the DCA curves of the combined model on the internal validation set; F: Represent the DCA curves of the combined model on the external validation set. Combined: The model that incorporates features from all regions—tumor, 5 mm, and 10 mm.
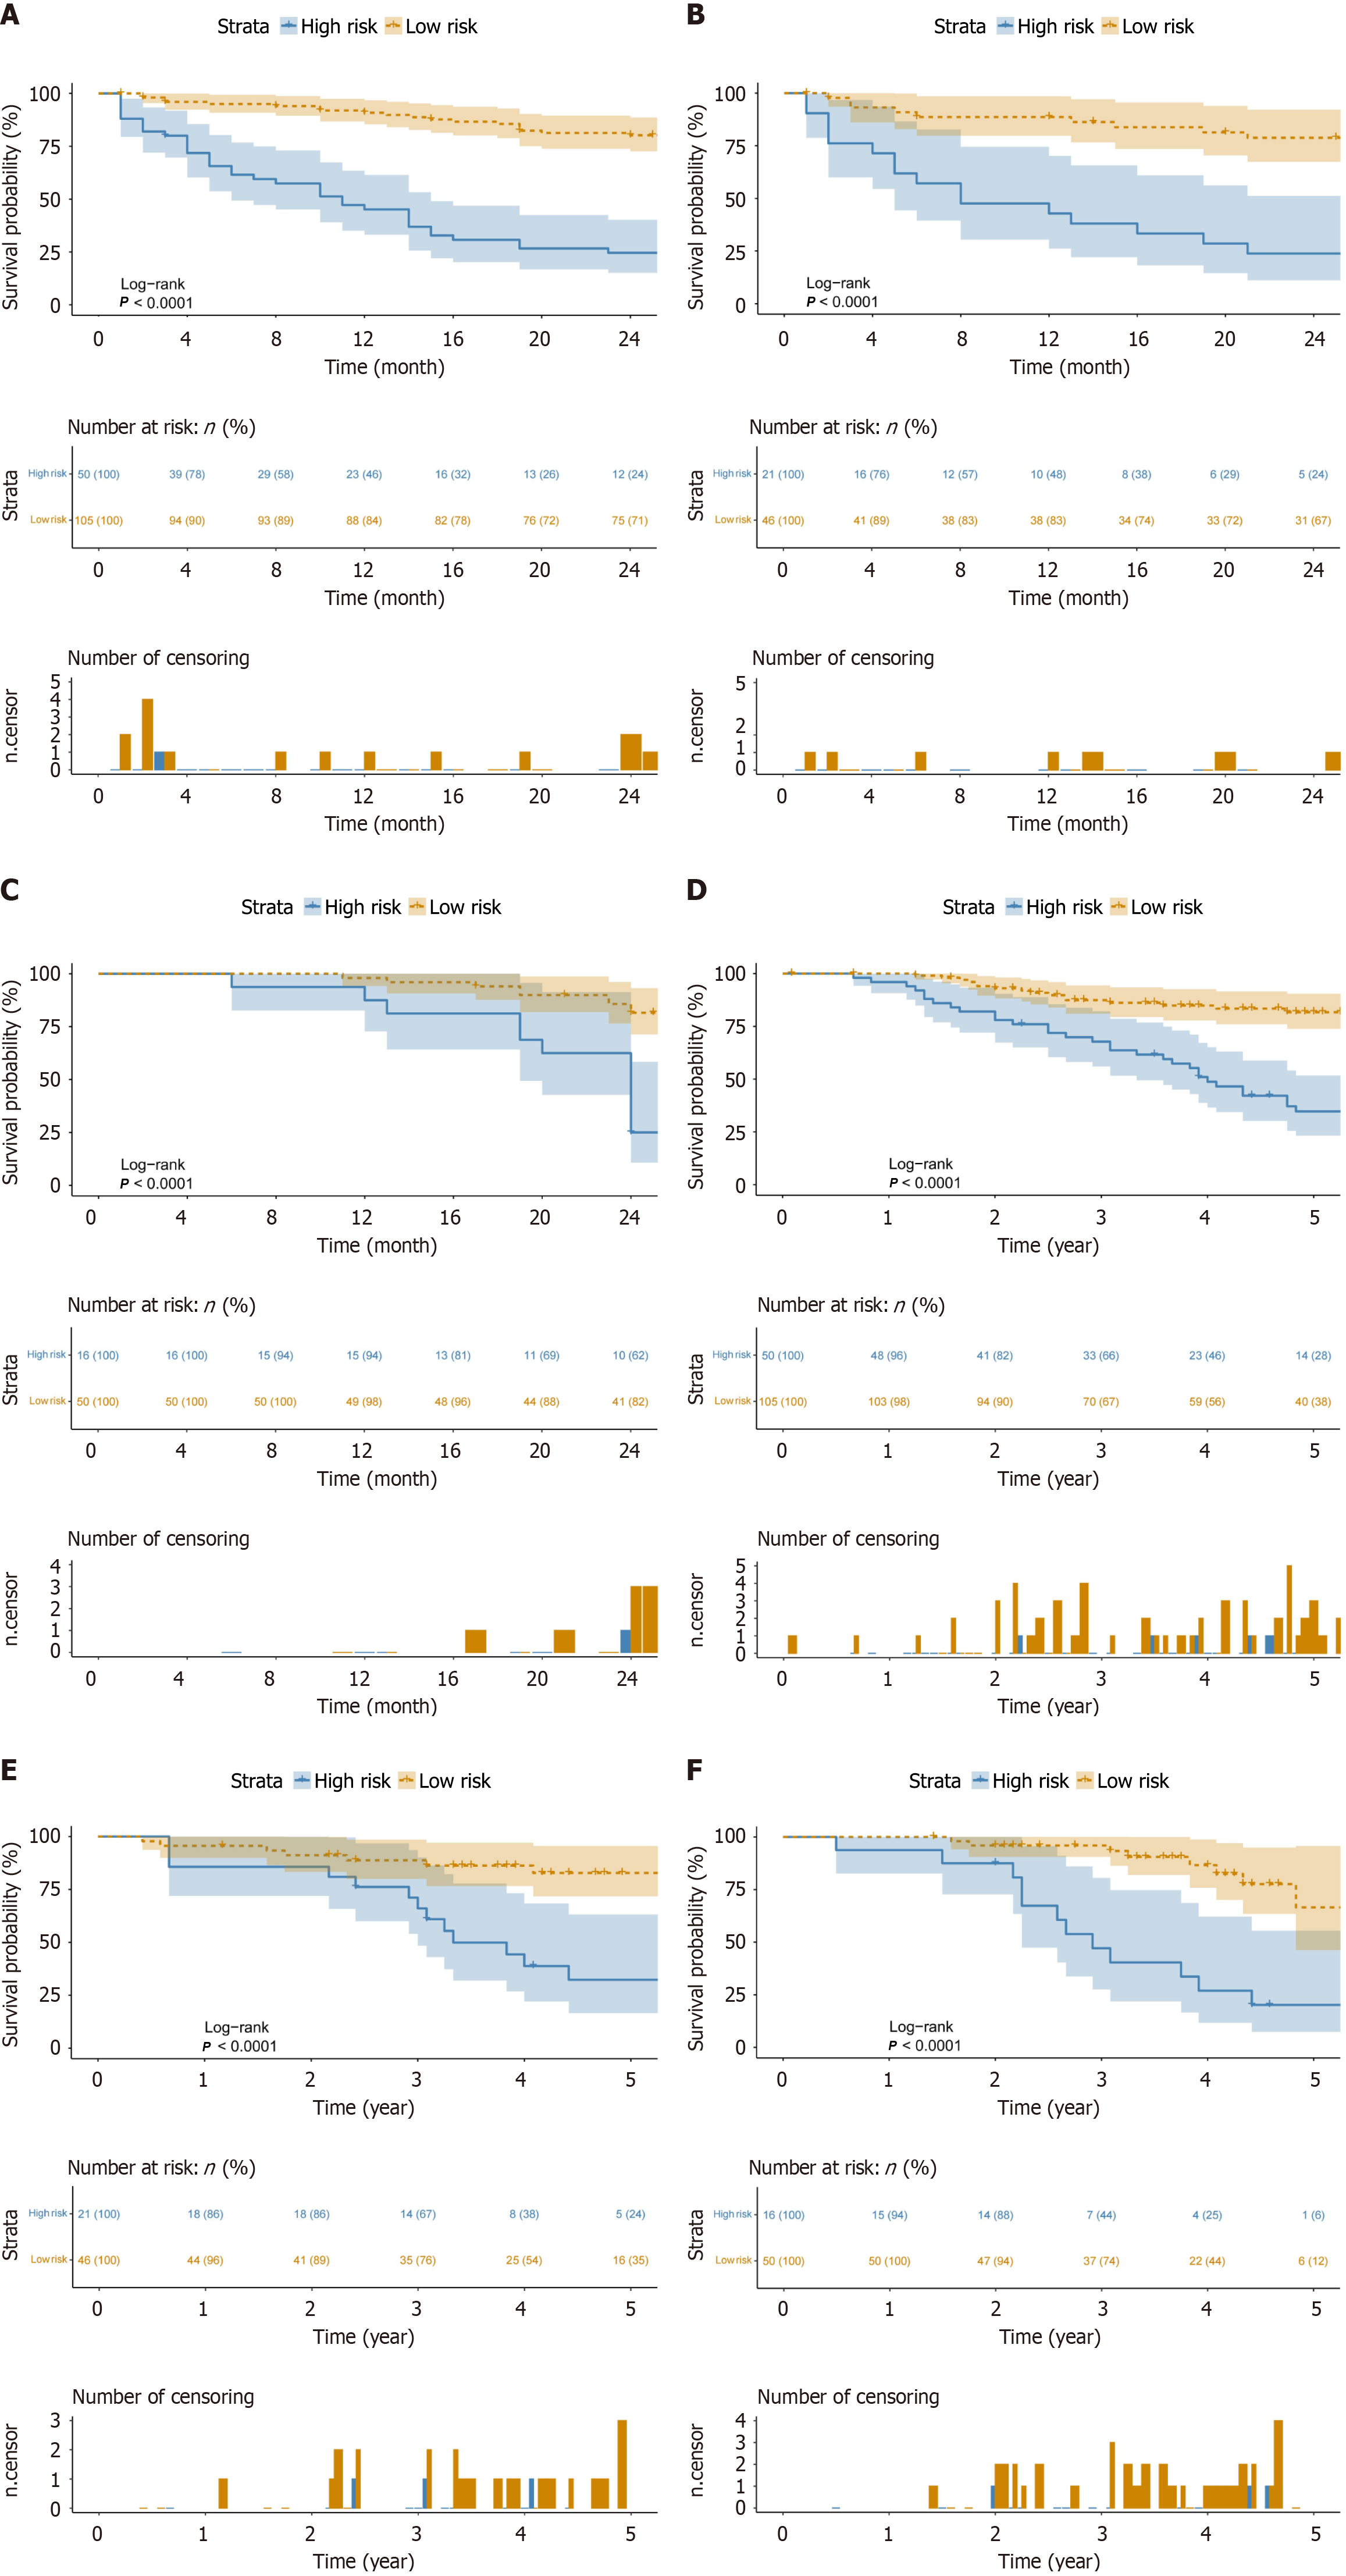
Figure 6 Kaplan-Meier curves for 2-year progression-free survival and 5-year overall survival for the training set, internal validation set, and external validation set.
A: Represent Kaplan-Meier (K-M) curves for 2-year progression-free survival (PFS) of the training set; B: Represent K-M curves for 2-year PFS of the internal validation set; C: Represent K-M curves for 2-year PFS of the external validation set; D: Represent K-M curves for 5-year overall survival (OS) of the training set; E: Represent K-M curves for 5-year OS of the internal validation set; F: Represent K-M curves for 5-year OS of the external validation set.
- Citation: Li YH, Qian GX, Yao L, Lei XD, Zhu Y, Tang L, Xu ZL, Bu XY, Wei MT, Lu JL, Jia WD. Preoperative model for predicting early recurrence in hepatocellular carcinoma patients using radiomics and deep learning: A multicenter study. World J Gastrointest Oncol 2025; 17(6): 106608
- URL: https://www.wjgnet.com/1948-5204/full/v17/i6/106608.htm
- DOI: https://dx.doi.org/10.4251/wjgo.v17.i6.106608


