Copyright
©The Author(s) 2025.
World J Gastrointest Oncol. Jun 15, 2025; 17(6): 106393
Published online Jun 15, 2025. doi: 10.4251/wjgo.v17.i6.106393
Published online Jun 15, 2025. doi: 10.4251/wjgo.v17.i6.106393
Figure 1 Comparison of serum S100 calcium-binding protein A12 and soluble receptor for advanced glycation end products levels before chemotherapy between the study and control groups.
aP < 0.05. S100A12: S100 calcium-binding protein A12; sRAGE: Soluble receptor for advanced glycation end products; Control group: Healthy individuals; Study group: Elderly patients with colorectal cancer.
Figure 2 Comparison of serum S100 calcium-binding protein A12 and soluble receptor for advanced glycation end products levels before and after chemotherapy in patients with colorectal cancer.
aP < 0.05. S100A12: S100 calcium-binding protein A12; sRAGE: Soluble receptor for advanced glycation end products.
Figure 3 Comparison of serum S100 calcium-binding protein A12 and soluble receptor for advanced glycation end products levels before chemotherapy in patients with colorectal cancer with different chemotherapy responses.
aP < 0.05. S100A12: S100 calcium-binding protein A12; sRAGE: Soluble receptor for advanced glycation end products.
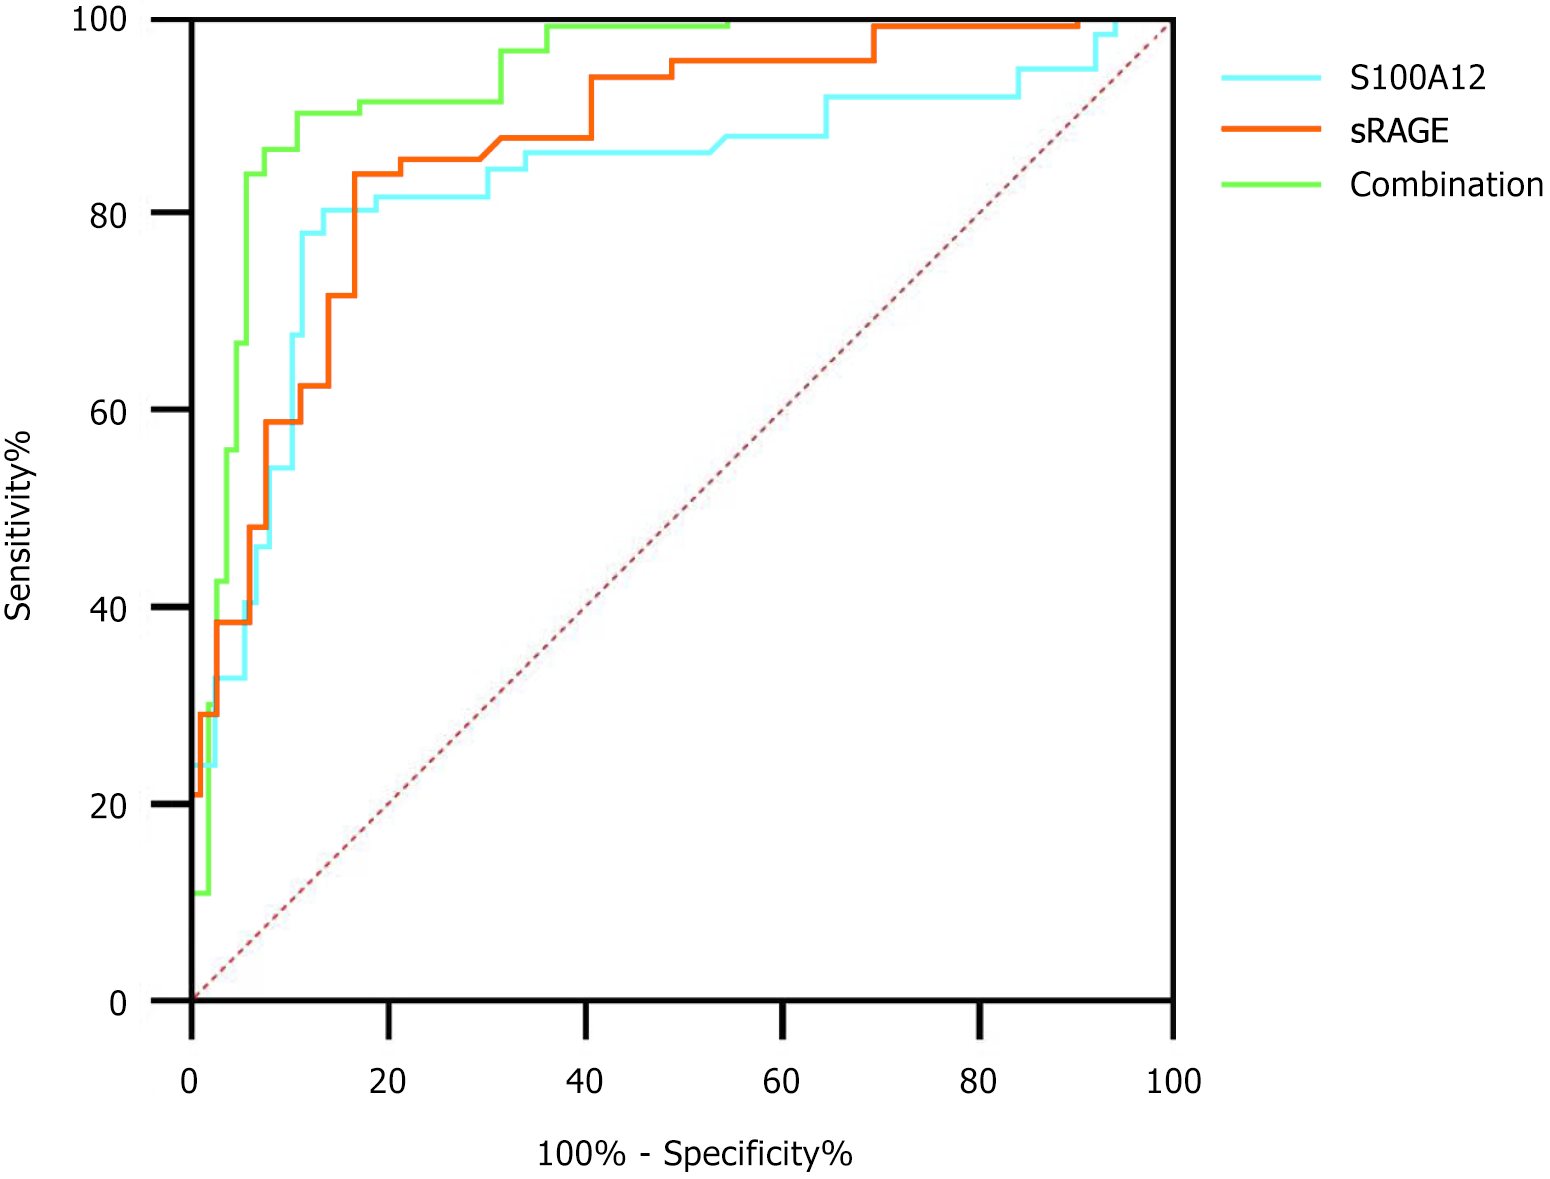
Figure 4 Receiver operating characteristic curve for the predictive diagnostic value of pre-chemotherapy serum S100 calcium-binding protein A12 and soluble receptor for advanced glycation end products levels for chemotherapy ineffectiveness in colorectal cancer.
The receiver operating characteristic curve highlighted the superior predictive accuracy of the combined S100 calcium-binding protein A12/soluble receptor for advanced glycation end products model (green line) compared to individual biomarkers. The diagonal reference line (dashed line) represents random chance (area under the curve = 0.5). S100A12: S100 calcium-binding protein A12; sRAGE: Soluble receptor for advanced glycation end products.
- Citation: Qiao SB, Niu ML, Liang WT, Zhang LJ, Chen X, Zhu YK. Analysis of serum S100A12, soluble advanced glycation end products receptor, and gut microbiome in elderly patients with colorectal cancer. World J Gastrointest Oncol 2025; 17(6): 106393
- URL: https://www.wjgnet.com/1948-5204/full/v17/i6/106393.htm
- DOI: https://dx.doi.org/10.4251/wjgo.v17.i6.106393


