Copyright
©The Author(s) 2025.
World J Gastrointest Oncol. Jun 15, 2025; 17(6): 106316
Published online Jun 15, 2025. doi: 10.4251/wjgo.v17.i6.106316
Published online Jun 15, 2025. doi: 10.4251/wjgo.v17.i6.106316
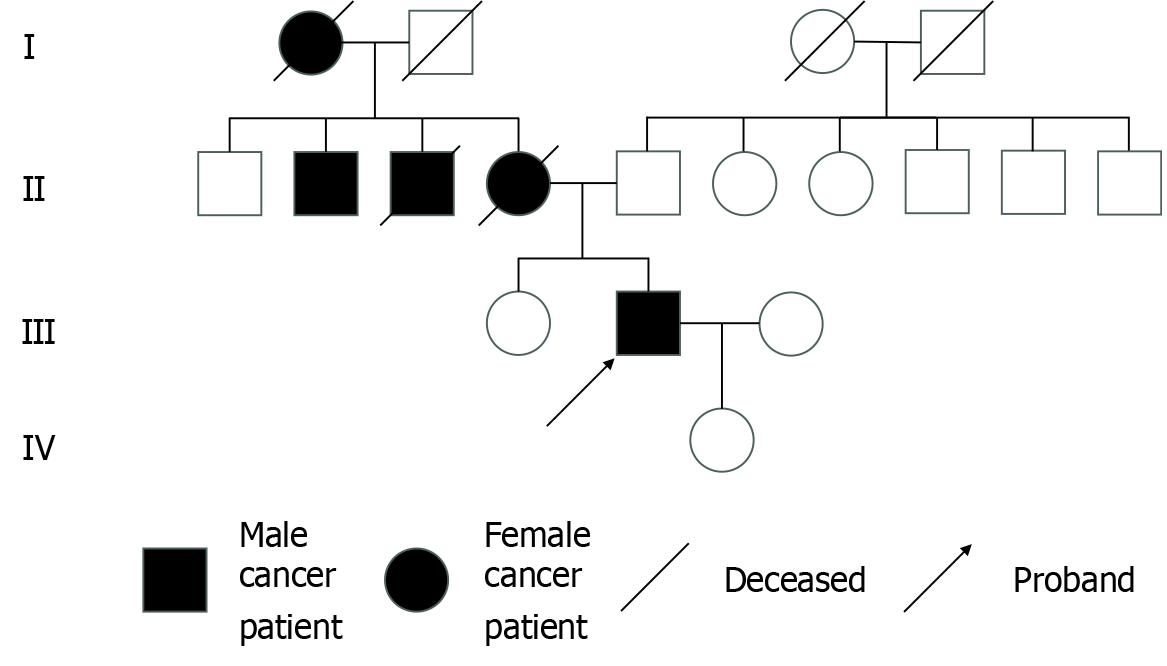
Figure 1
Patient family map.
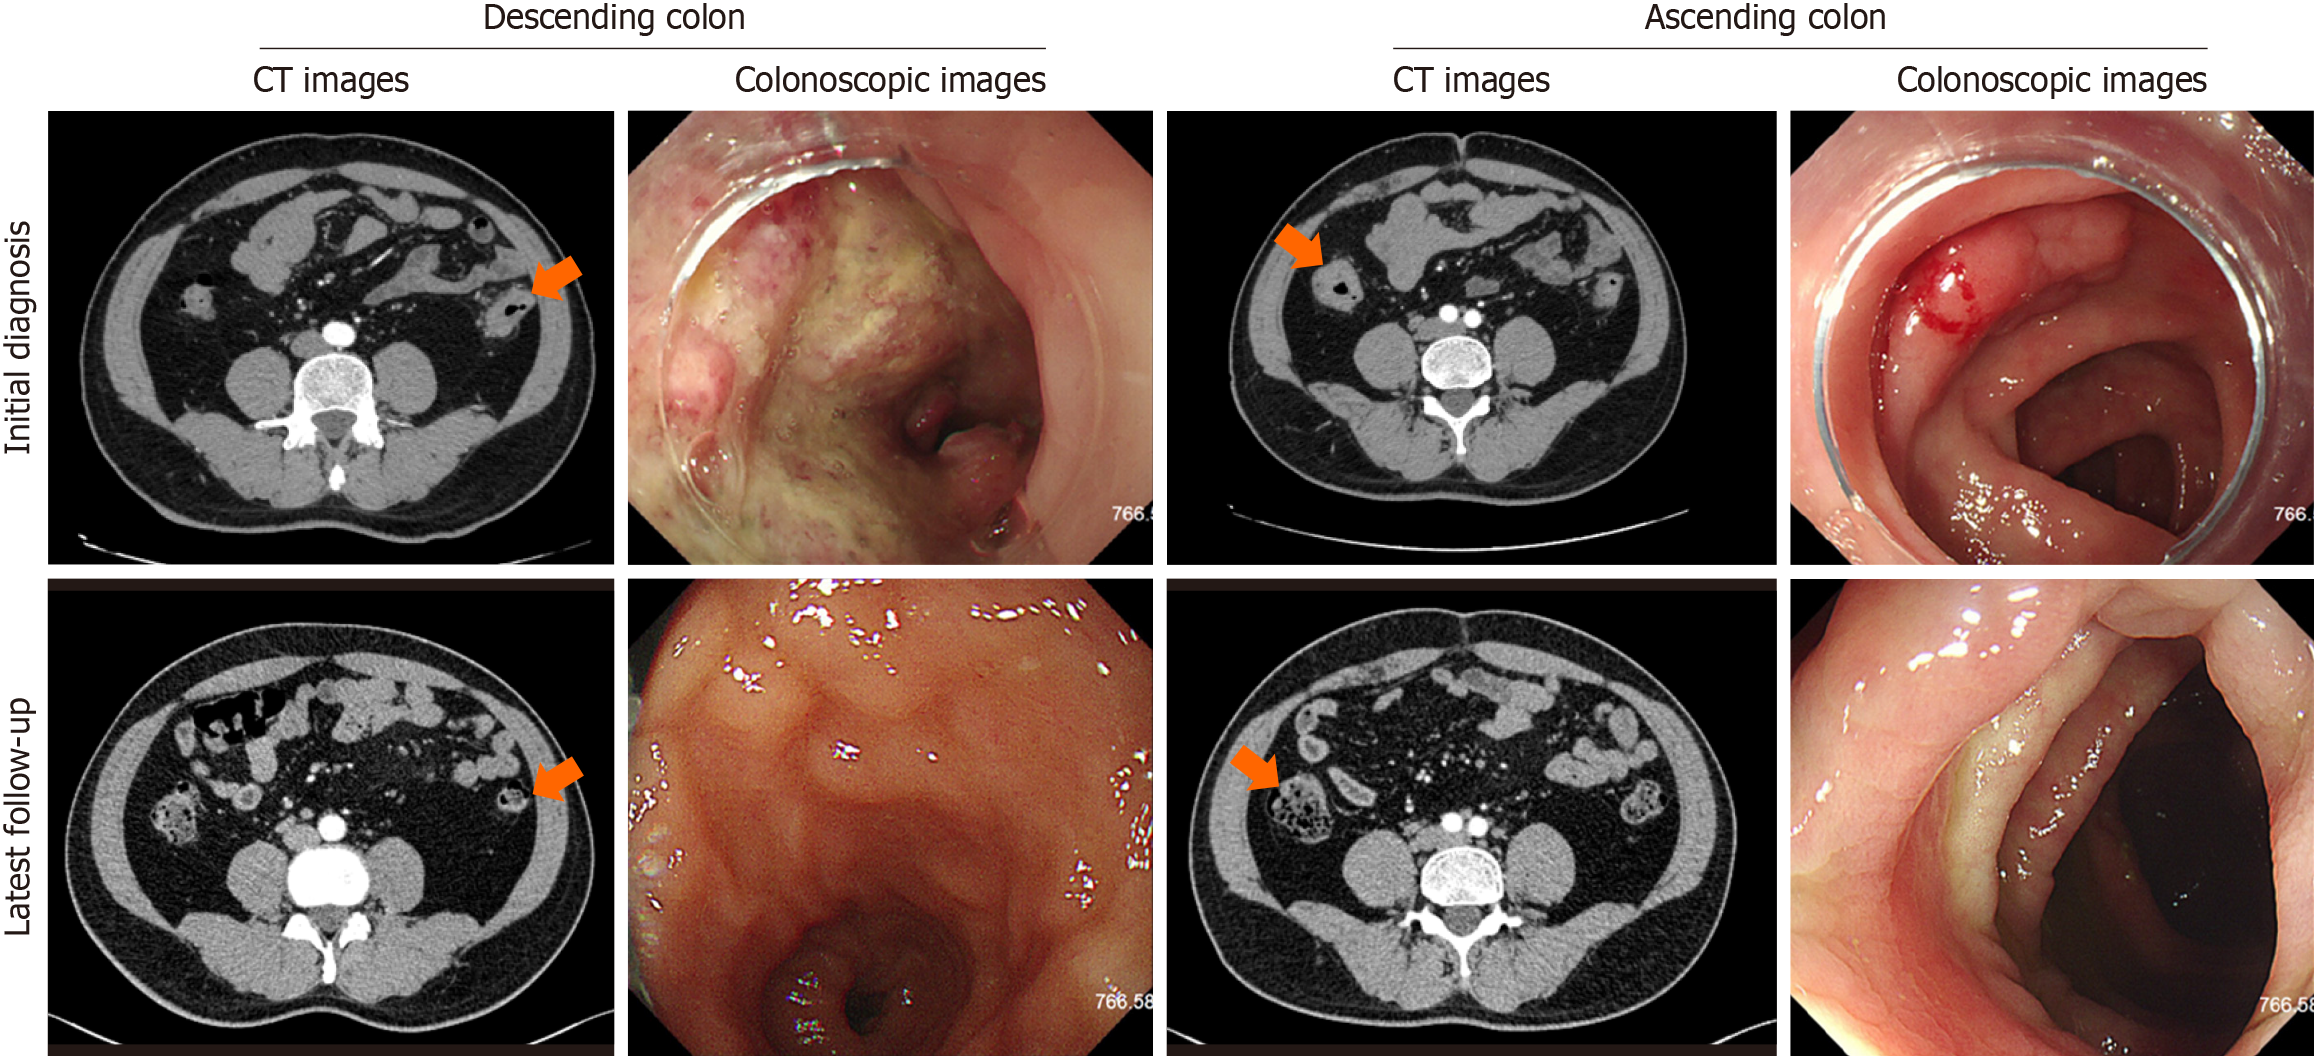
Figure 2 Computed tomography and colonoscopy images.
Computed tomography and colonoscopy images of the descending and ascending colon, comparing initial diagnosis and latest follow-up, demonstrating anatomical and intestinal morphology changes over time (the orange arrows indicate changes before and after treatment). CT: Computed tomography.
Figure 3 Comprehensive care timeline for lynch syndrome-associated multiple colorectal neoplasms, outlining key treatment stages, follow-up evaluations, multidisciplinary team consultations, and ongoing surveillance.
This visualization underscores the coordinated and structured management approach essential for effective care of this complex disease, emphasizing continuity and strategic planning. cCR: Complete clinical response; CT: Computed tomography; PET: Positron emission tomography; MRD: Molecular residual disease; MDT: Multidisciplinary team.
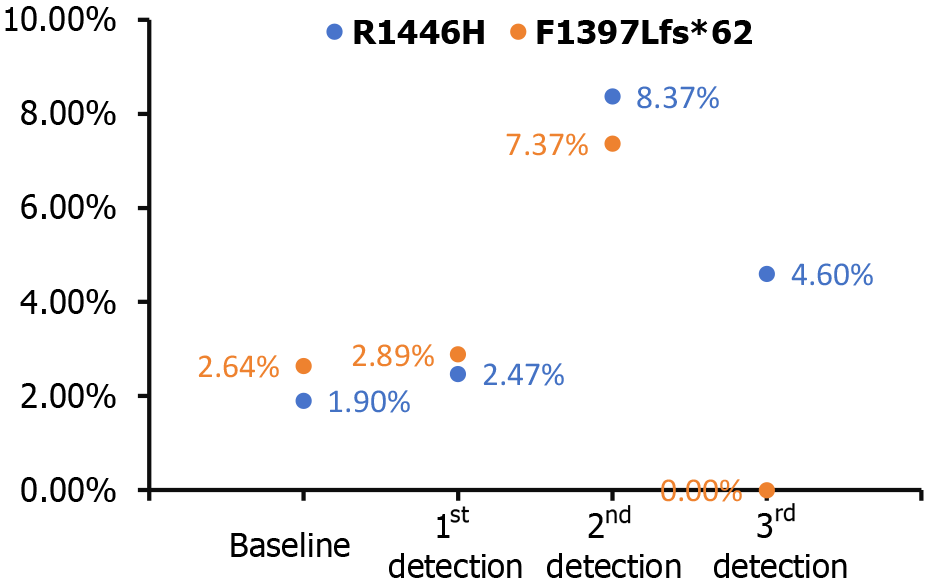
Figure 4 Dynamic changes in CREBBP gene expression levels at different time points in patients with specific mutations in exons 25 (F1397 Lfs*62) and 26 (R1446H).
Mutation abundance was calculated as the percentage of mutant reads relative to total reads at each position.
- Citation: Xu XX, Gao YH, Du CZ, Gao XX, Chen P, Fan RF, Li HT, Qiao Z. Molecular surveillance-informed personalized multidisciplinary therapy achieves prolonged survival in a patient with Lynch syndrome-associated colorectal cancer: A case report. World J Gastrointest Oncol 2025; 17(6): 106316
- URL: https://www.wjgnet.com/1948-5204/full/v17/i6/106316.htm
- DOI: https://dx.doi.org/10.4251/wjgo.v17.i6.106316


