Copyright
©The Author(s) 2025.
World J Gastrointest Oncol. Jun 15, 2025; 17(6): 106161
Published online Jun 15, 2025. doi: 10.4251/wjgo.v17.i6.106161
Published online Jun 15, 2025. doi: 10.4251/wjgo.v17.i6.106161
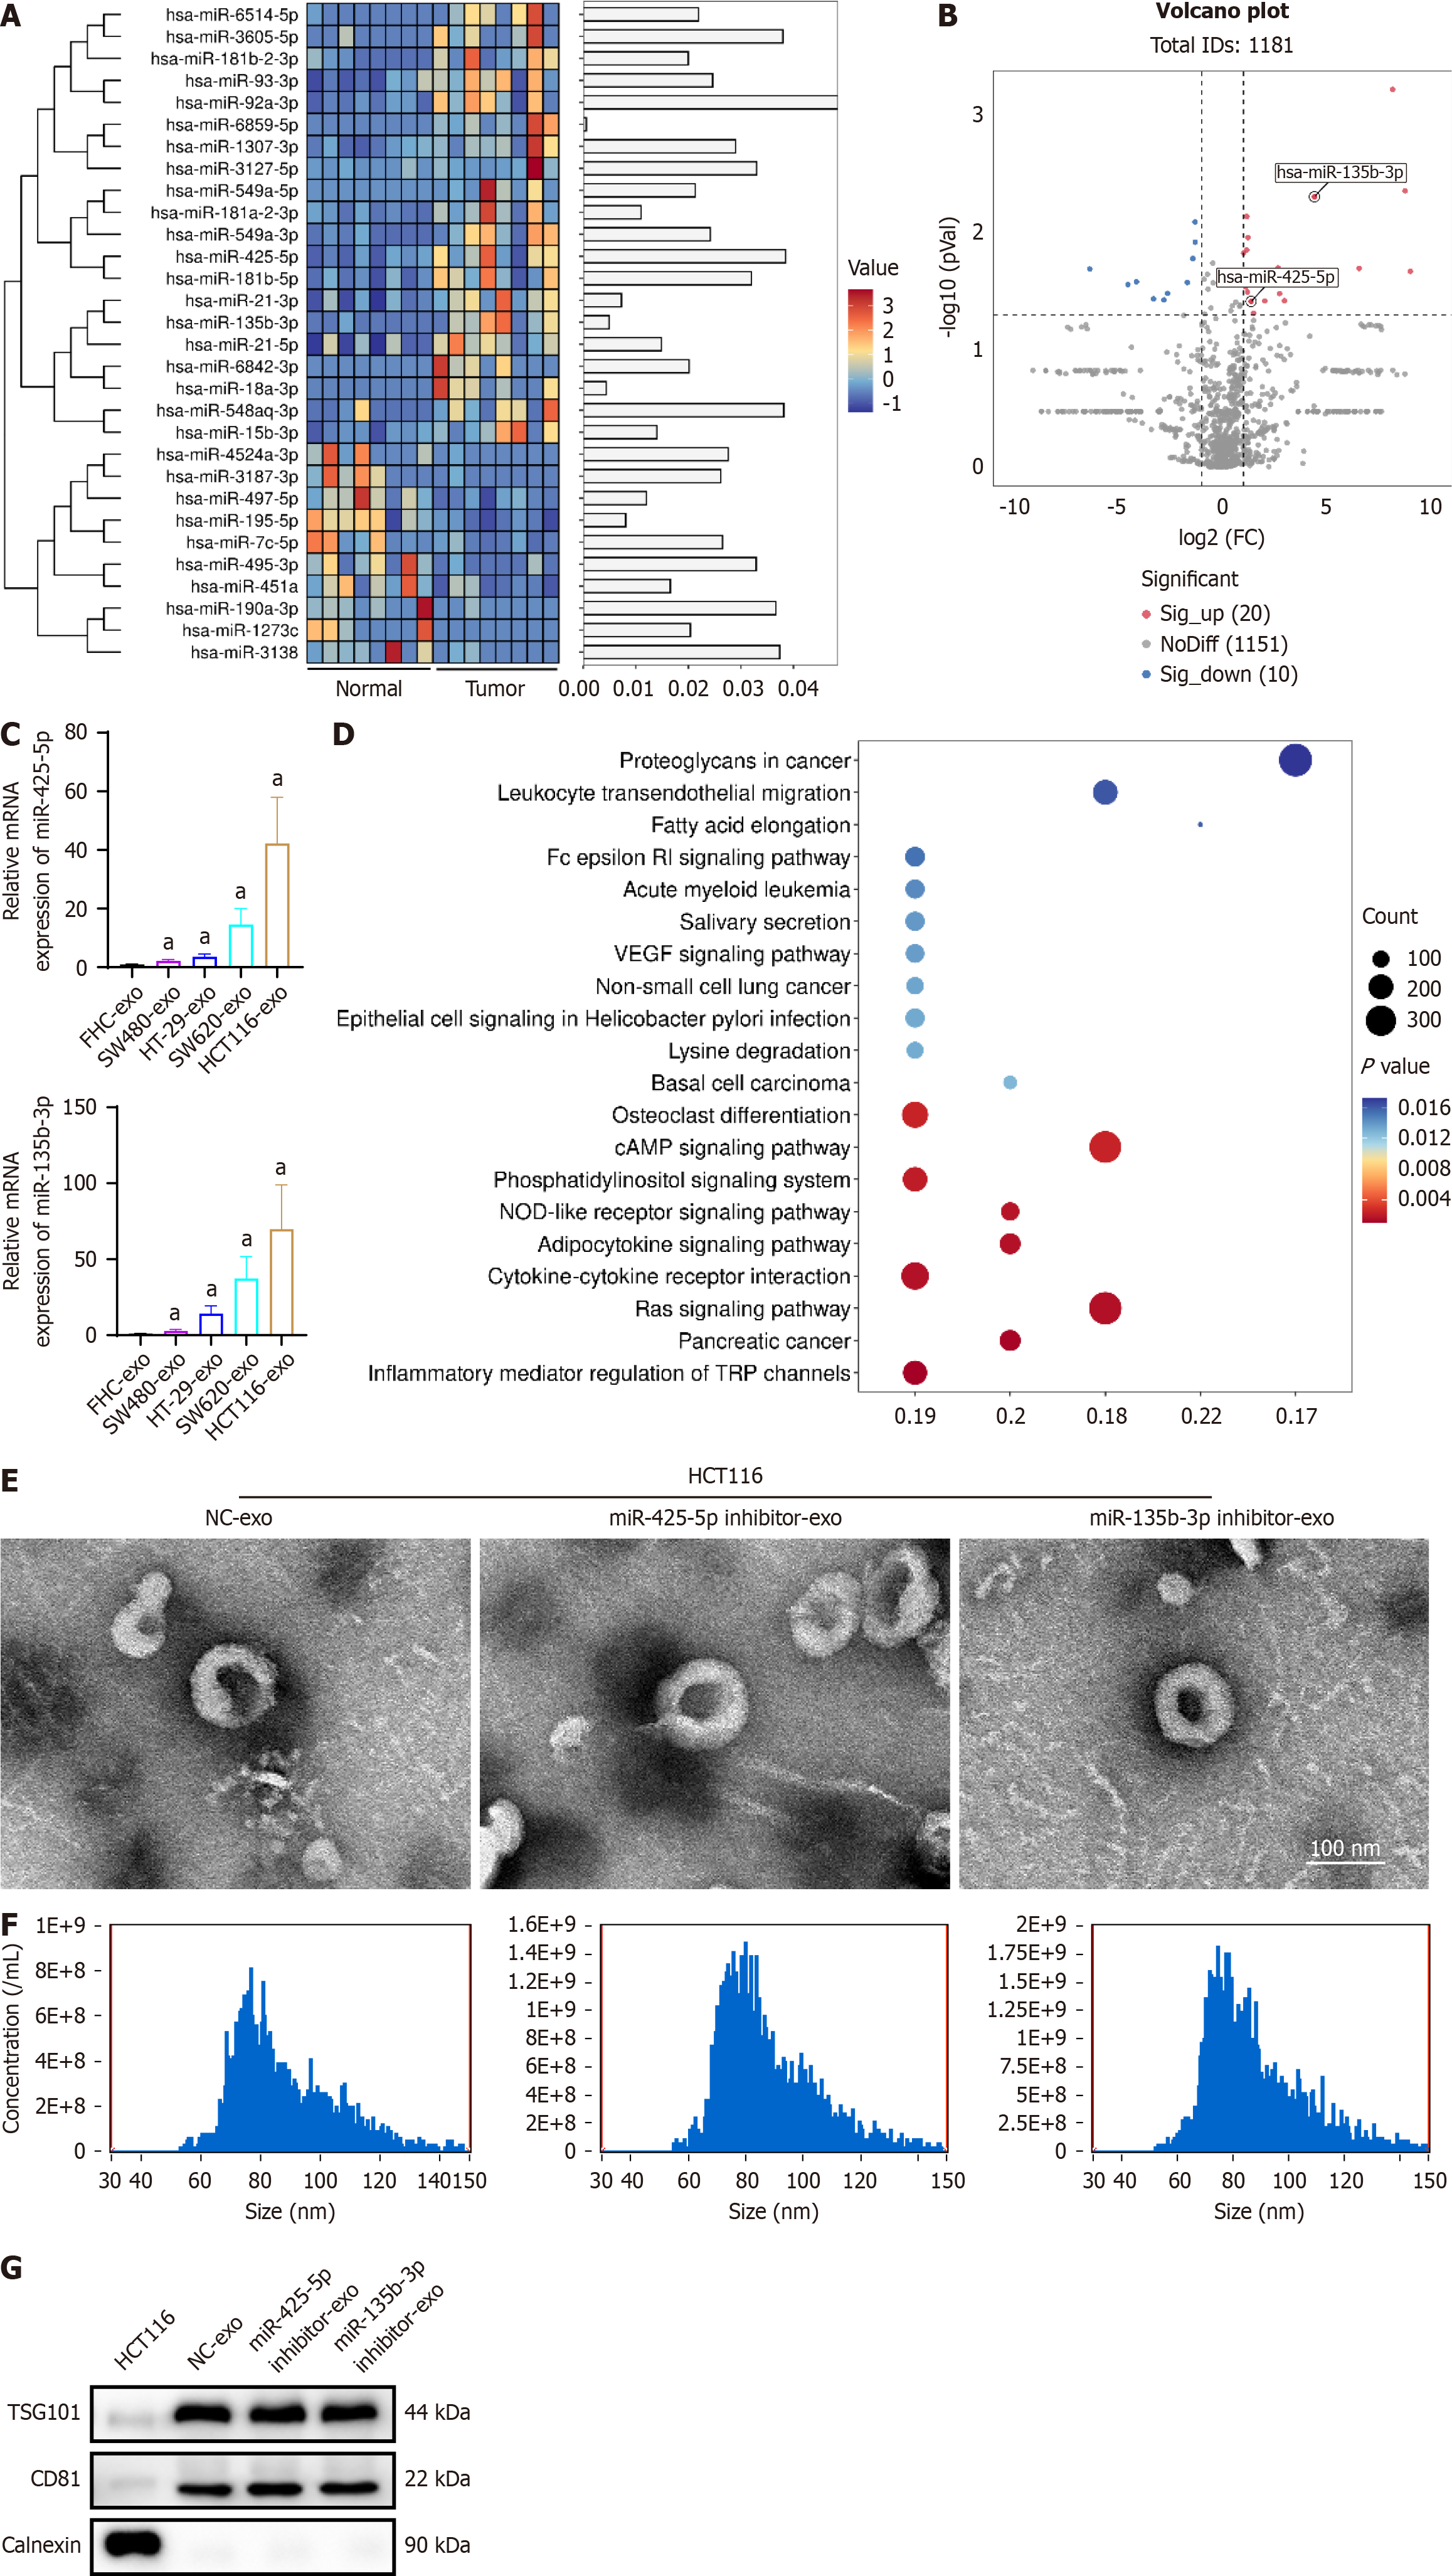
Figure 1 Exosomal miR-425-5p and miR-135b-3p are upregulated in colorectal cancer patients and cell lines.
A: Heatmap; B: Volcano plot of differentially expressed tissue exosomal microRNAs (miRNAs) between tumors tissues and normal adjacent tissues of colorectal cancer patients; C: Real-time quantitative polymerase chain reaction validation of miR-425-5p and miR-135b-3p from exosomes of colorectal cancer cell lines (SW480, HT-29, SW620, HCT116) and normal cells (FHC); D: Kyoto Encyclopedia of Genes and Genomes enrichment analyses of miR-425-5p and miR-135b-3p; E: Transmission electron microscopy images; F: Nanoparticle tracking analysis of exosomes isolated from HCT116 cells; G: Western blot analysis of exosomes isolated from HCT116 cells. aP < 0.05 vs FHC-exo (n = 3 per group). NC-exo: Negative control-exosome; TSG101: Tumor susceptibility gene 101 protein.
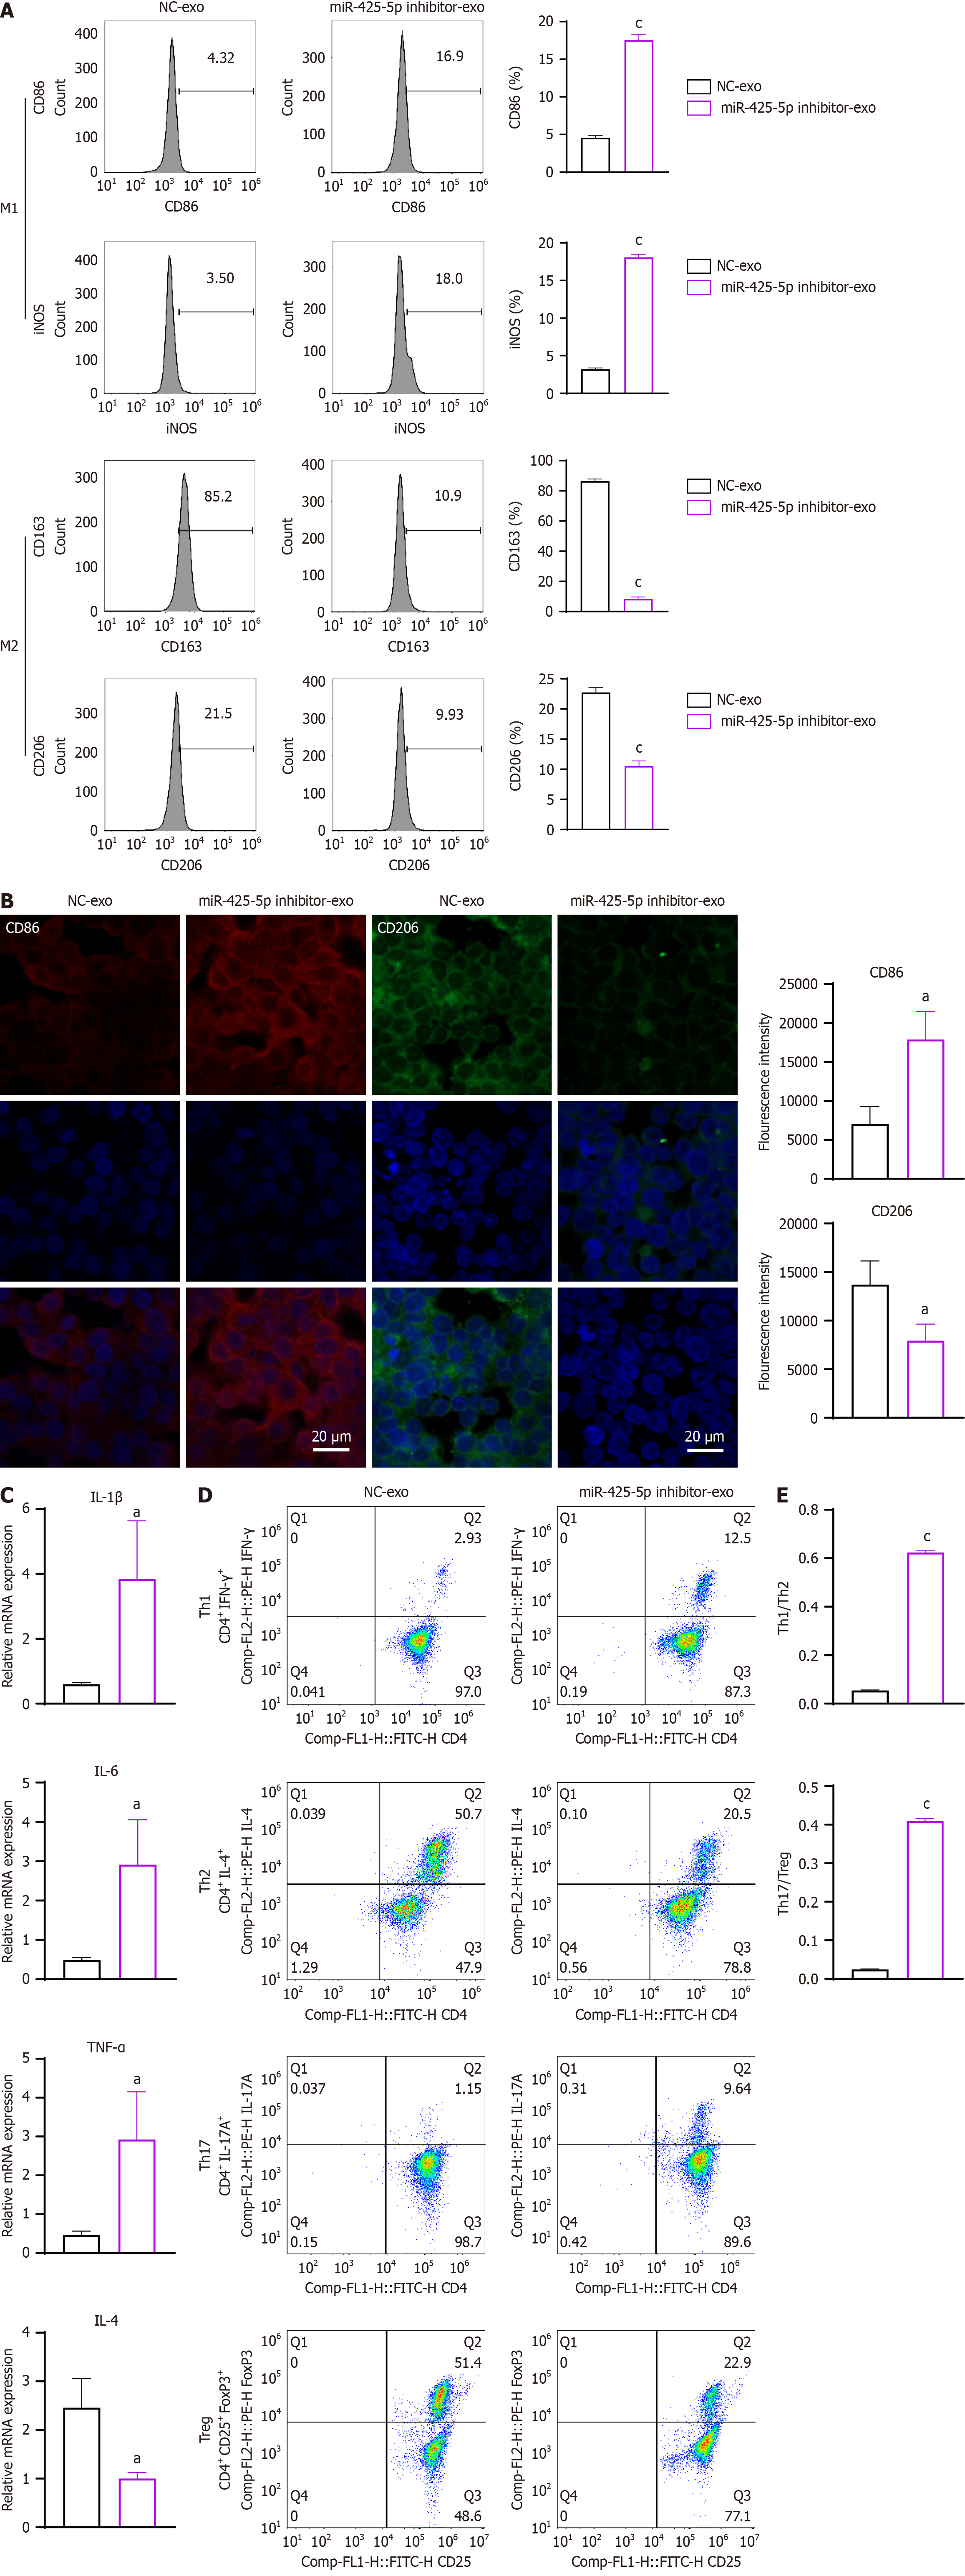
Figure 2 Exosomal miR-425-5p inhibition promotes macrophage M1-like polarization and proinflammatory T cell differentiation.
A: Flow cytometry analysis of CD86+iNOS+ and CD163+CD206+ cells ratio in THP-1 cells cultured with exosomes isolated from HTC116 cells transfected with negative control and miR-425-5p inhibitor; B: Immunofluorescent staining of CD86 (red) and CD206 (green) in THP-1 cells with DAPI nuclei (blue); C: Real-time quantitative polymerase chain reaction analysis of cytokine expression in CD4+ T cells cultured with exosomes; D and E: Flow cytometry analysis of CD4+ T cell subsets. aP < 0.05, cP < 0.001 vs negative control-exosome (n = 3 per group). NC-exo: Negative control-exosome; CD4: T-cell surface glycoprotein CD4; CD25: Interleukin-2 receptor subunit alpha; CD86: T-lymphocyte activation antigen CD86; CD163: Scavenger receptor cysteine-rich type 1 protein M130; CD206: Macrophage mannose receptor 1; FoxP3: Forkhead box protein P3; IFN-γ: Interferon gamma; IL-1β: Interleukin 1 beta; IL-4: Interleukin 4; IL-6: Interleukin 6; iNOS: Inducible nitric oxide synthase; Th: T helper cells; TNF-α: Tumor necrotic factor alpha; Treg: Regulatory T cells.
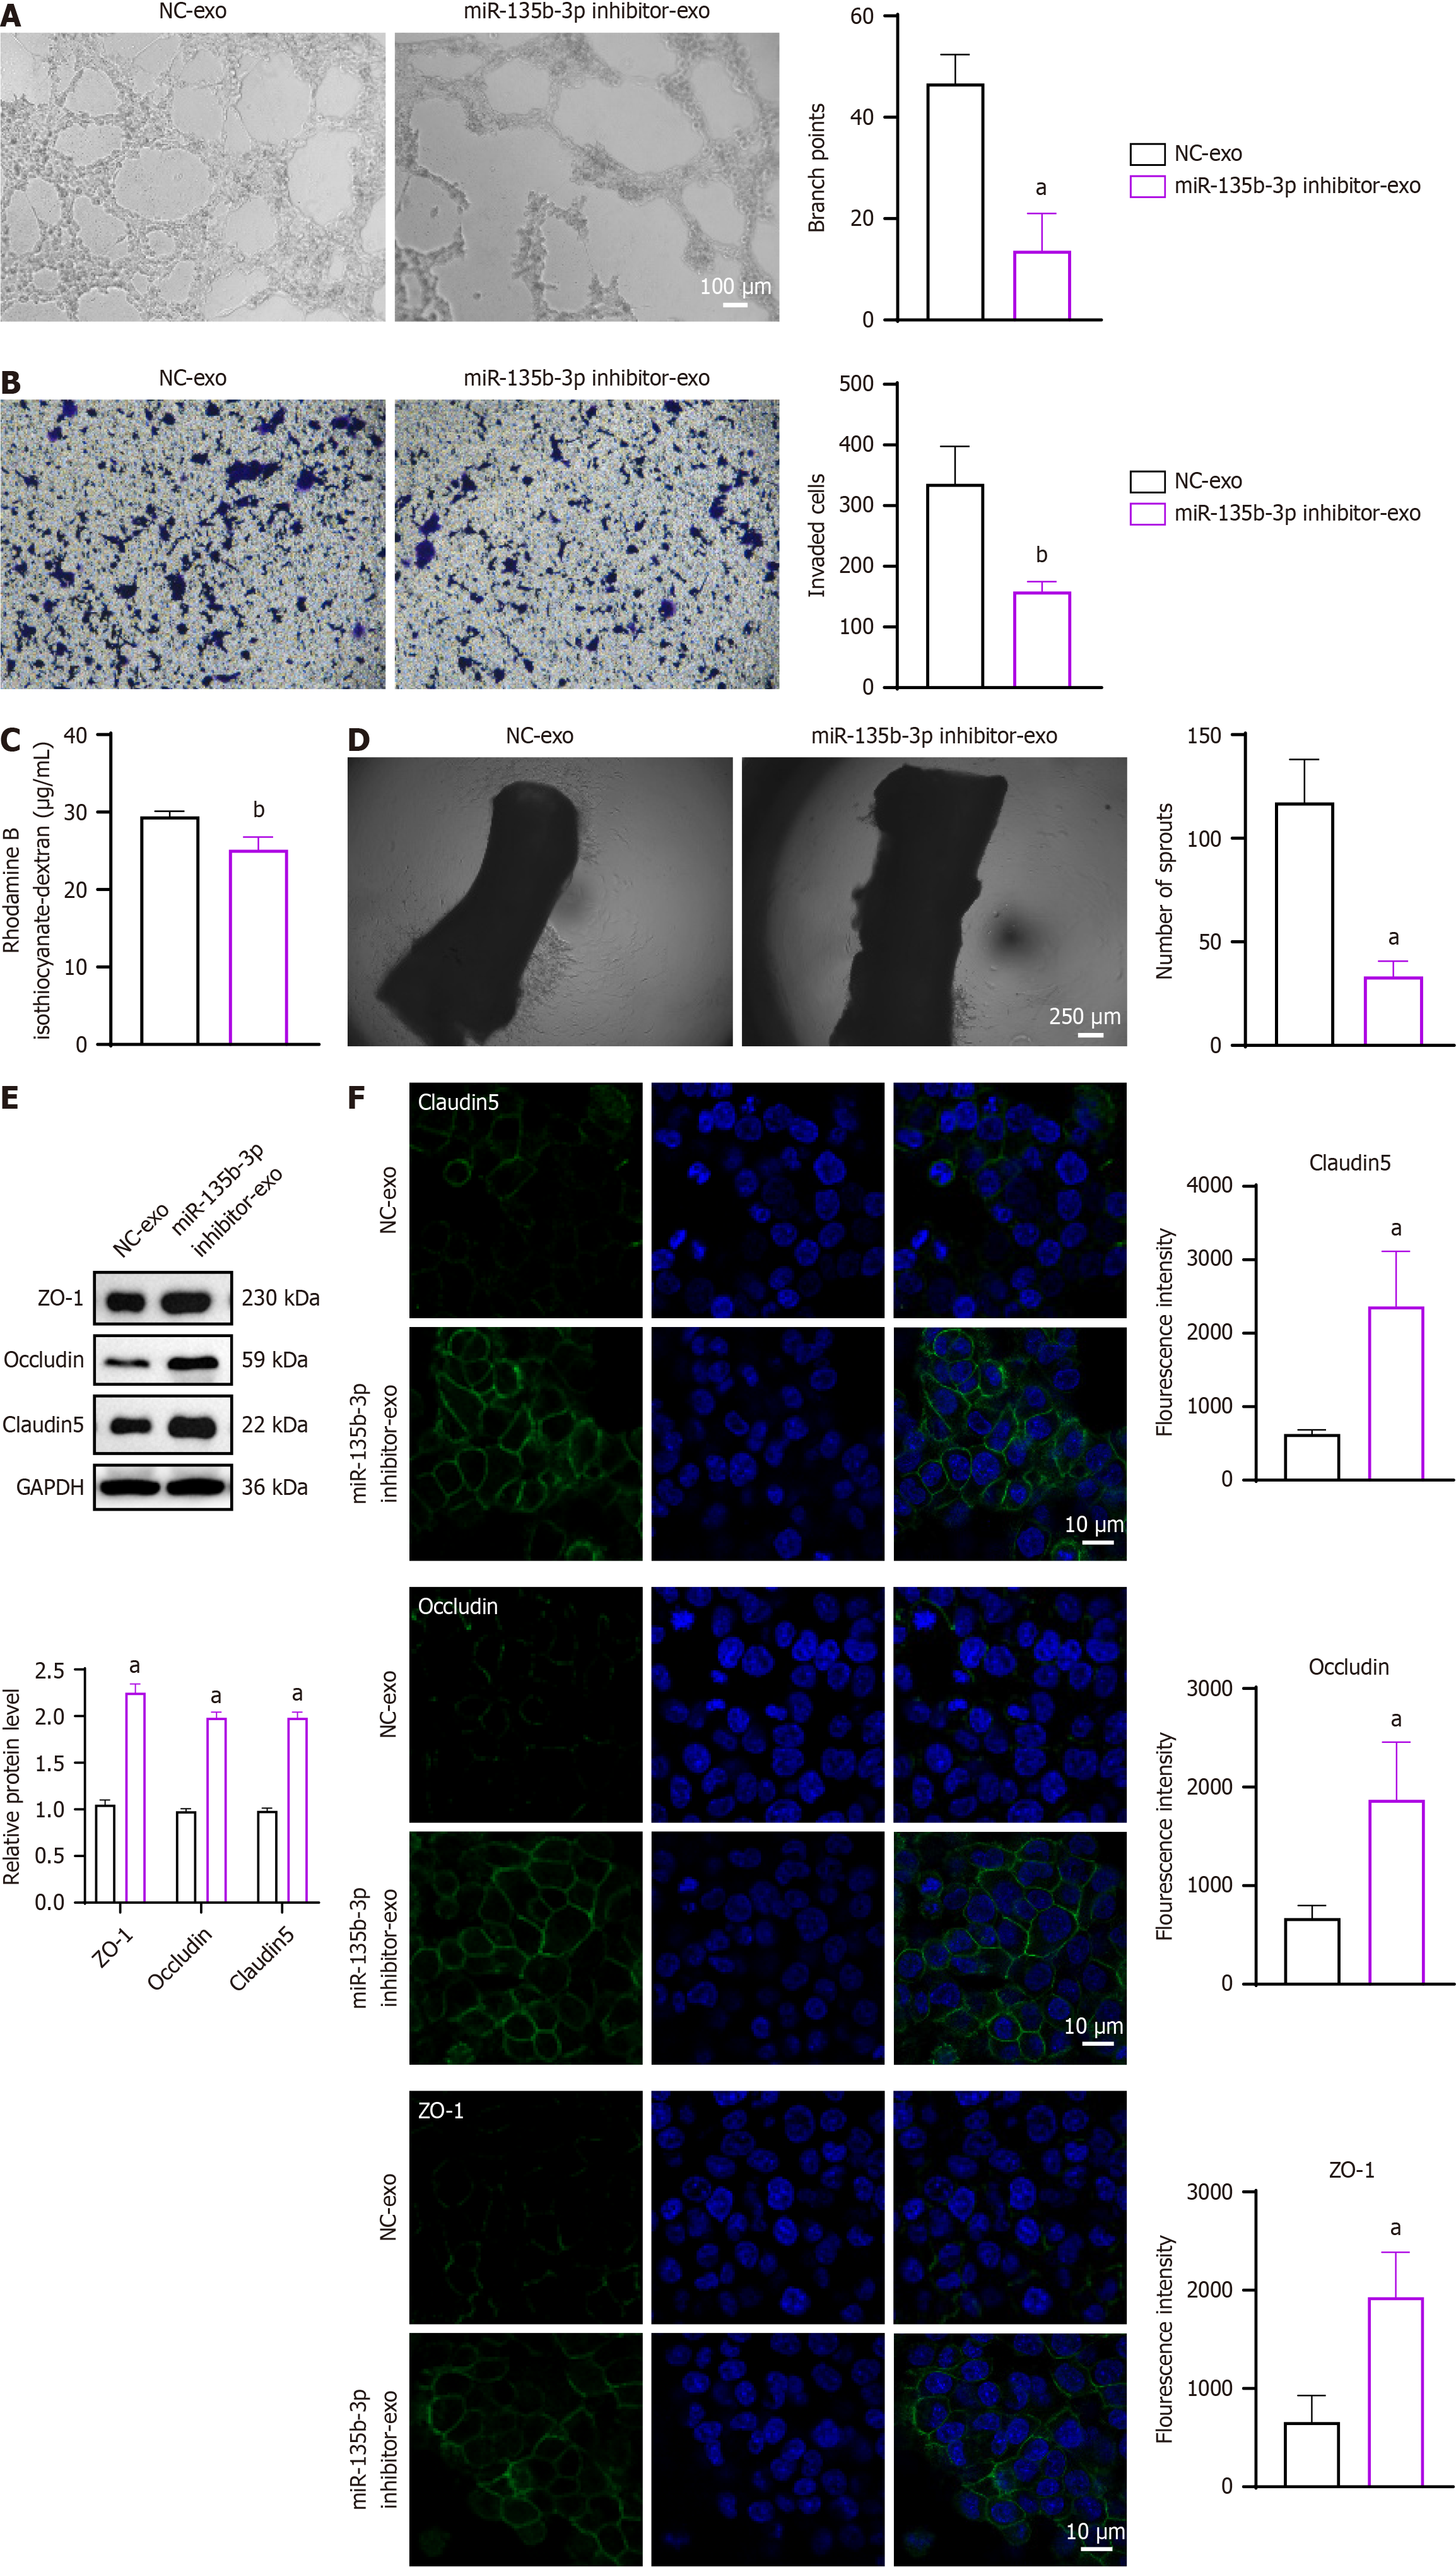
Figure 3 Exosomal miR-135b-3p enhances vascular permeability and angiogenesis in endothelial cells.
A: Representative images and branch points of microscopic observation of angiogenesis in human umbilical vein endothelial cells (HUVECs) cultured with exosomes from HCT116 cells transfected with miR-135b-3p inhibitor or negative control; B: Representative images and invaded cells of cell invasion assay; C: Permeability of the HUVEC monolayers to rhodamine–dextran (70 kDa) after exposure to exosomes for 72 hours; D: Representative images of the aortic ring and numbers of microvascular sprouts; E: Western blot analysis of tight junction proteins zonula occludens-1, occludin, and claudin-5 in HUVECs treated with exosomes; GAPDH as an internal control; F: Immunofluorescent staining of tight junction proteins zonula occludens-1, occludin, and claudin-5 (green) in HUVECs treated with DAPI nuclei (blue). aP < 0.05, bP < 0.01 vs negative control-exosome (n = 3 per group). NC-exo: Negative control-exosome; ZO-1: Zonula occludens-1.
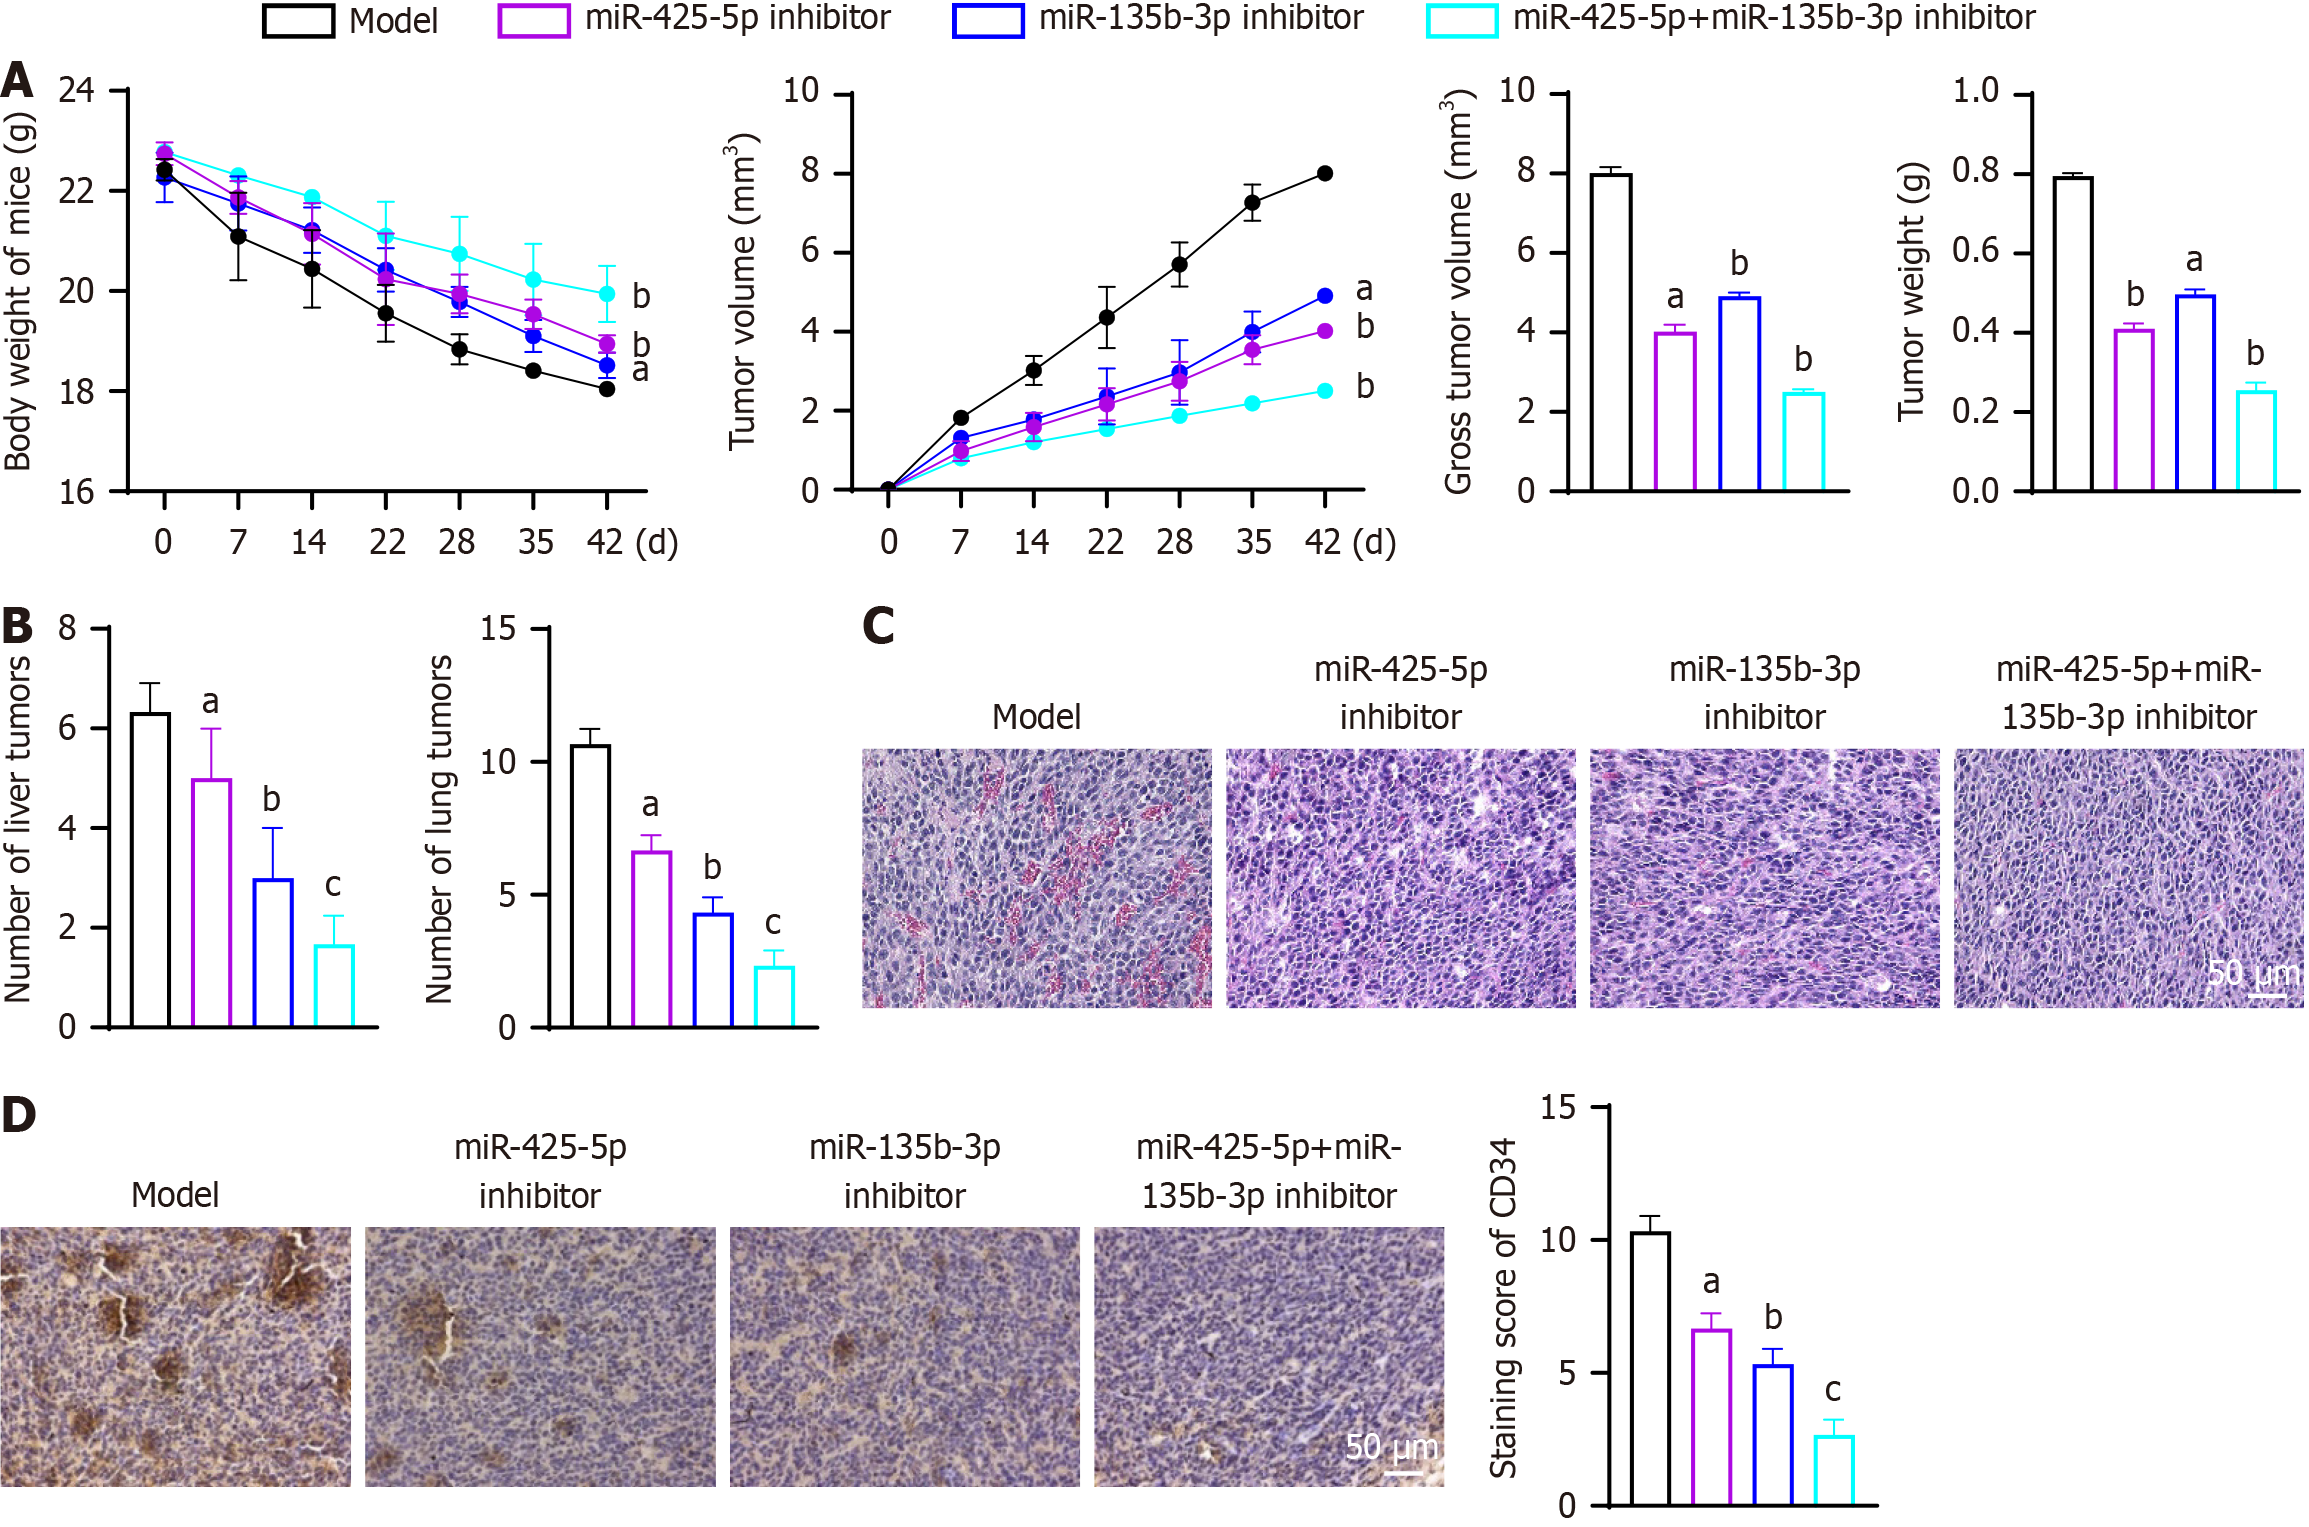
Figure 4 Inhibition of exosomal miR-425-5p and mir-135b-3p reduces tumor growth, metastasis, and angiogenesis in vivo.
A: Body weight, tumor volume, tumor weight and gross size of tumors from mice treated with HCT116 cells; B: Number of liver and lung tumors; C: Representative images of hematoxylin and eosin staining in tumor tissues; D: Immunohistochemical staining of CD34 in tumor tissues. aP < 0.05, bP < 0.01, cP < 0.001 vs model (n = 3 per group). CD34: Hematopoietic progenitor cell antigen CD34.
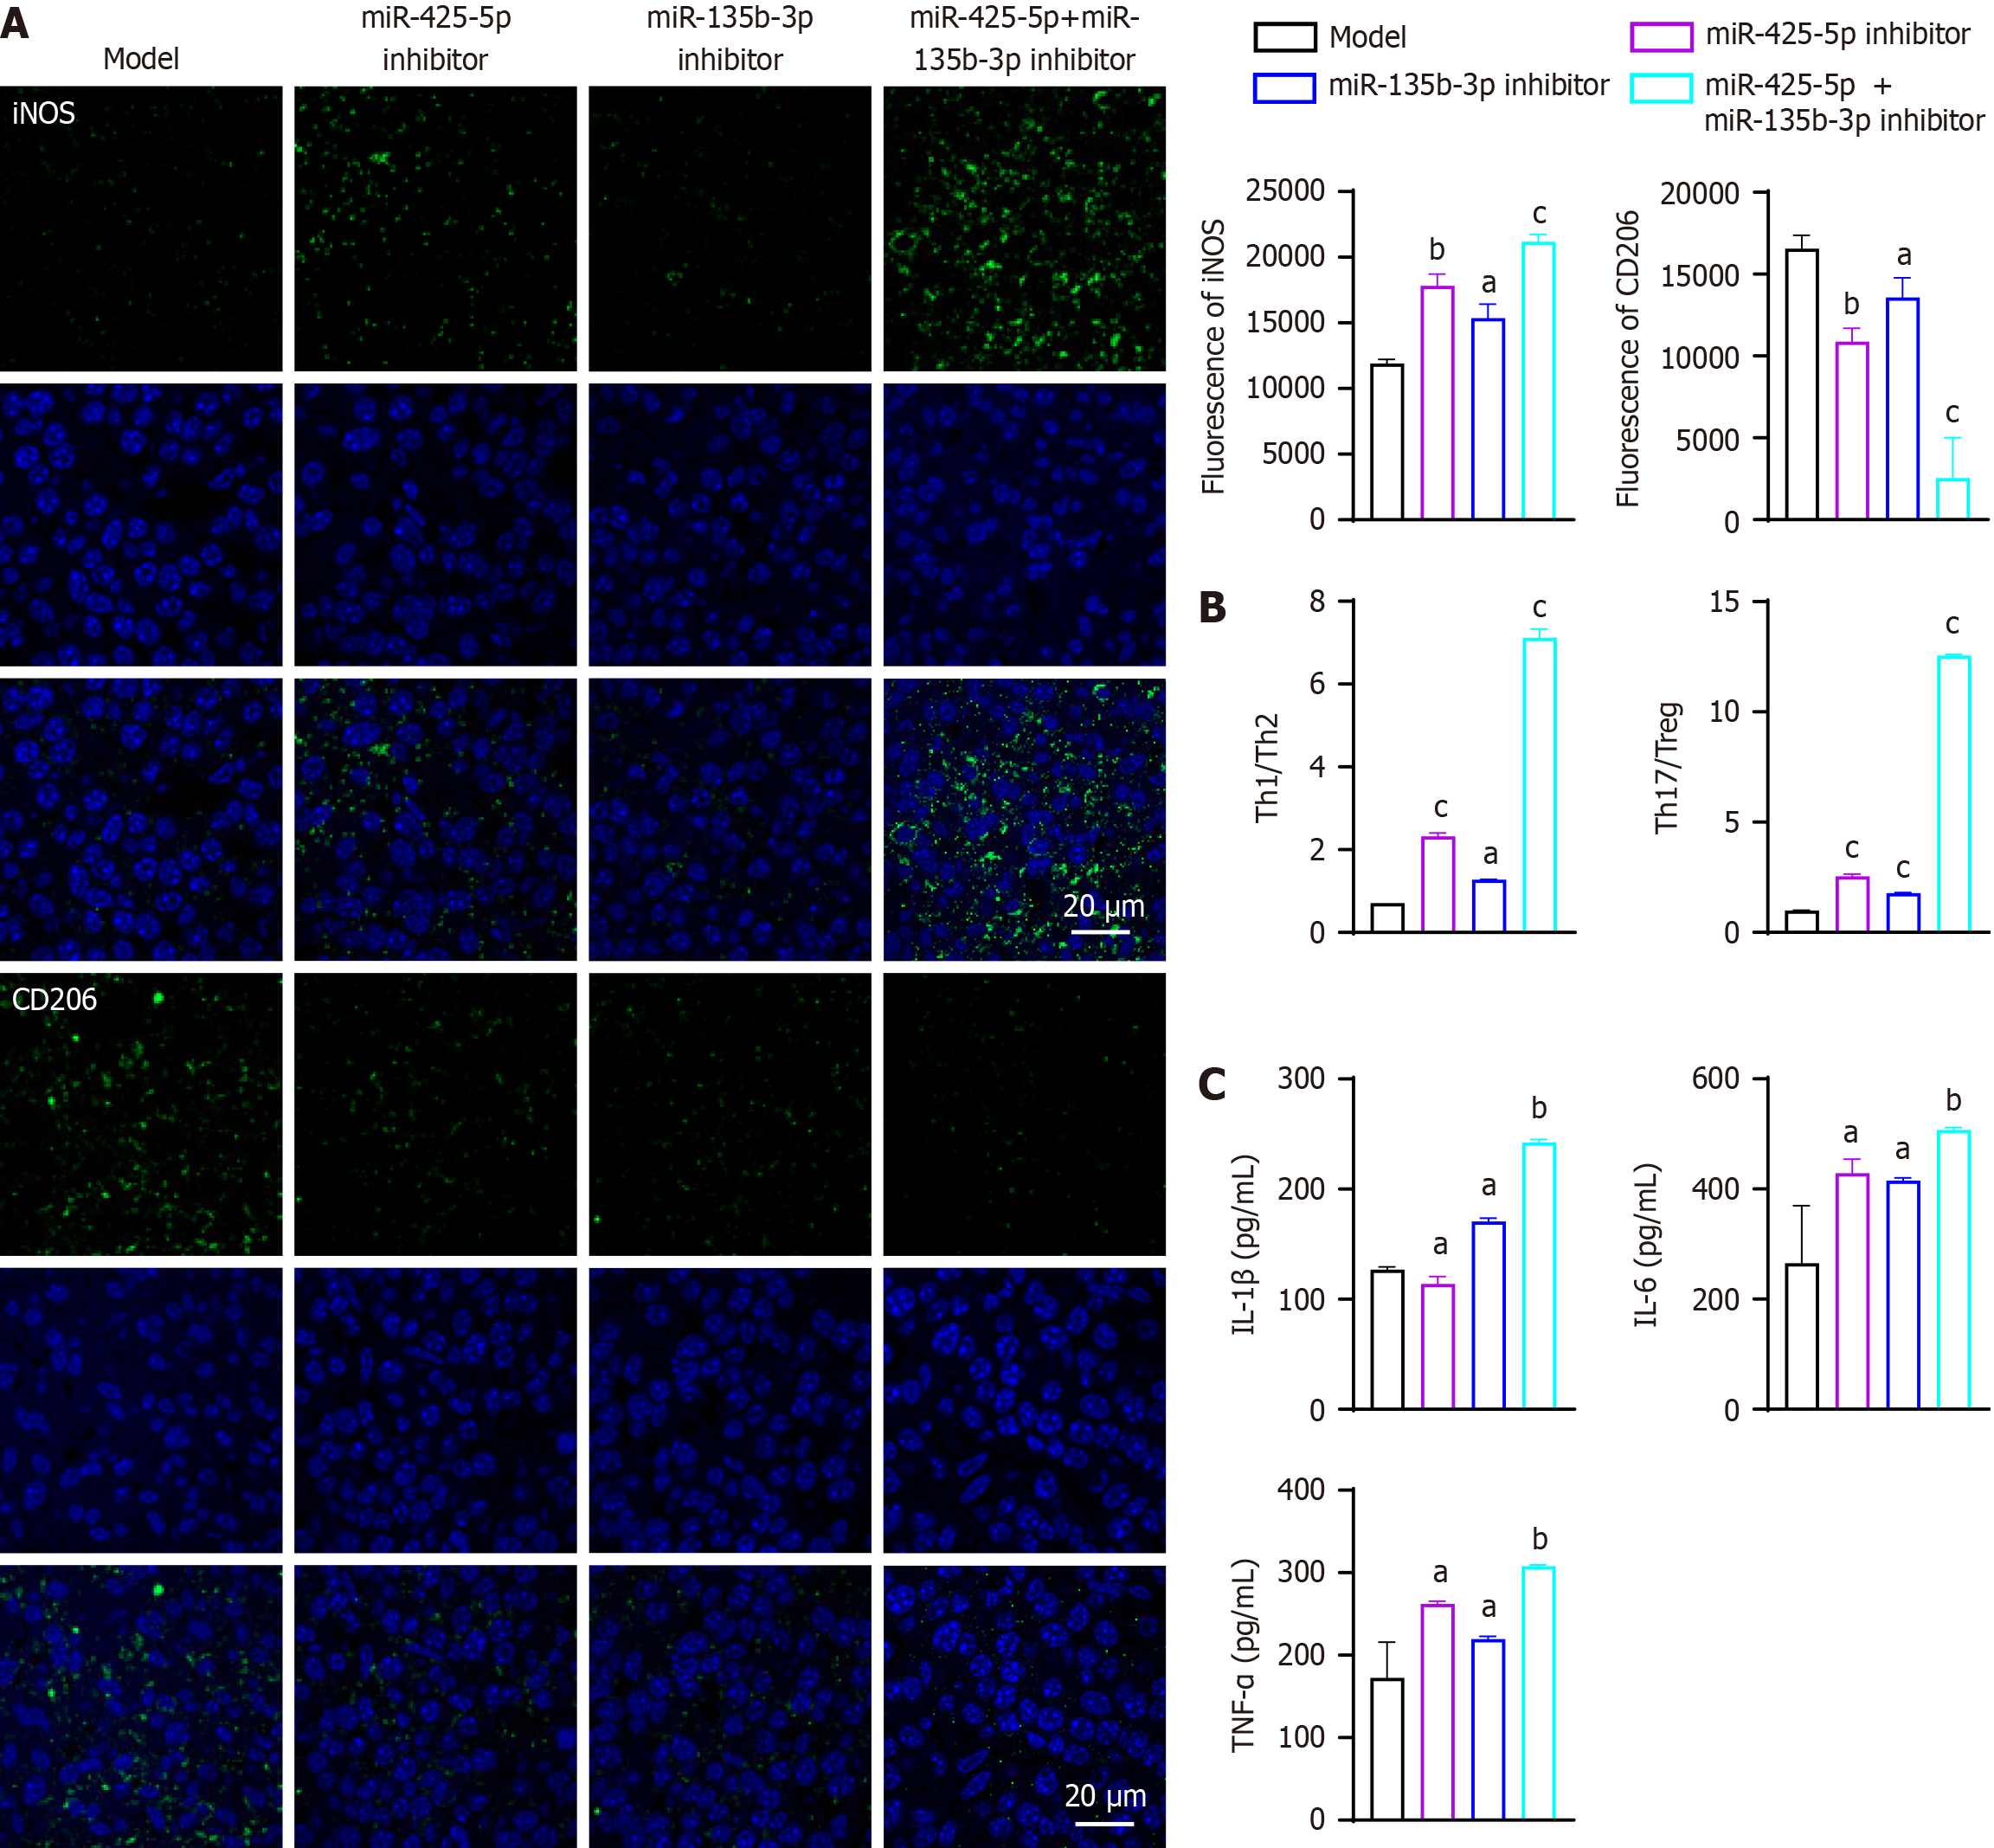
Figure 5 Exosomal miR-425-5p and mir-135b-3p inhibition modulates the immune microenvironment in tumor tissues.
A: Immunofluore
- Citation: Feng CZ, Zhong SQ, Ye SW, Zheng Z, Sun H, Zhou SH. Tumor-derived exosomal miR-425-5p and miR-135b-3p enhance colorectal cancer progression through immune suppression and vascular permeability promotion. World J Gastrointest Oncol 2025; 17(6): 106161
- URL: https://www.wjgnet.com/1948-5204/full/v17/i6/106161.htm
- DOI: https://dx.doi.org/10.4251/wjgo.v17.i6.106161


