Copyright
©The Author(s) 2025.
World J Gastrointest Oncol. Jun 15, 2025; 17(6): 105887
Published online Jun 15, 2025. doi: 10.4251/wjgo.v17.i6.105887
Published online Jun 15, 2025. doi: 10.4251/wjgo.v17.i6.105887
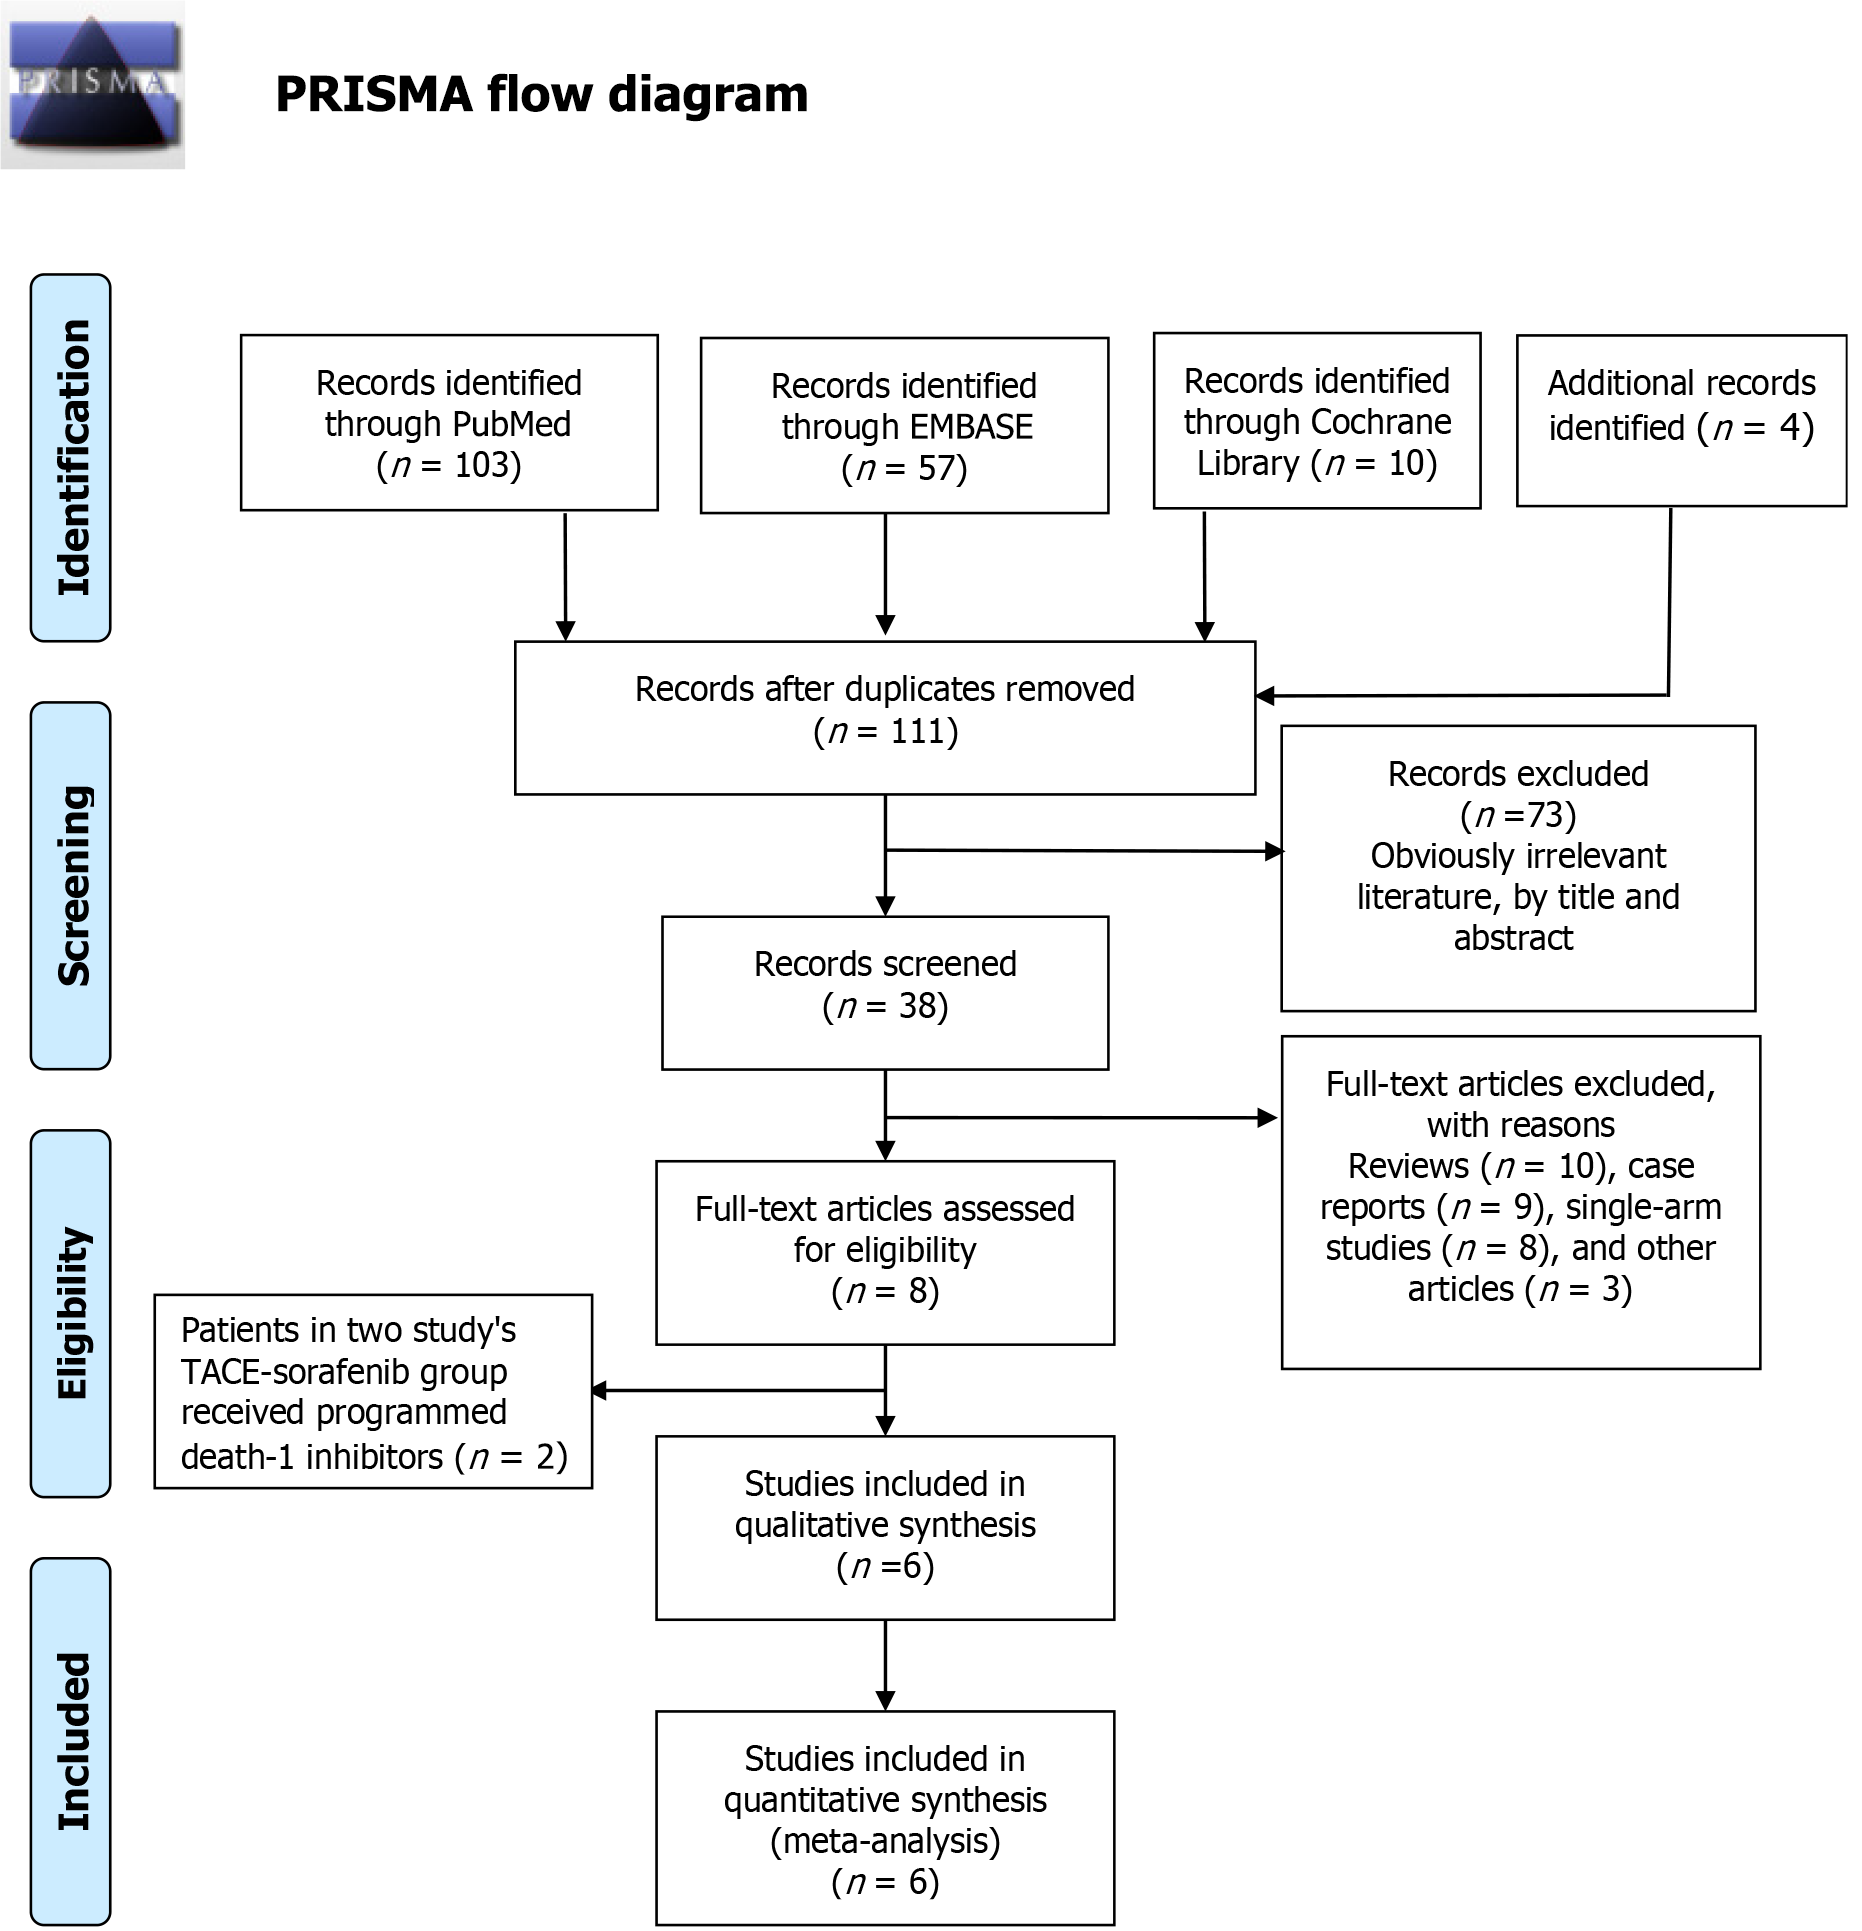
Figure 1 PRISMA flow diagram.
TACE: Transarterial chemoembolization.
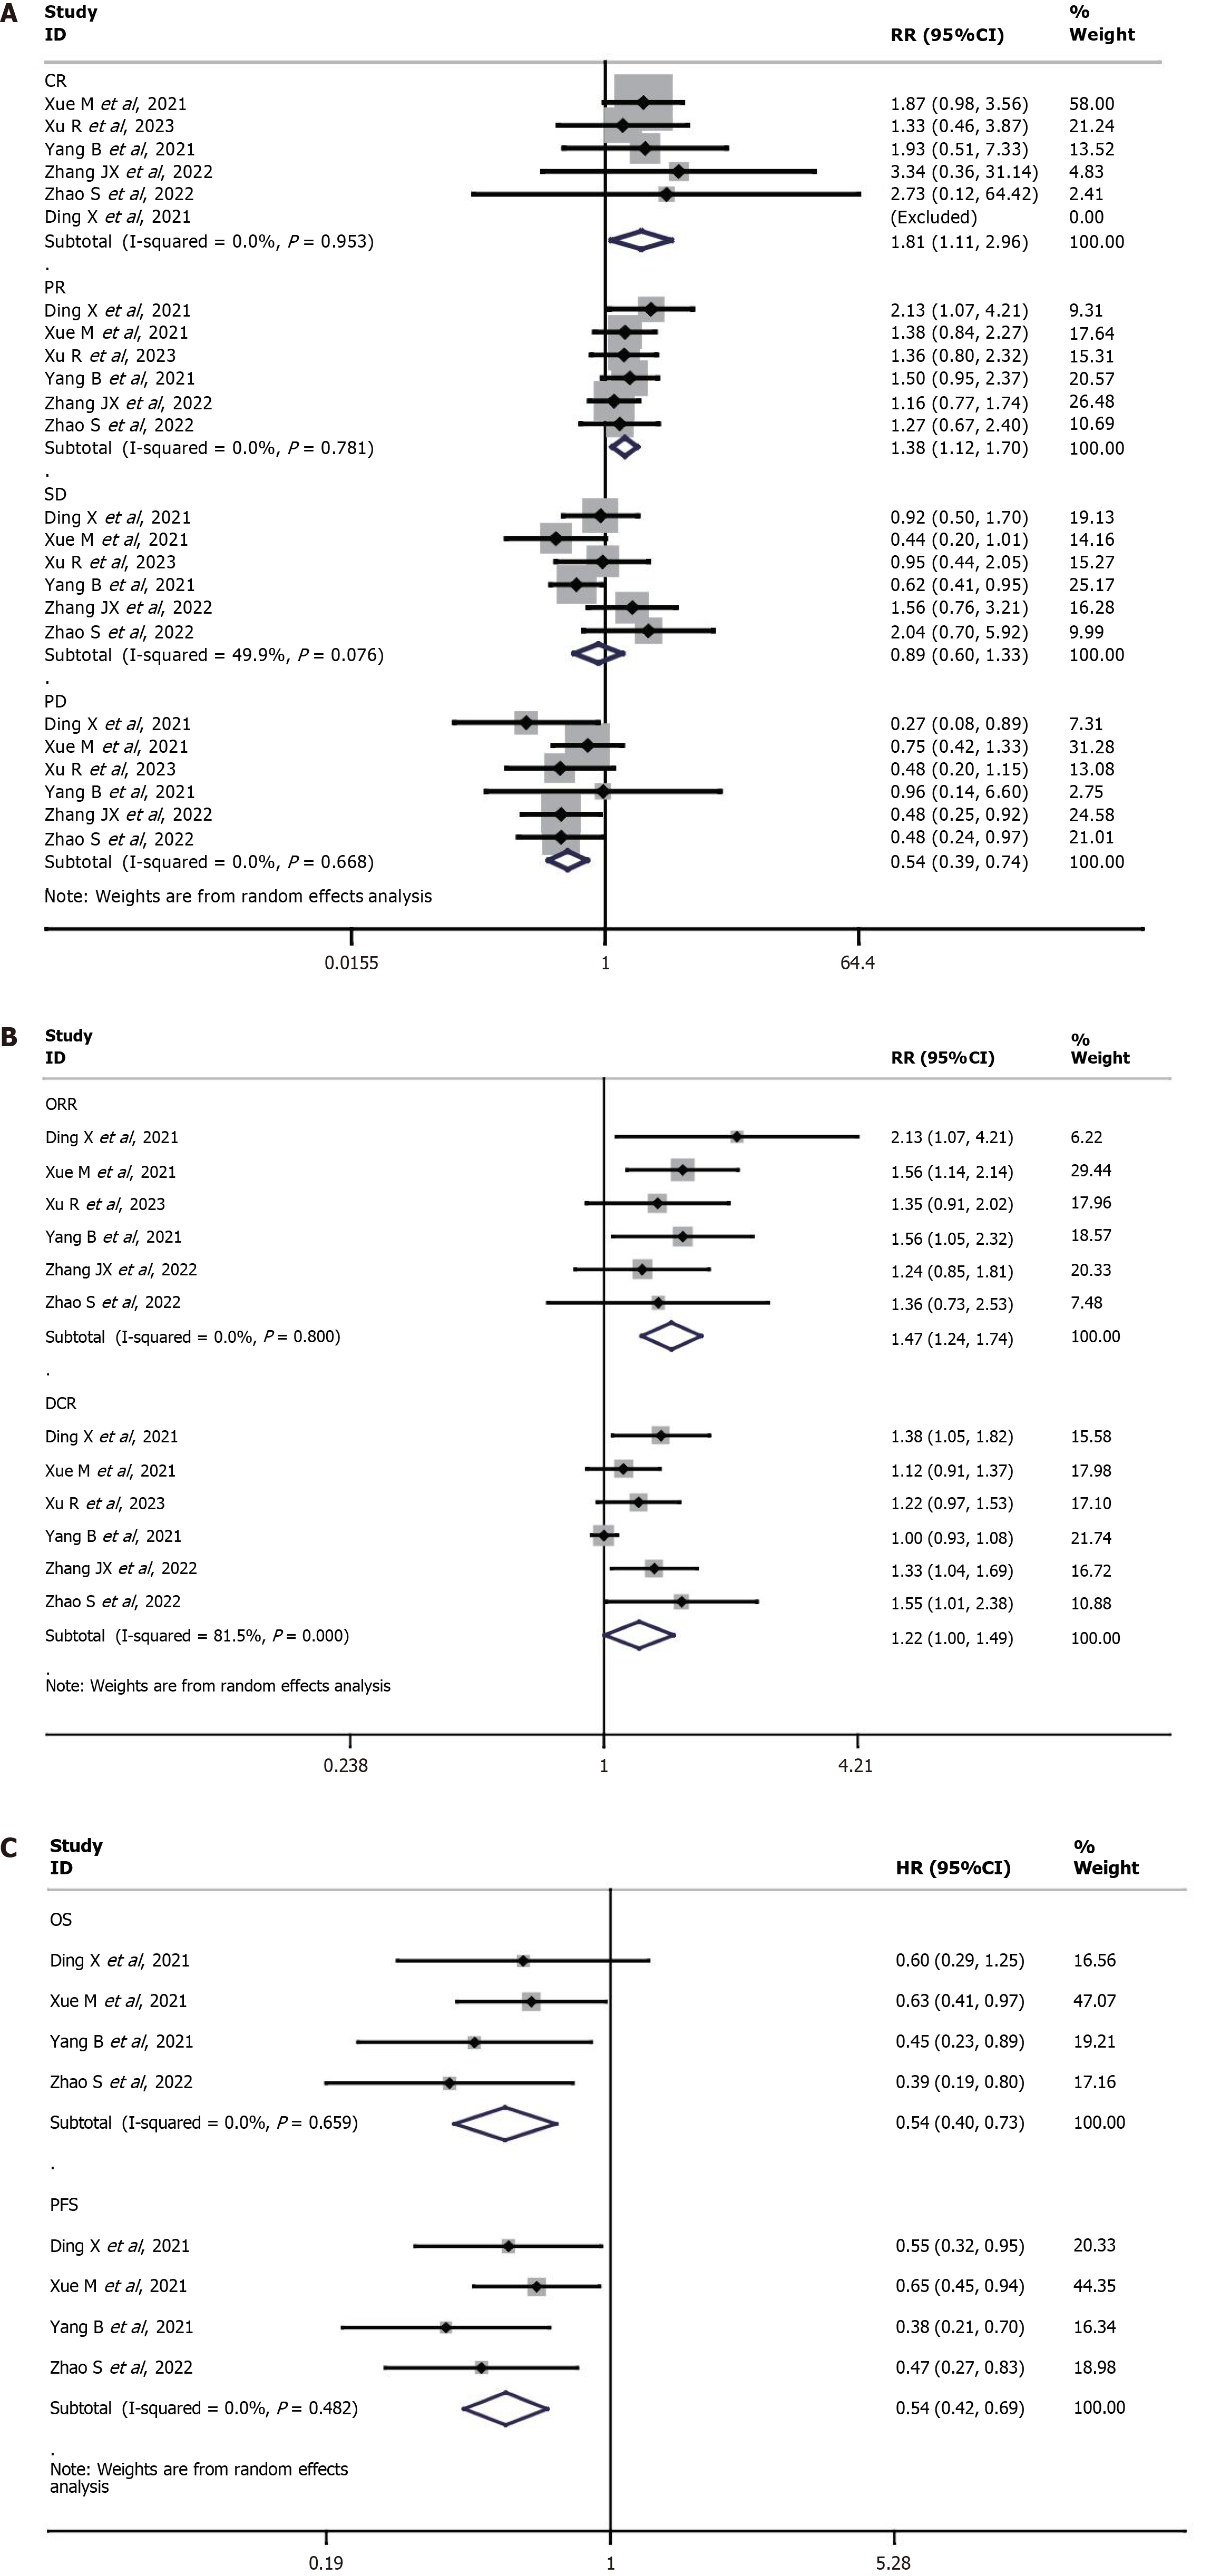
Figure 2 Forest map.
A: Forest map of complete response, partial response, stable disease, and progressive disease; B: Forest map of objective response rate and disease control rate; C: Forest map of overall survival and disease-free survival. RR: Relative risk; CI: Confidence interval; CR: Complete response; PR: Partial response; SD: Stable disease; PD: Progressive disease; ORR: Objective response rate; DCR: Disease control rate; HR: Hazard ratio; OS: Overall survival; PFS: Progression-free survival.
- Citation: Zhang W, Fu H, Liu ZR, Xu L, Che X, Ning YT, Zhan ZY, Zhou GC. Transarterial chemoembolization combined with lenvatinib vs transarterial chemoembolization combined with sorafenib for unresectable hepatocellular carcinoma: A systematic review and meta-analysis. World J Gastrointest Oncol 2025; 17(6): 105887
- URL: https://www.wjgnet.com/1948-5204/full/v17/i6/105887.htm
- DOI: https://dx.doi.org/10.4251/wjgo.v17.i6.105887


