Copyright
©The Author(s) 2025.
World J Gastrointest Oncol. Jun 15, 2025; 17(6): 105570
Published online Jun 15, 2025. doi: 10.4251/wjgo.v17.i6.105570
Published online Jun 15, 2025. doi: 10.4251/wjgo.v17.i6.105570
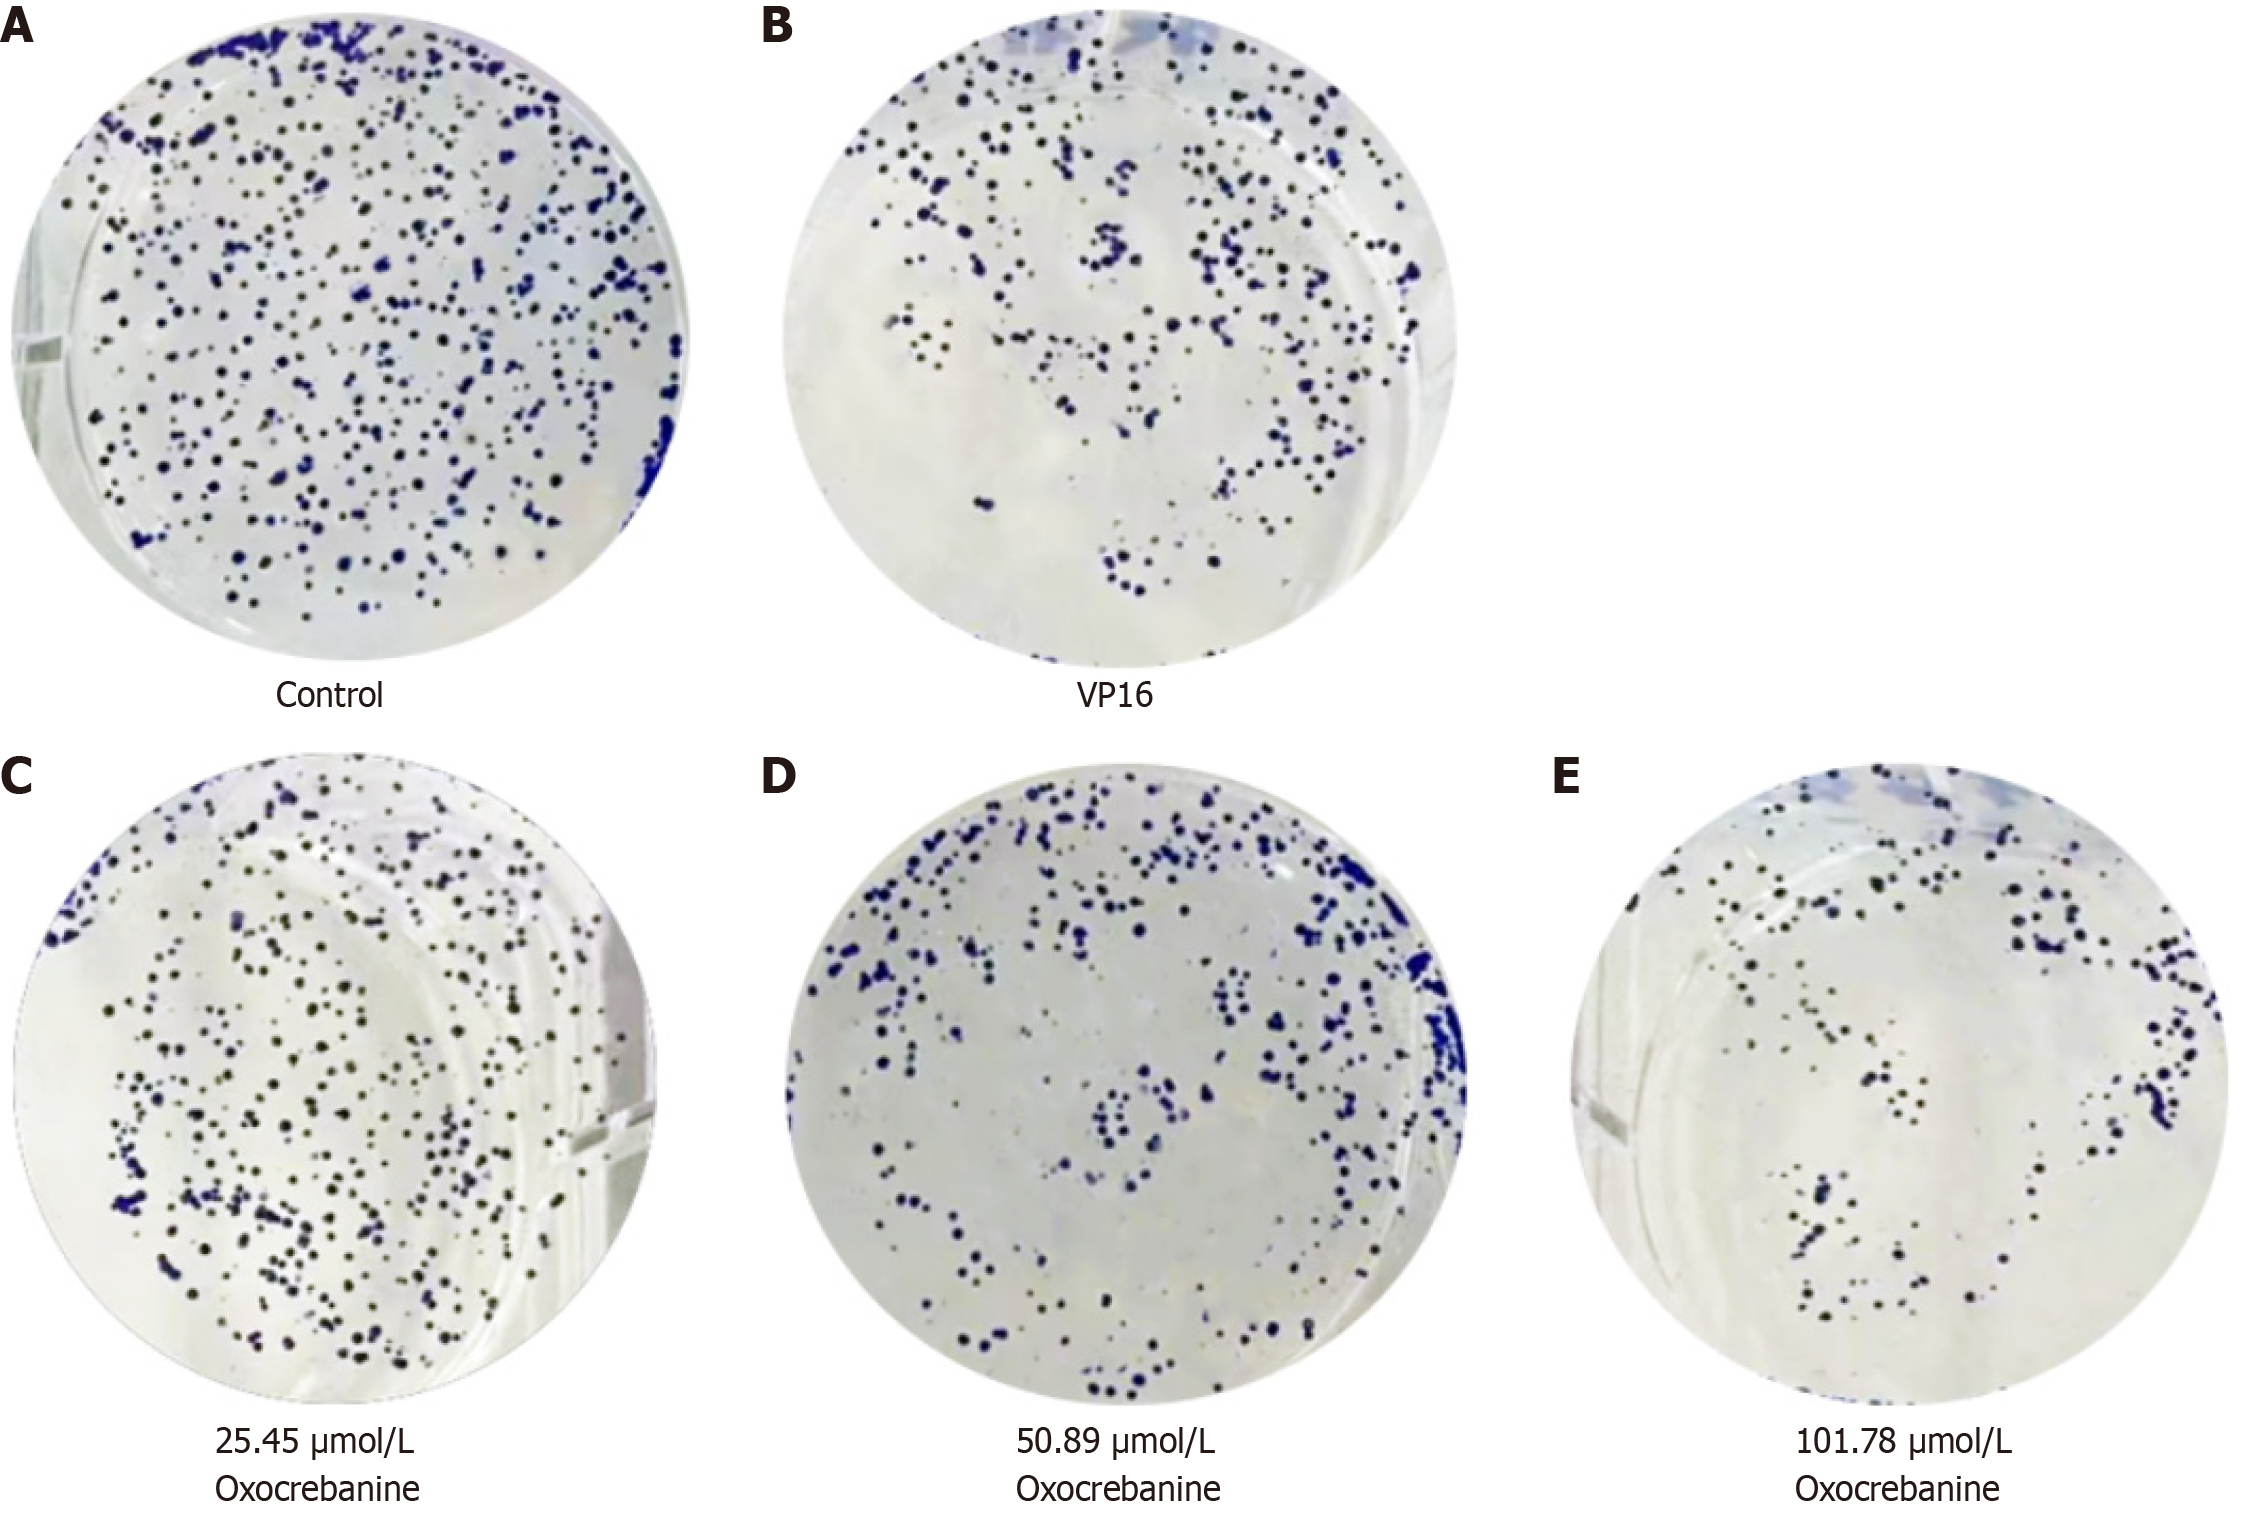
Figure 1 Effect of oxocrebanine on proliferation of Hep3B2.
1-7 cells (× 100). Hep3B2.1-7 cells were treated respectively with 1 mL of complete culture medium, VP16 at a concentration of 32.54 μmol/L, and oxocrebanine at concentrations of 25.45 μmol/L, 50.89 μmol/L, and 101.78 μmol/L. After 72 hours of drug treatment, the cells of each group were stained with crystal violet for 25 minutes and photographed. A: Control; B: VP16; C: 25.45 μmol/L oxocrebanine; D: 50.89 μmol/L oxocrebanine; E: 101.78 μmol/L oxocrebanine.
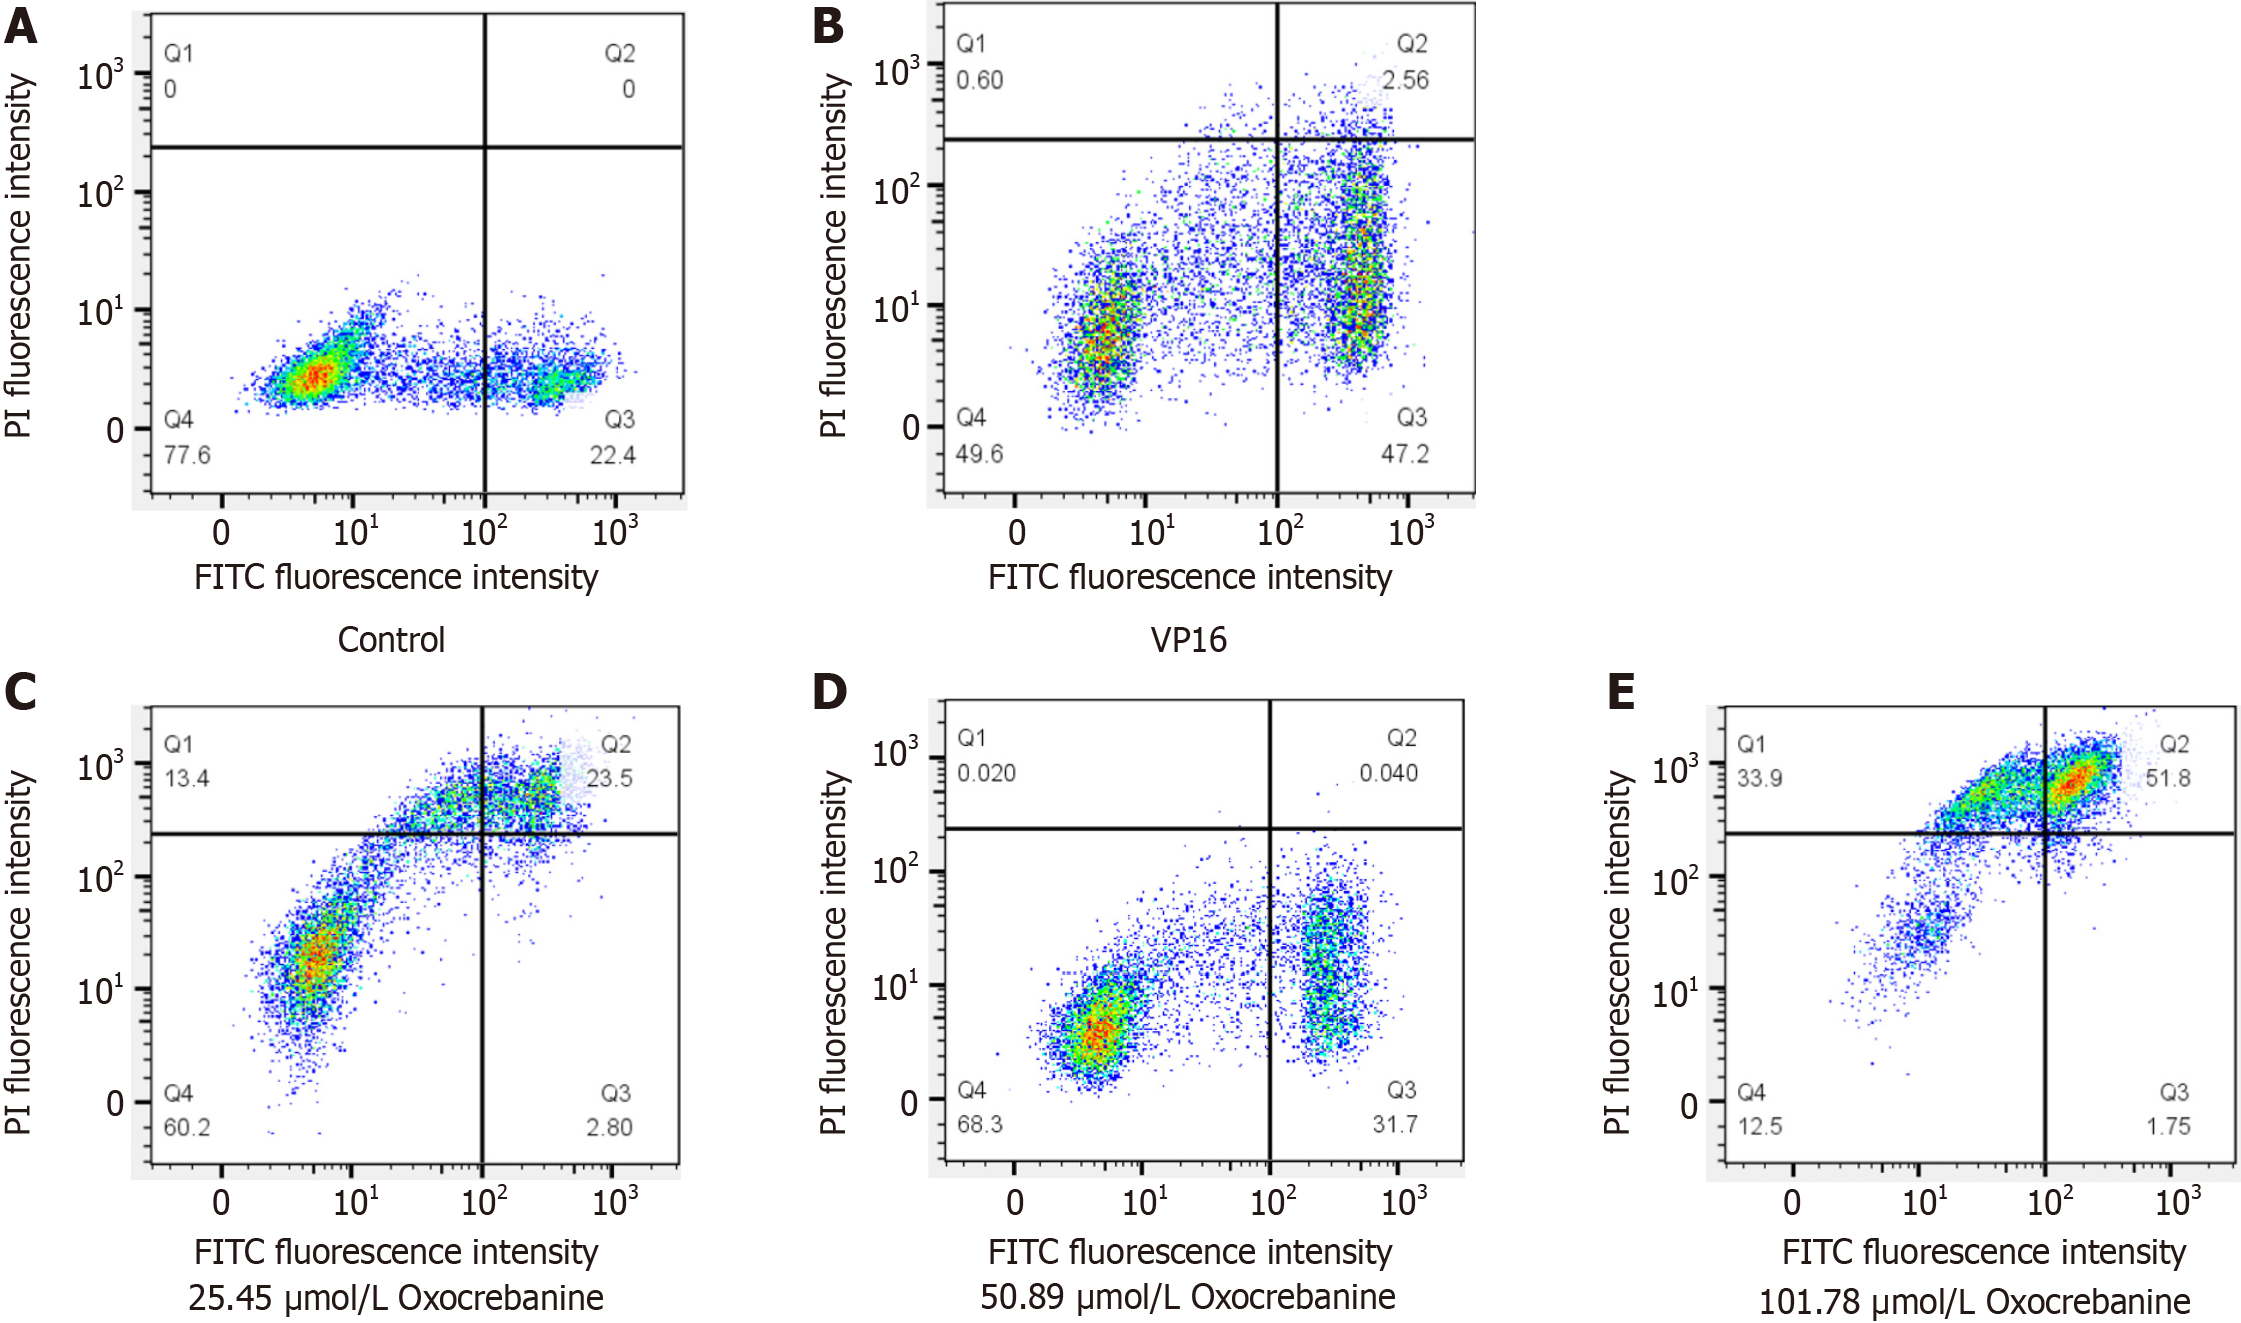
Figure 2 Effect of oxocrebanine on apoptosis of Hep3B2.
1-7 cells. After 48 hours of incubation with complete culture medium, 32.54 μmol/L VP16, or 25.45 μmol/L, 50.89 μmol/L, or 101.79 μmol/L oxocrebanine, the cells were stained with FITC-labeled Annexin V and PI staining solution, and then analyzed by flow cytometry. A: Control; B: VP16; C: 25.45 μmol/L oxocrebanine; D: 50.89 μmol/L oxocrebanine; E: 101.78 μmol/L oxocrebanine.
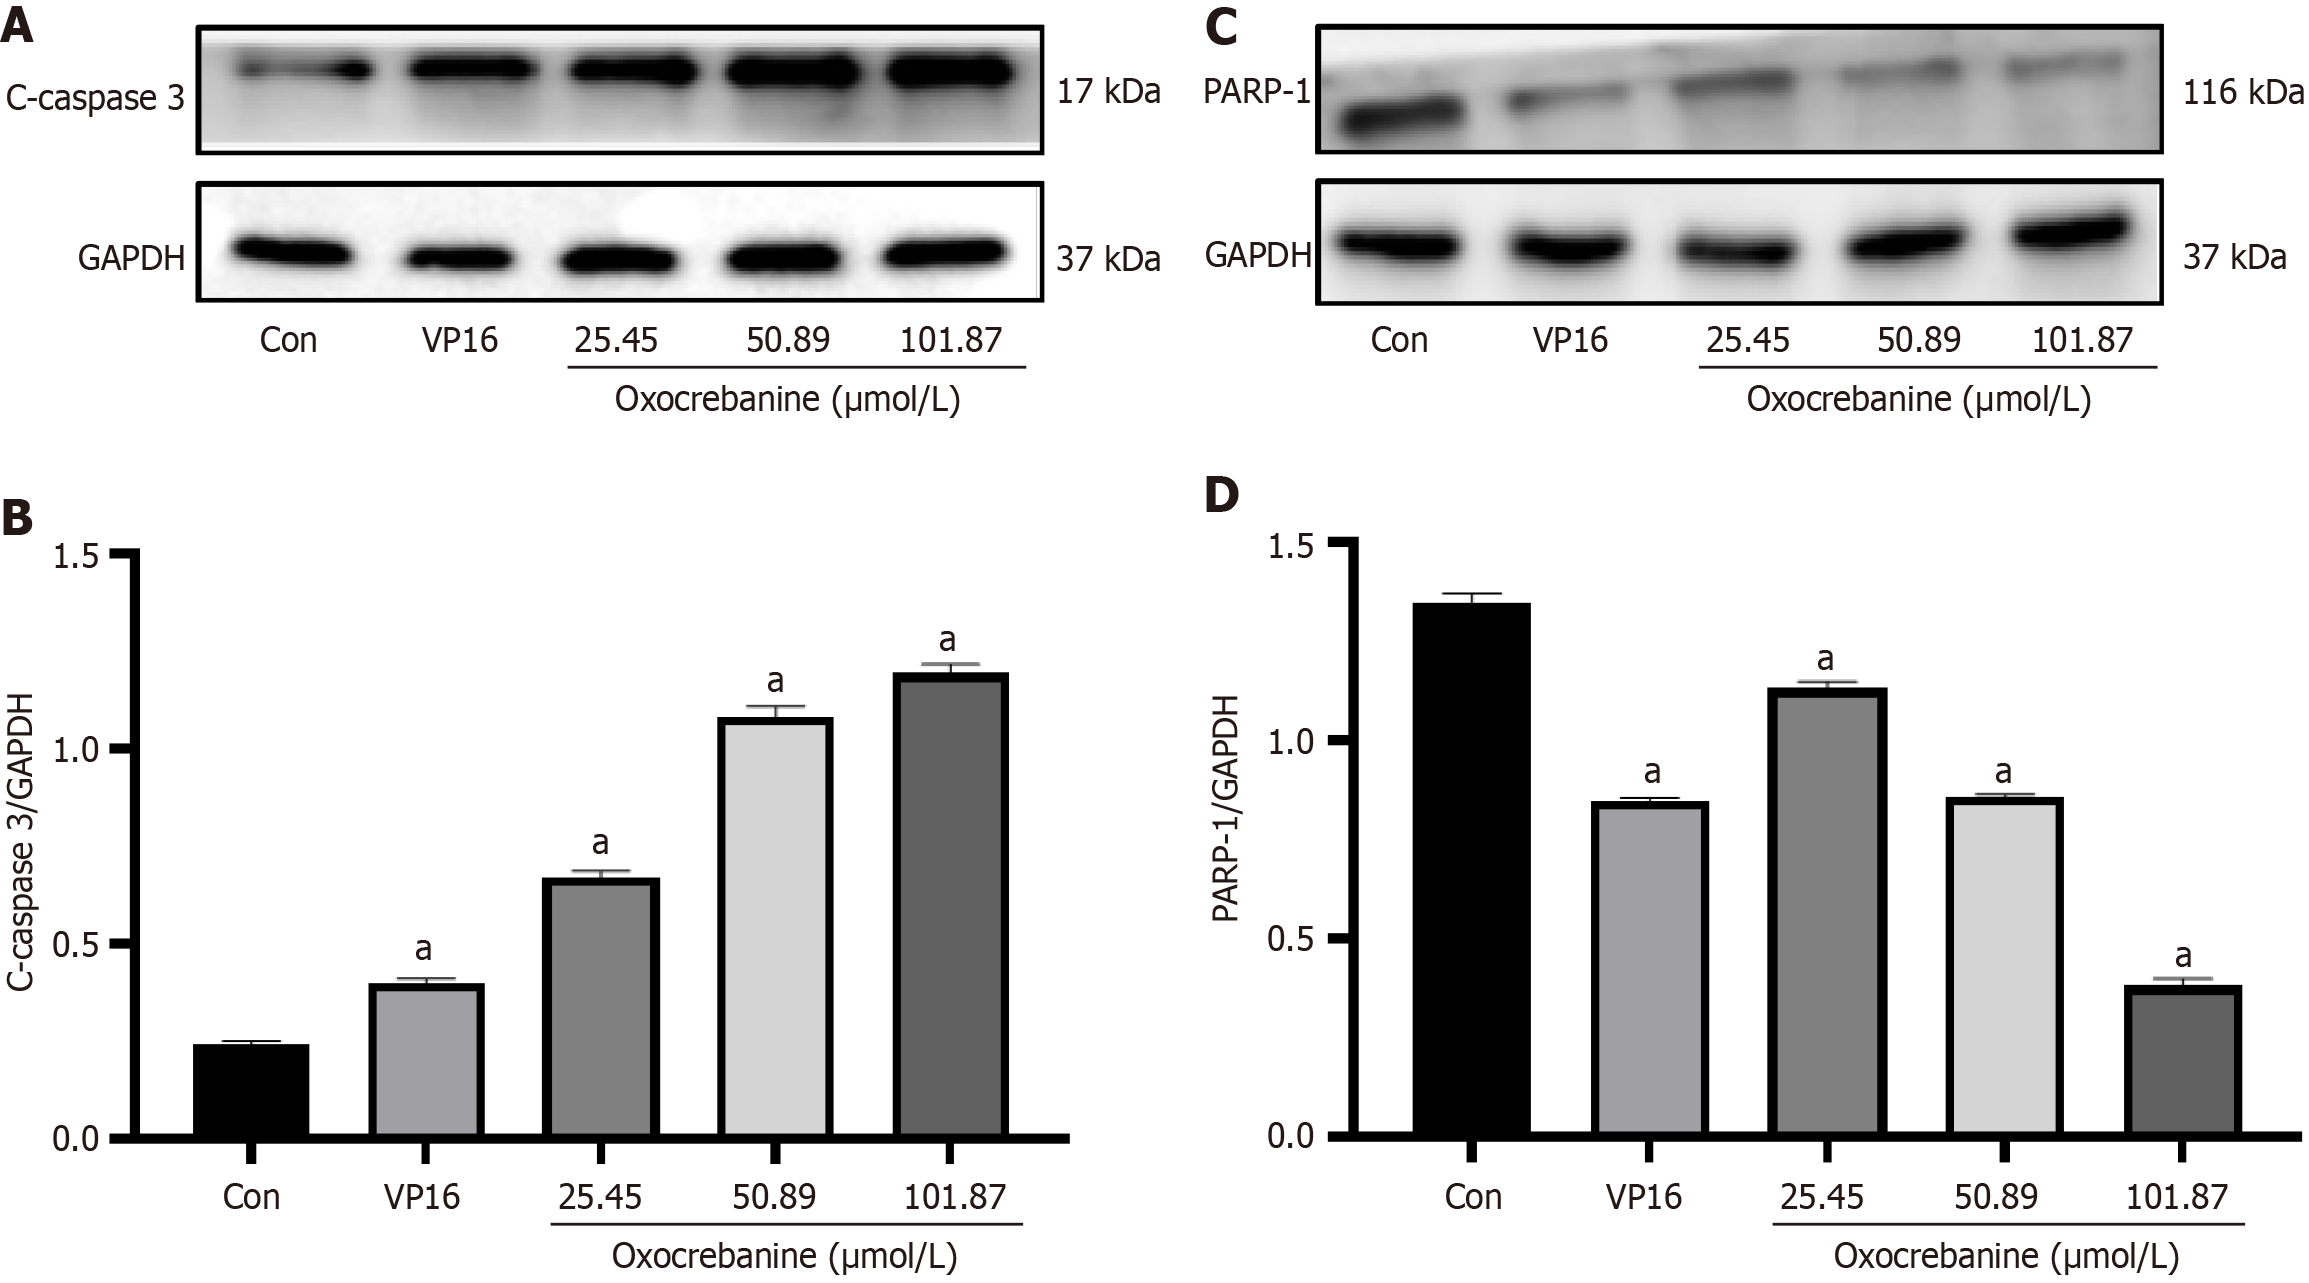
Figure 3 Protein expression levels of cleaved caspase3 and PARP in Hep3B2.
1-7 cells. A: Western blot analysis of cleaved caspase3 (c-caspase3) protein level in Hep3B2.1-7 cells after treatment with oxocrebanine. VP16 (32.54 μmol/L) was used as a control; B: Western blot analysis data indicated that the expression of c-caspase3 was upregulated with oxocrebanine treatments; C: Level of PARP1 in Hep3B2.1-7 cells after treatment with oxocrebanine. VP16 (32.54 μmol/L) was used as a control; D: Western blot analysis data showed that the expression of PARP1 was downregulated by oxocrebanine treatments. Data are shown as the mean ± SD. aP < 0.01 vs control (n = 3).
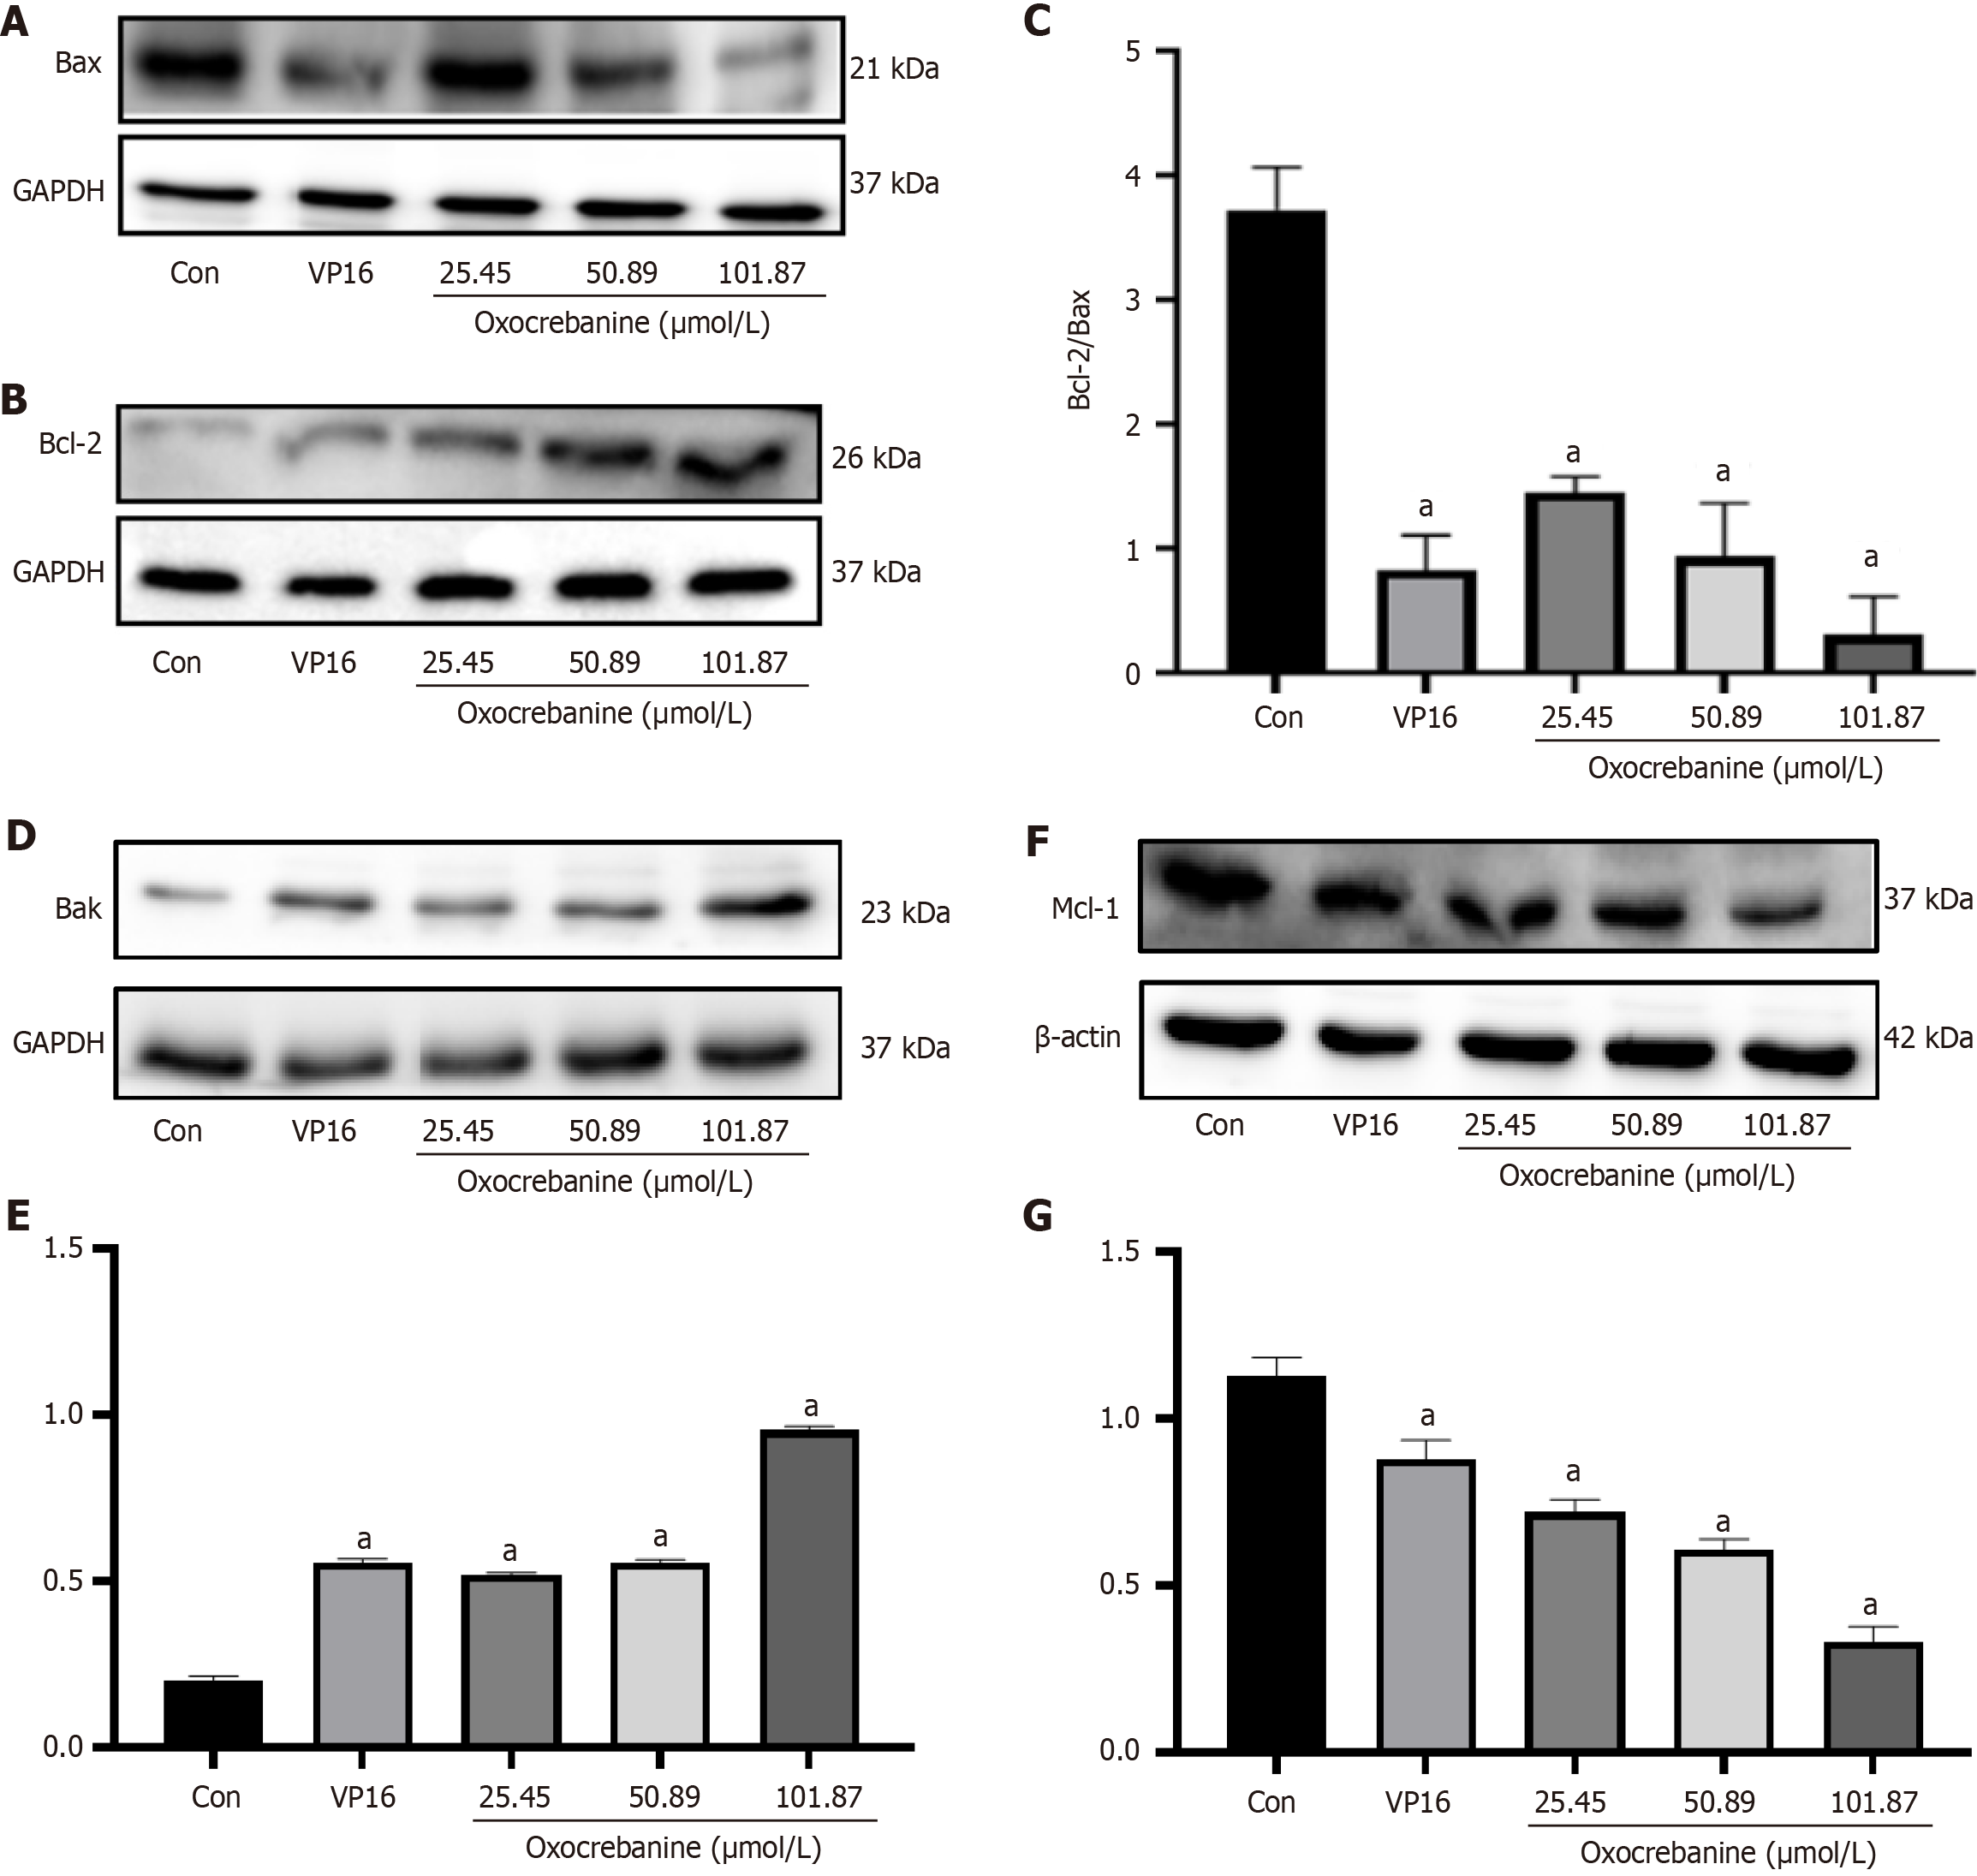
Figure 4 Protein expression levels of Bcl-2, Bax, Bak, and Mcl-1 in Hep3B2.
1-7 cells. A: Western blot analysis of Bcl-2 protein level in Hep3B2.1-7 cells after treatment with oxocrebanine. VP16 (32.54 μmol/L) was used as a control; B: Western blot analysis of Bax protein level in Hep3B2.1-7 cells after treatment with oxocrebanine, with VP16 (32.54 μmol/L) used as a control; C: Western blot analysis data indicated that the ratio of Bcl-2 to Bax protein expression was decreased with oxocrebanine treatments; D: Level of Bak in Hep3B2.1-7 cells after treatment with oxocrebanine. VP16 (32.54 μmol/L) was used as a control; E: Western blot analysis data showed that the expression of Bak was downregulated by oxocrebanine treatments; F: Level of Mcl-1 in Hep3B2.1-7 cells after treatment with oxocrebanine. VP16 (32.54 μmol/L) was used as a control; G: Western blot analysis data showed that the expression of Mcl-1 was downregulated by oxocrebanine treatments. Data are shown as the mean ± SD. aP < 0.01 vs control (n = 3).
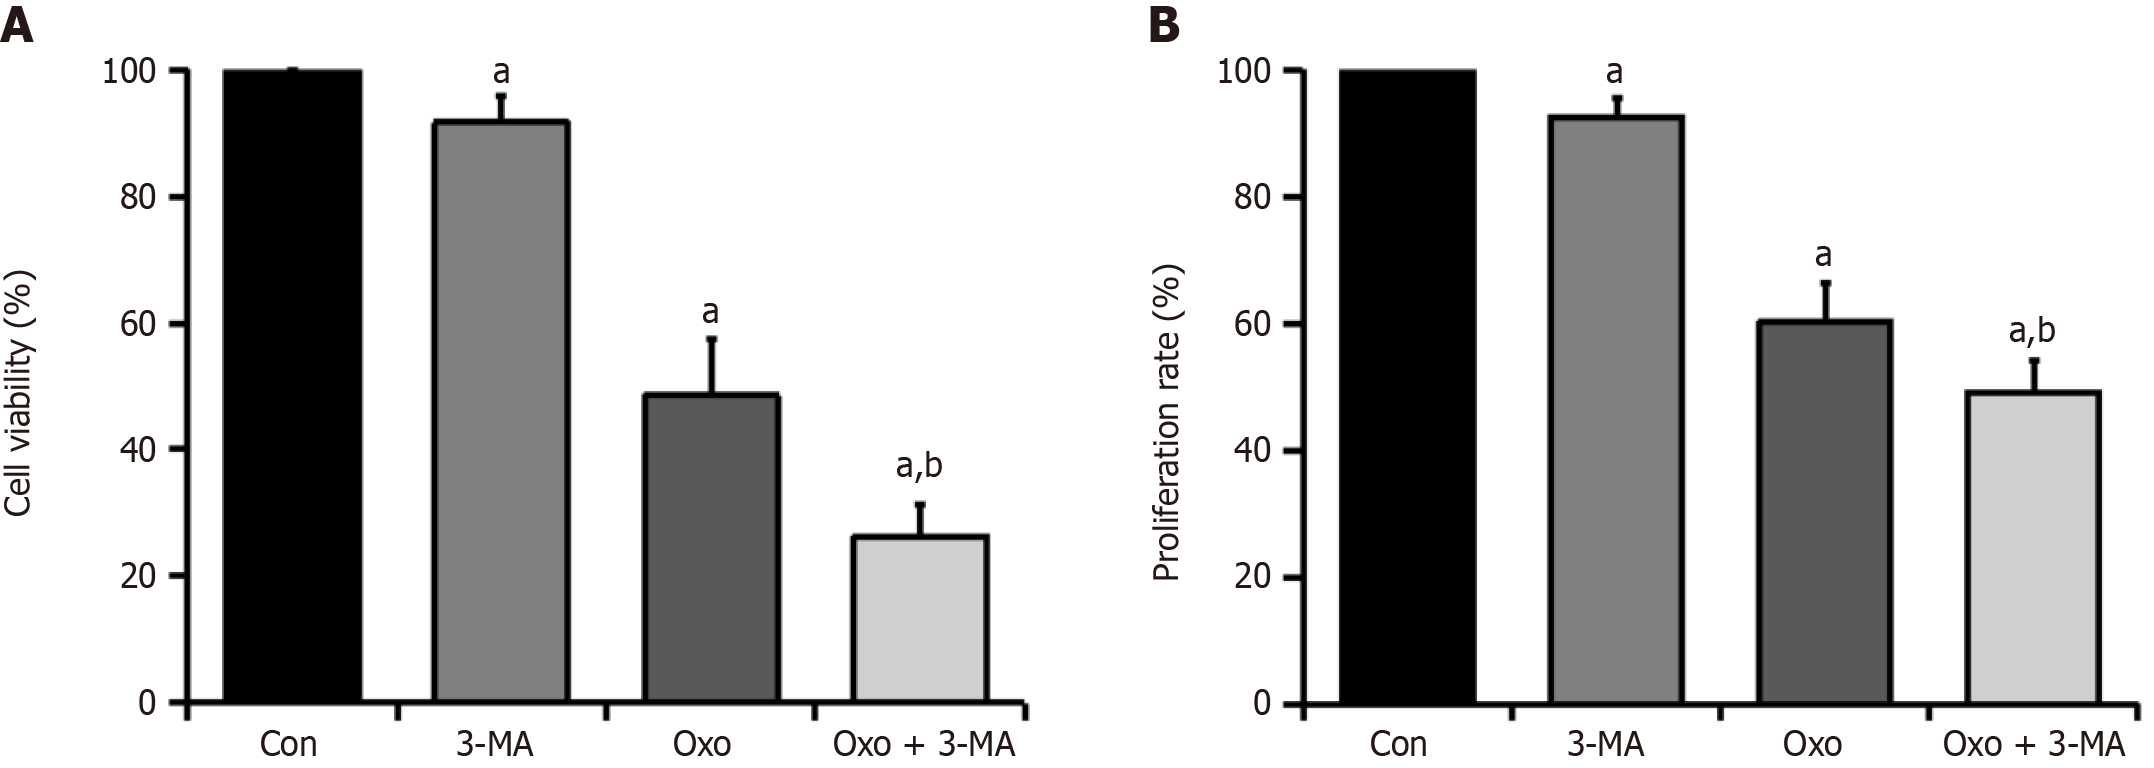
Figure 5 Hep3B2.
1-7 cell viability and proliferation rate measured by MTT assay and BrdU test. A: Viability of cells treated with oxocrebanine and 3-MA as demonstrated by MTT assat; B: Proliferation rate of cells treated with oxocrebanine and 3-MA. Data are shown as the mean ± SD. aP < 0.01 vs control; bP < 0.01 vs oxocrebanine group (n = 3).
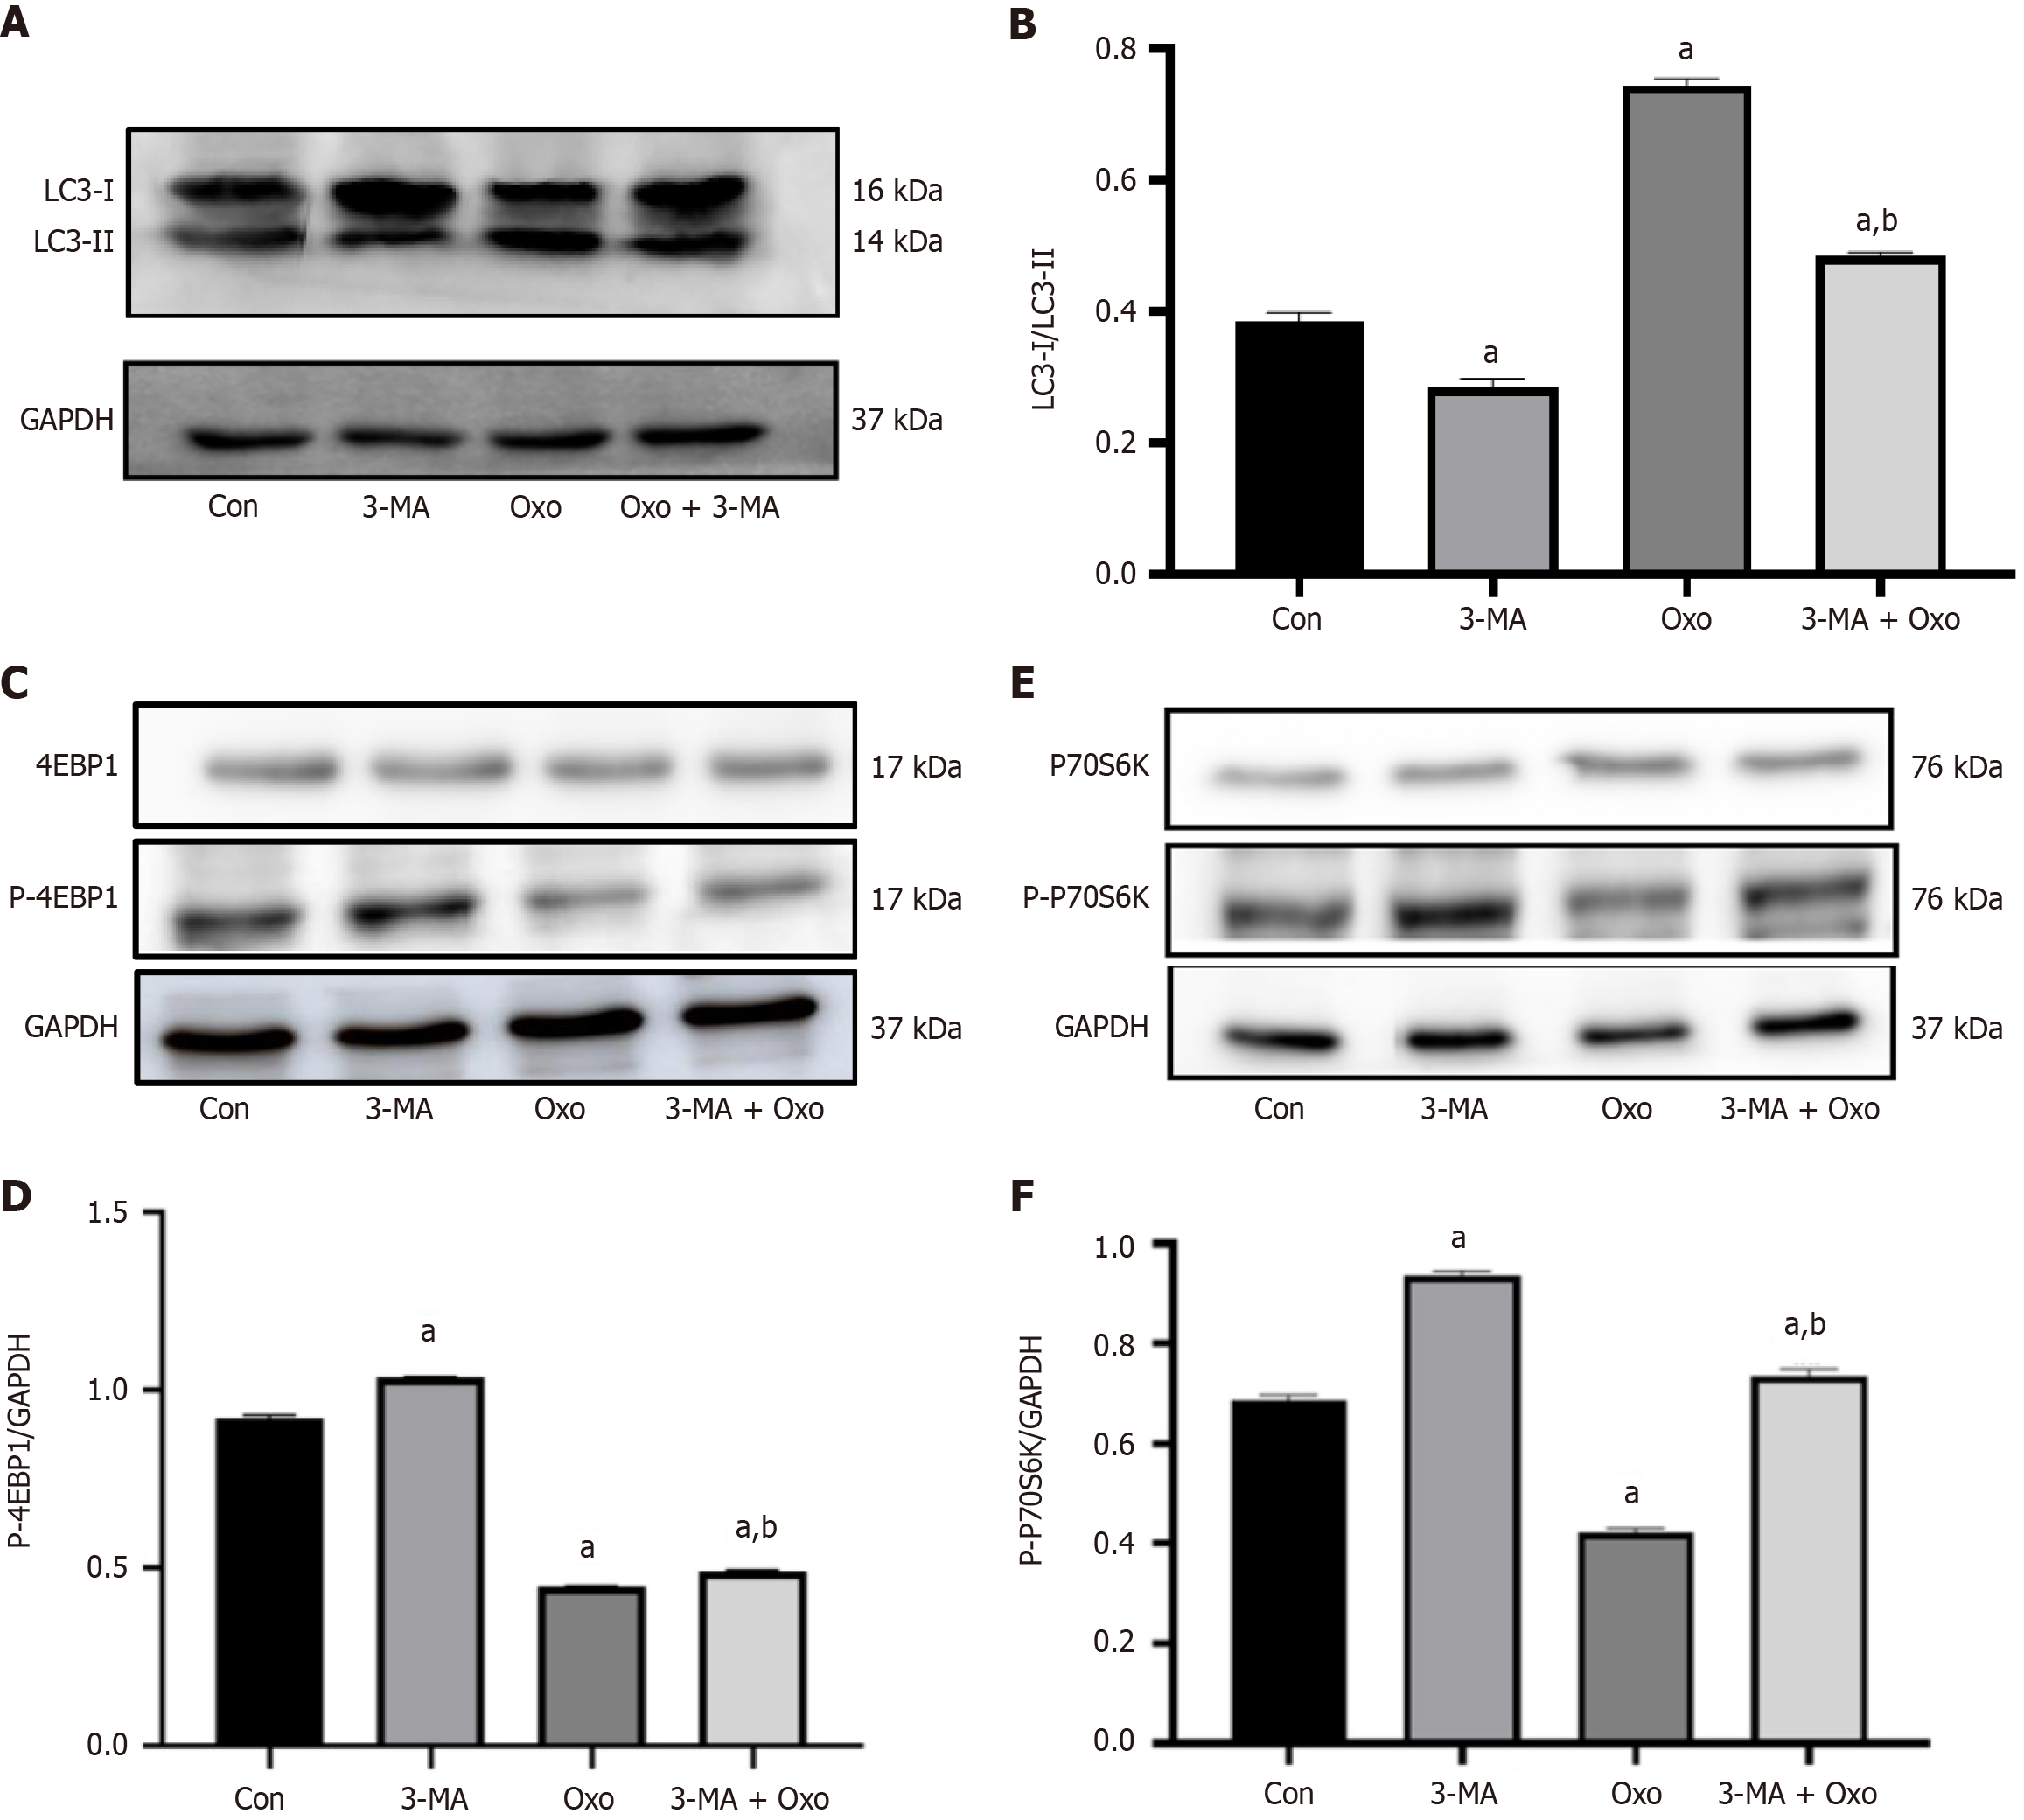
Figure 6 Expression level of LC3 protein and phosphorylation levels of 4EBP1 and P70S6K in Hep3B2.
1-7 cells. A: Western blot analysis of LC3-I and LC3-II protein levels in Hep3B2.1-7 cells after treatment with oxocrebanine. VP16 (32.54 μmol/L) was used as a control; B: Western blot analysis data indicated that the ratio of LC3-II to LC3-I protein expression was increased with oxocrebanine treatments compared with the control group. Compared with oxocrebanine alone, the LC3-II/LC3-I ratio in the 3-MA + oxocrebanine group was significantly decreased; C: Phosphorylation level of 4EBP1 protein in Hep3B2.1-7 cells after treatment with oxocrebanine. VP16 (32.54 μmol/L) was used as a control; D: Western blot analysis data showed that the phosphorylation level of 4EBP1 was downregulated by oxocrebanine treatments compared with the control group. Compared with oxocrebanine alone, the phosphorylation level of 4EBP1 in the 3-MA + oxocrebanine group was significantly upregulated; E: Phosphorylation level of P70S6K in Hep3B2.1-7 cells after treatment with oxocrebanine. VP16 (32.54 μmol/L) was used as a control; F: Western blot analysis data showed that the phosphorylation level of P70S6K protein was downregulated by oxocrebanine treatments. Compared with oxocrebanine alone, the phosphorylation level of P70S6K protein in the 3-MA + oxocrebanine group was significantly upregulated. Data are shown as the mean ± SD. aP < 0.01 vs control; bP < 0.01 vs oxocrebanine group (n = 3).
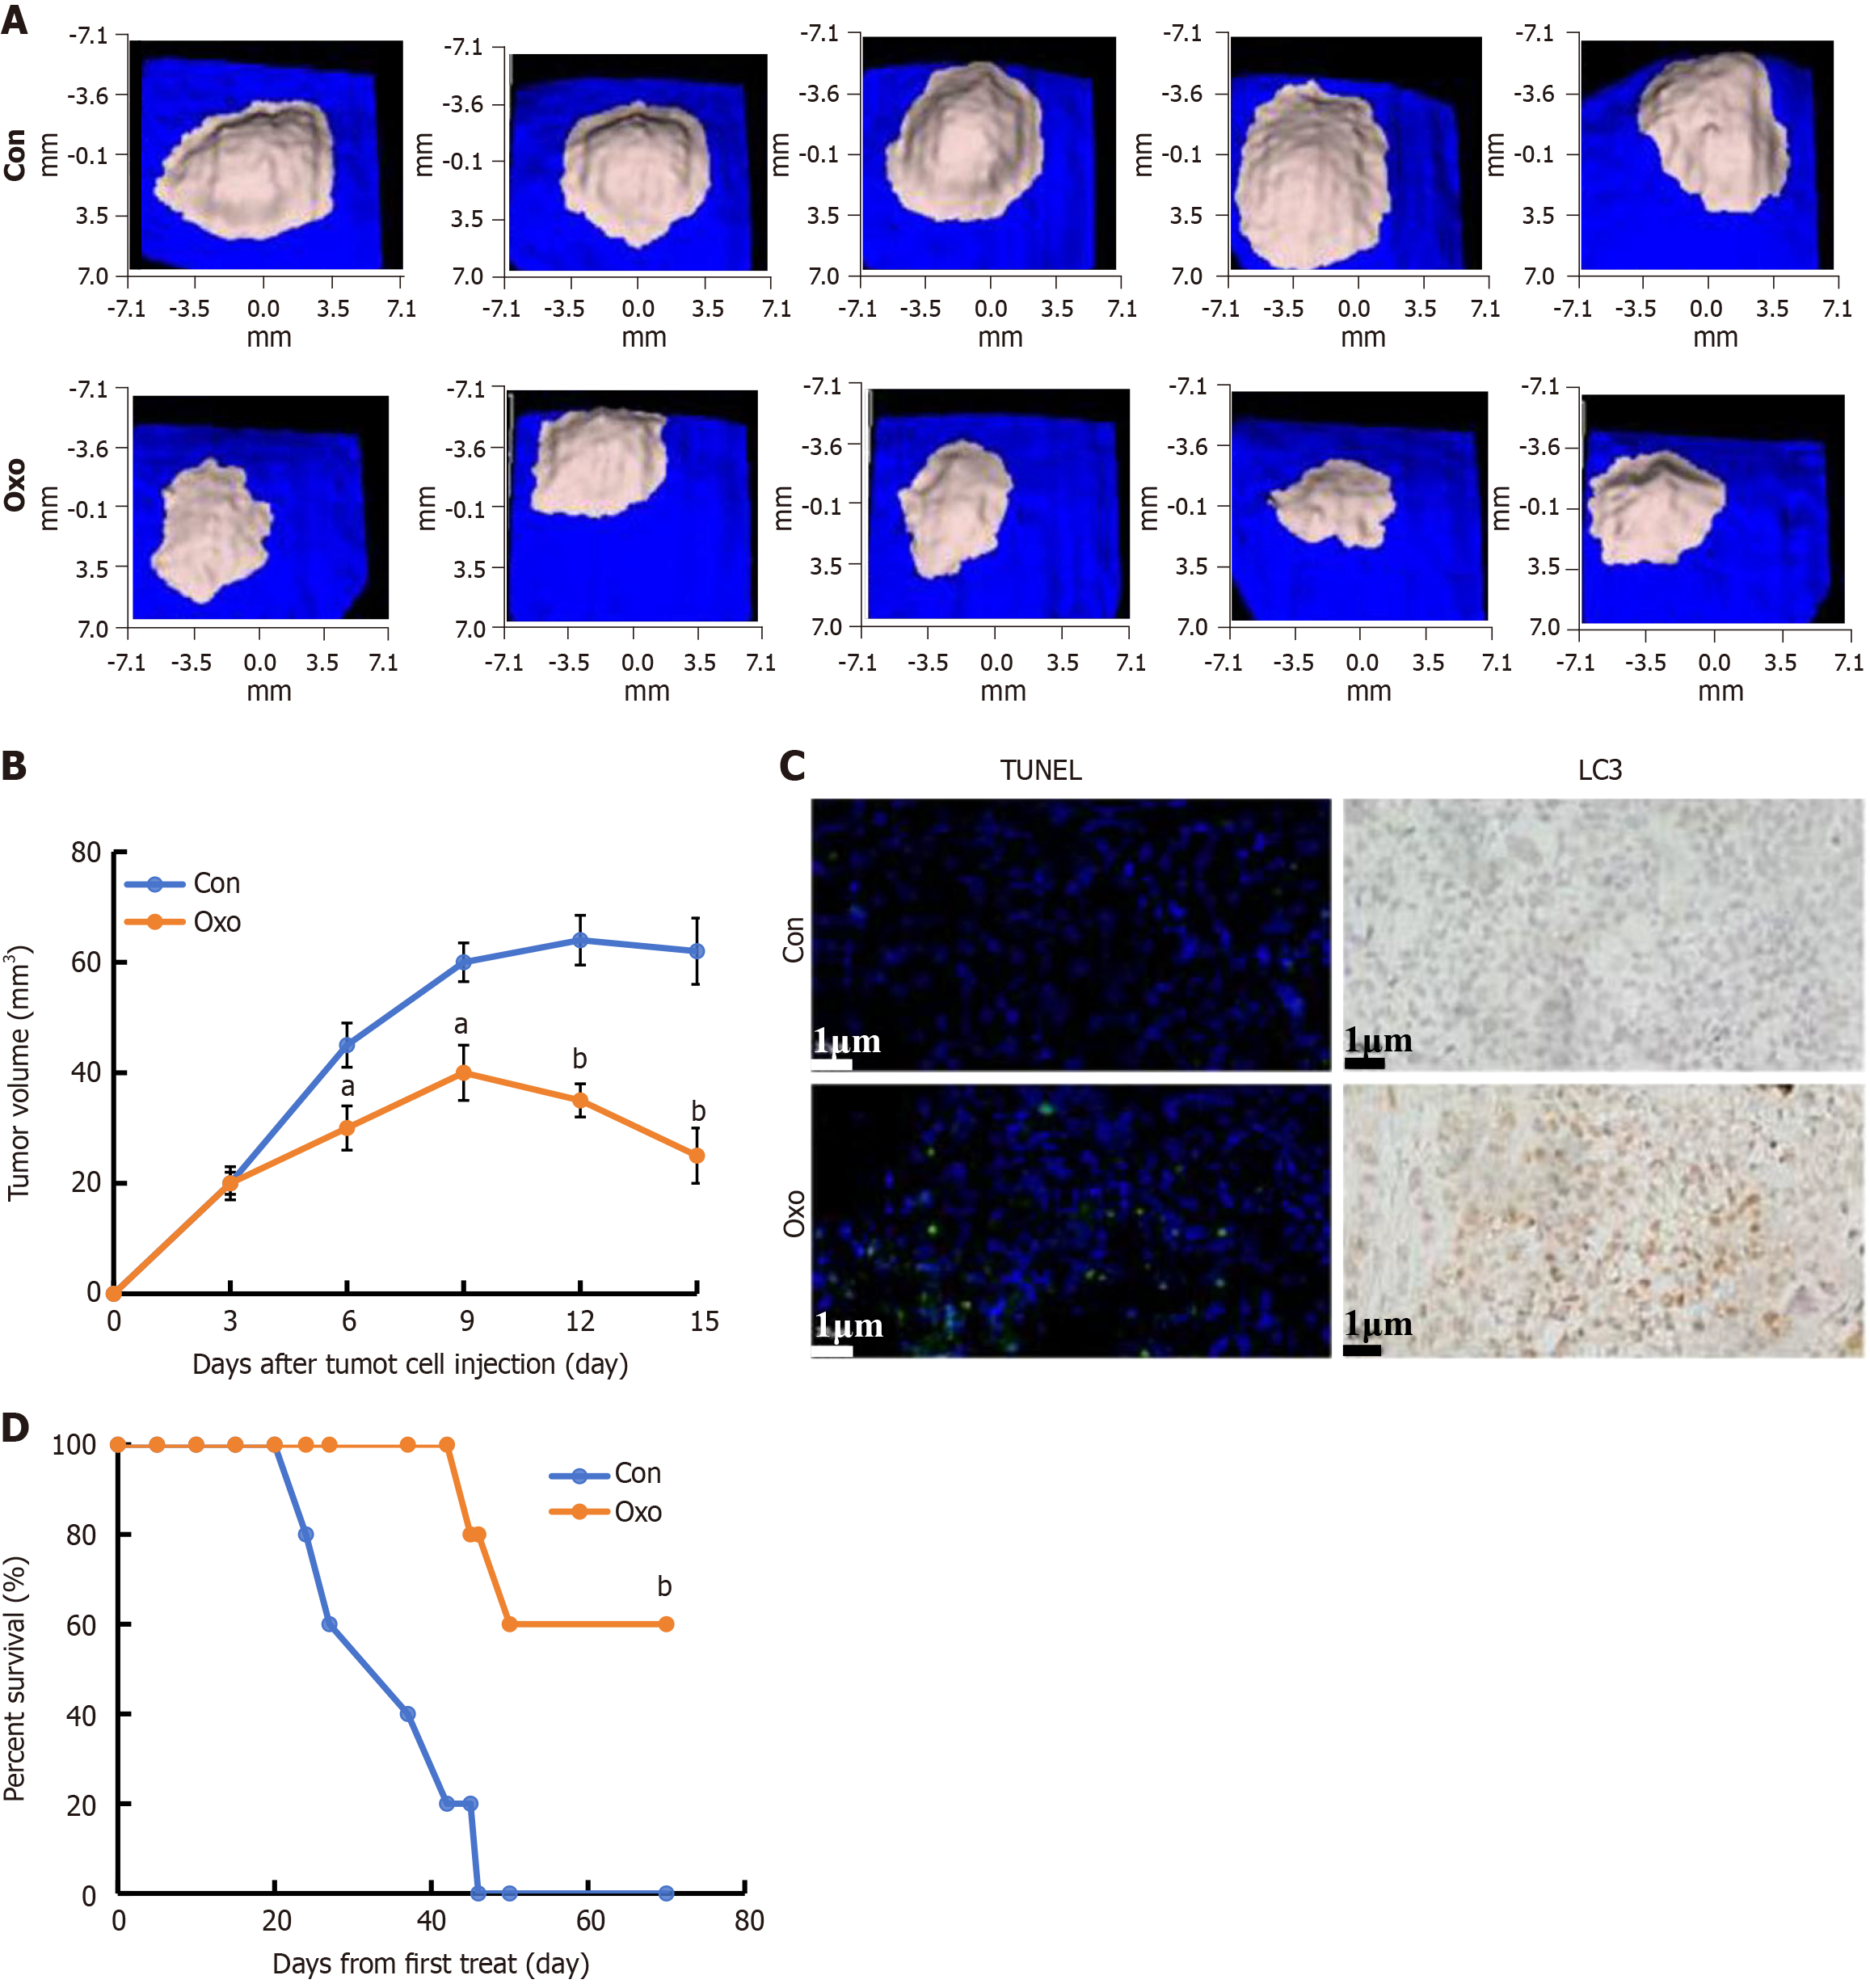
Figure 7 Inhibitory effect of oxocrebanine on growth of Hep3B2.
1-7 cells in vivo. Hep3B2.1-7 cells were injected into the right flanks of Nu/Nu mice (5 mice/group). When tumor volumes reached 50 mm3, mice were treated with indicated formulations every 3 days for 5 times. A: Tumor mass images of Hep3B2.1-7 model mice at day 18; B: Tumor volumes at different time points; C: Apoptosis and LC3 expression in tumor xenografts detected by TUNEL and IHC, respectively; D: Survival curve. Data are shown as the mean ± SD; aP < 0.05 vs control; bP < 0.01 vs control.
- Citation: Wang ZW, Pan CY, Wei CL, Liao H, Zhang XP, Zhang CY, Yu L. Oxocrebanine inhibits the proliferation of hepatocellular carcinoma cells by promoting apoptosis and autophagy. World J Gastrointest Oncol 2025; 17(6): 105570
- URL: https://www.wjgnet.com/1948-5204/full/v17/i6/105570.htm
- DOI: https://dx.doi.org/10.4251/wjgo.v17.i6.105570


