Copyright
©The Author(s) 2025.
World J Gastrointest Oncol. Jun 15, 2025; 17(6): 105213
Published online Jun 15, 2025. doi: 10.4251/wjgo.v17.i6.105213
Published online Jun 15, 2025. doi: 10.4251/wjgo.v17.i6.105213
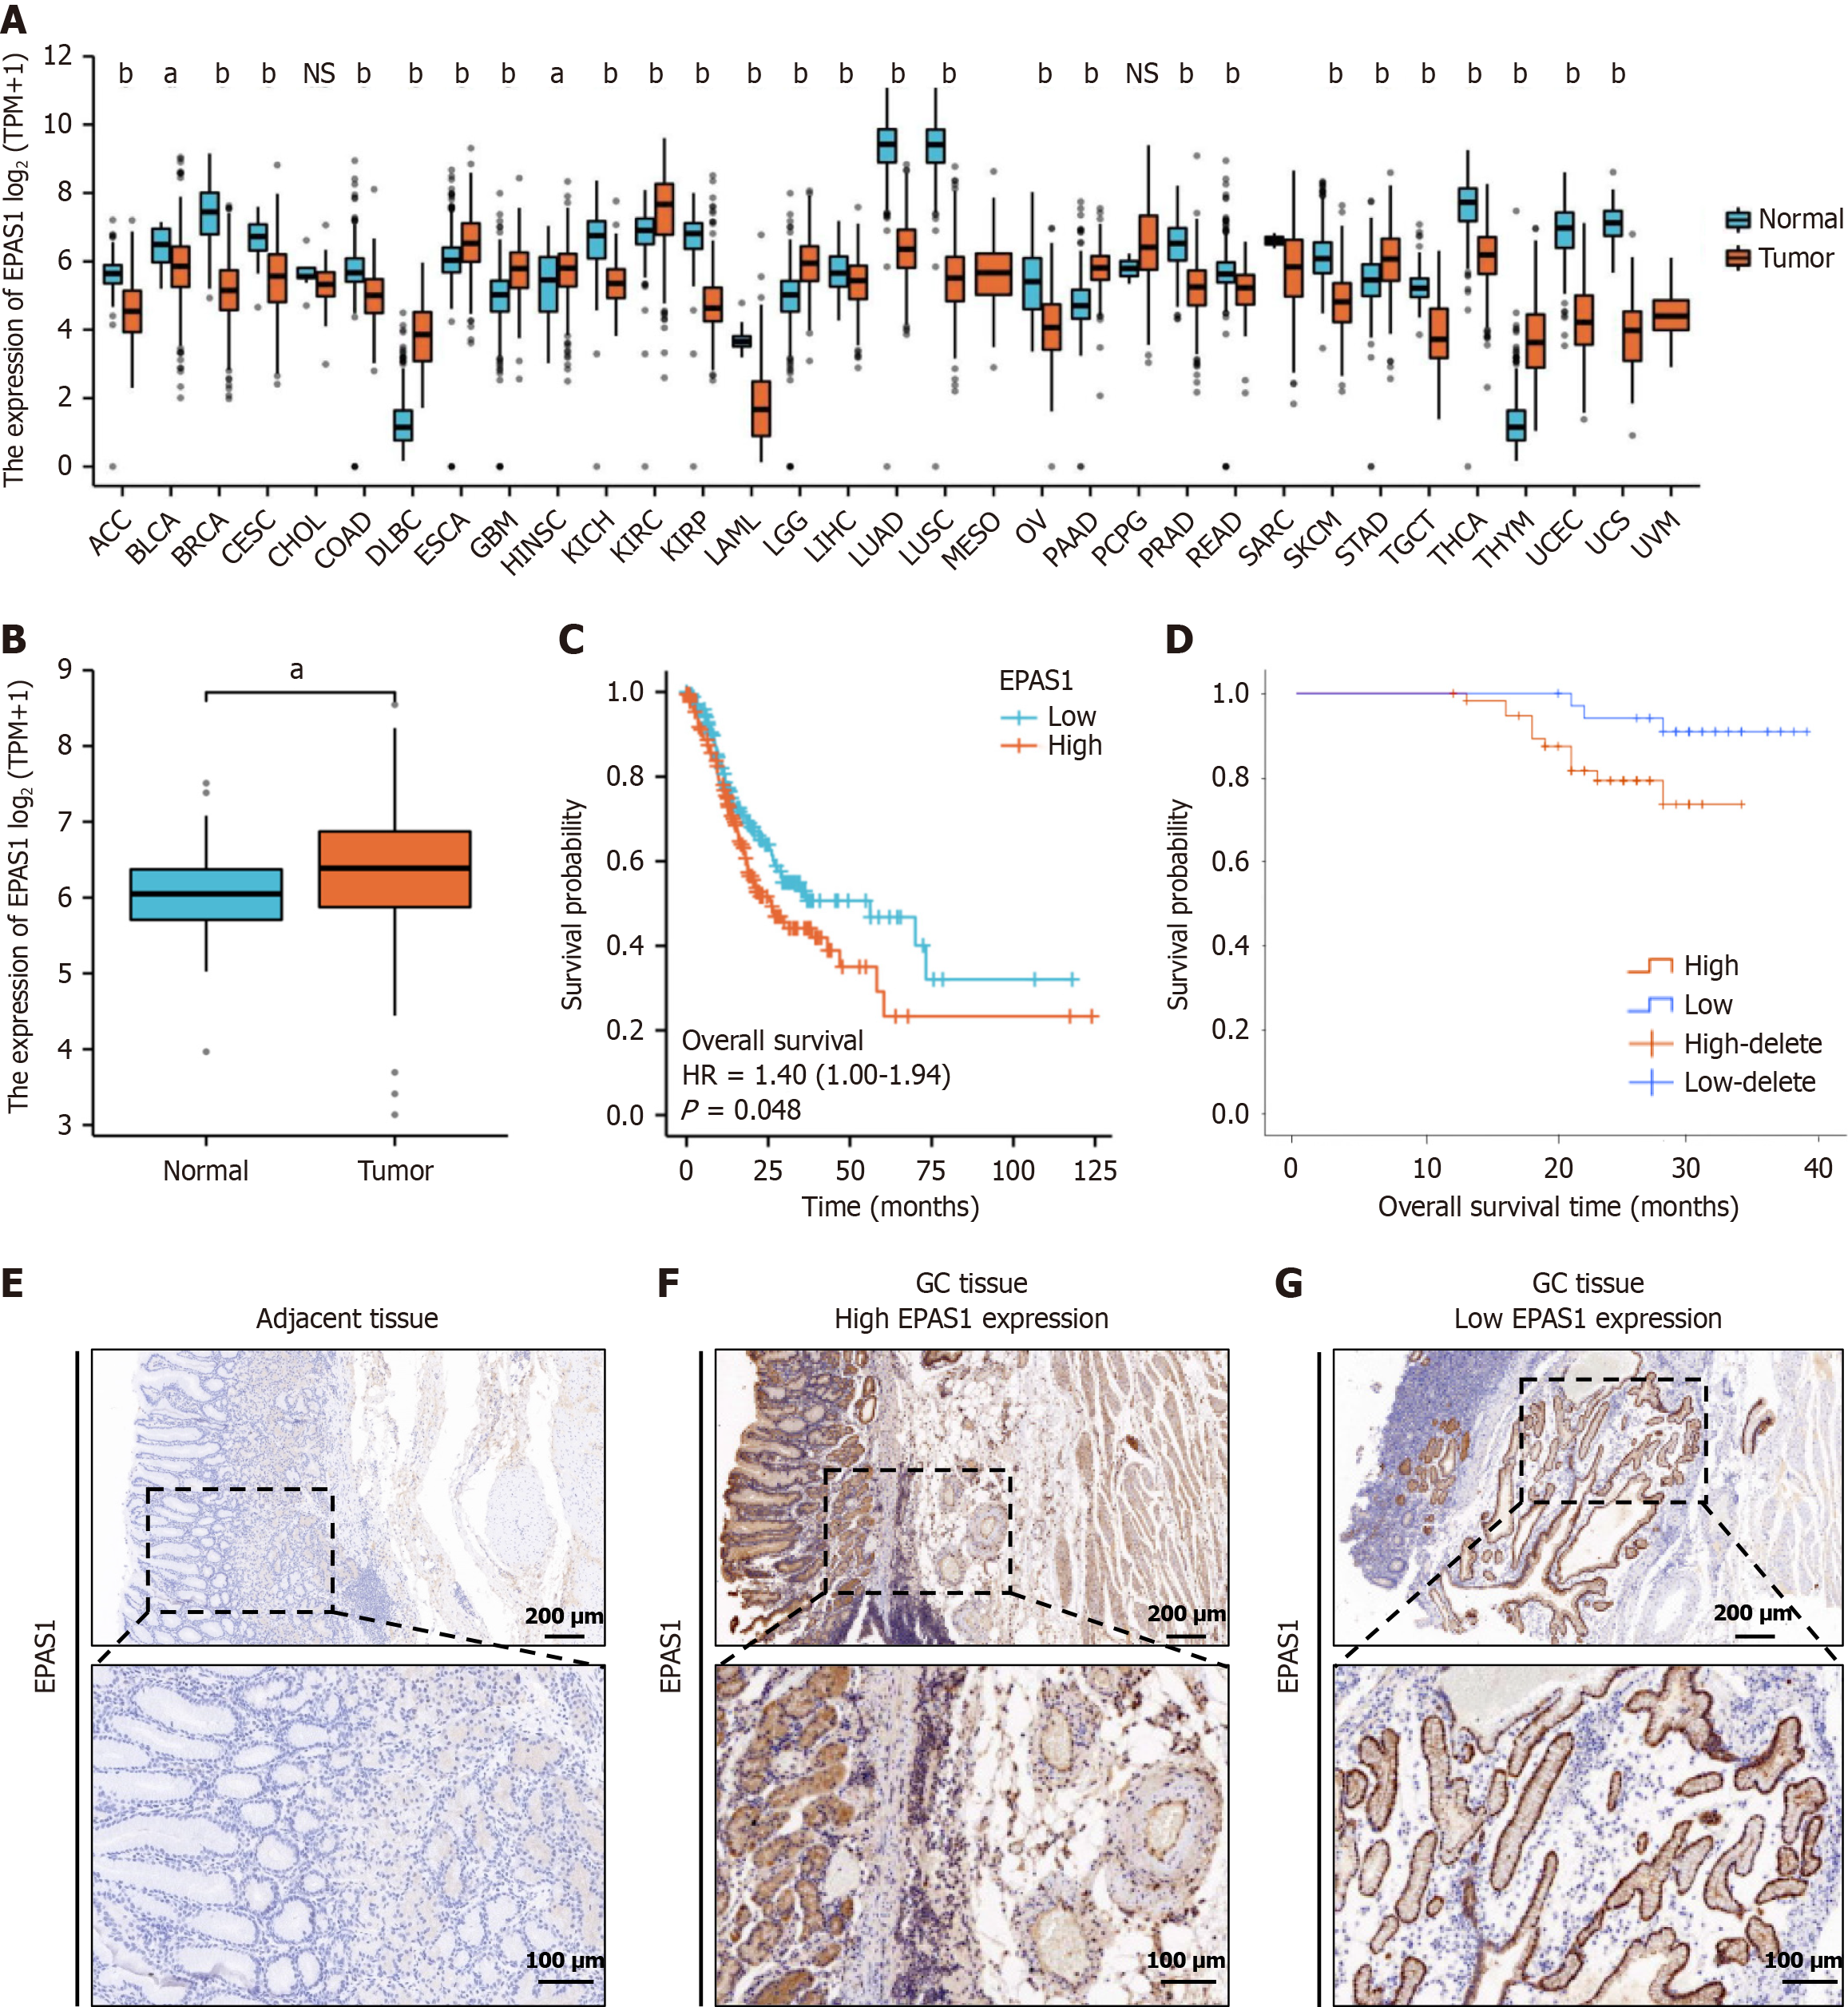
Figure 1 The expression of EPAS1 in patients with pan-cancer and gastric cancer.
A: The expression of EPAS1 in The Cancer Genome Atlas (TCGA) pan-cancer data; B: The expression of EPAS1 in gastric cancer (GC) tissue from TCGA; C: The correlation between EPAS1 expression and survival status in TCGA; D: The correlation between EPAS1 expression and survival status in clinical data; E: Expression of EPAS1 in adjacent tissue; F: GC tissue with low EPAS1 expression; G: GC tissue with high EPAS1 expression. aP < 0.05, bP < 0.01.
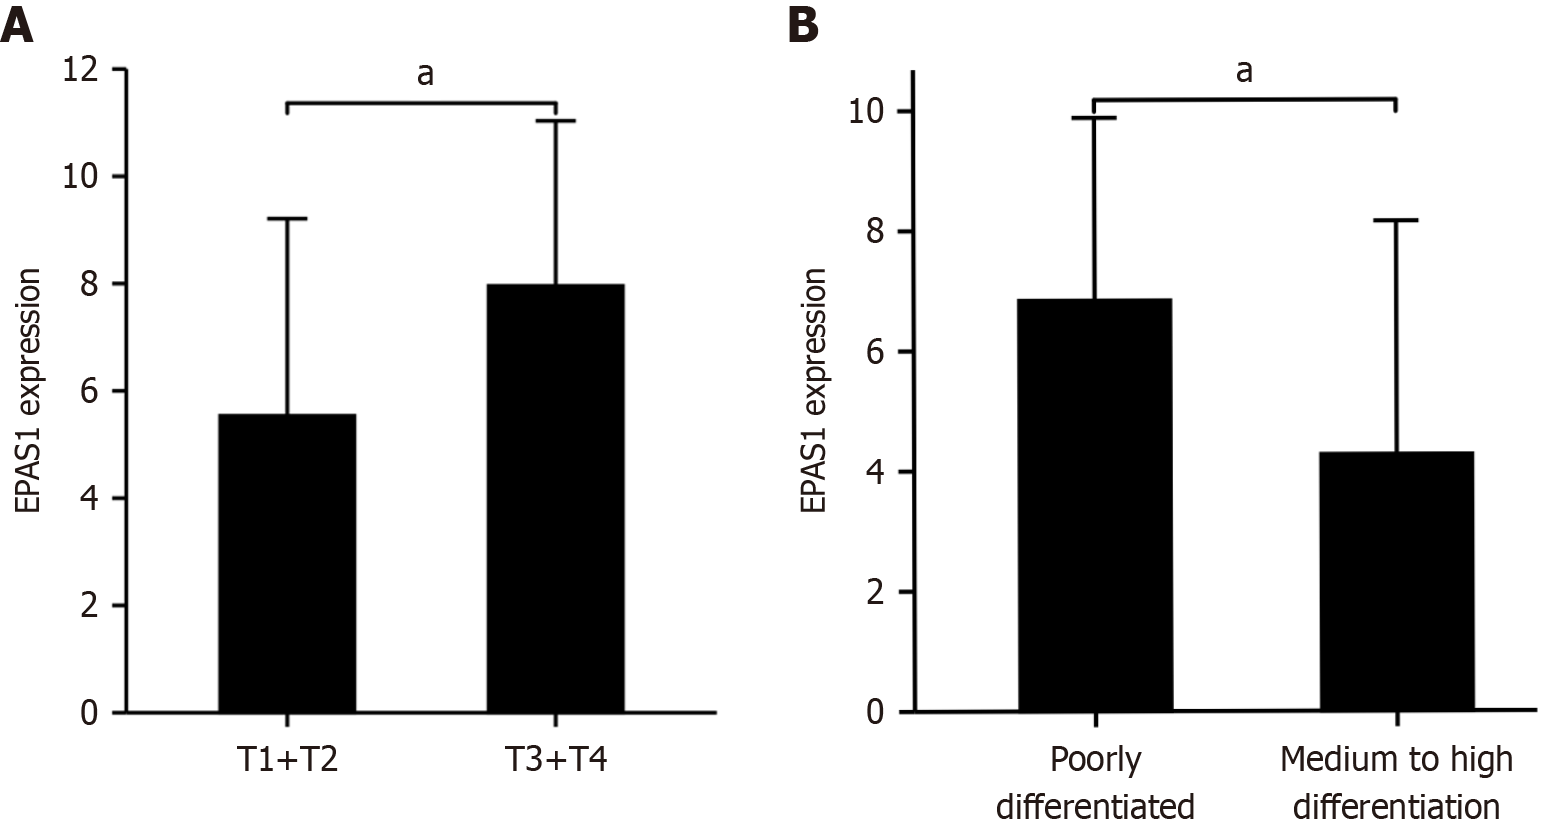
Figure 2 Correlation between EPAS1 expression and clinicopathological features of gastric cancer.
A: The expression of EPAS1 in gastric cancer (GC) had a clear correlation with the infiltration depth of the primary tumor; B: The expression of EPAS1 in GC had a clear correlation with the differentiation degree of the primary tumor. aP < 0.05.
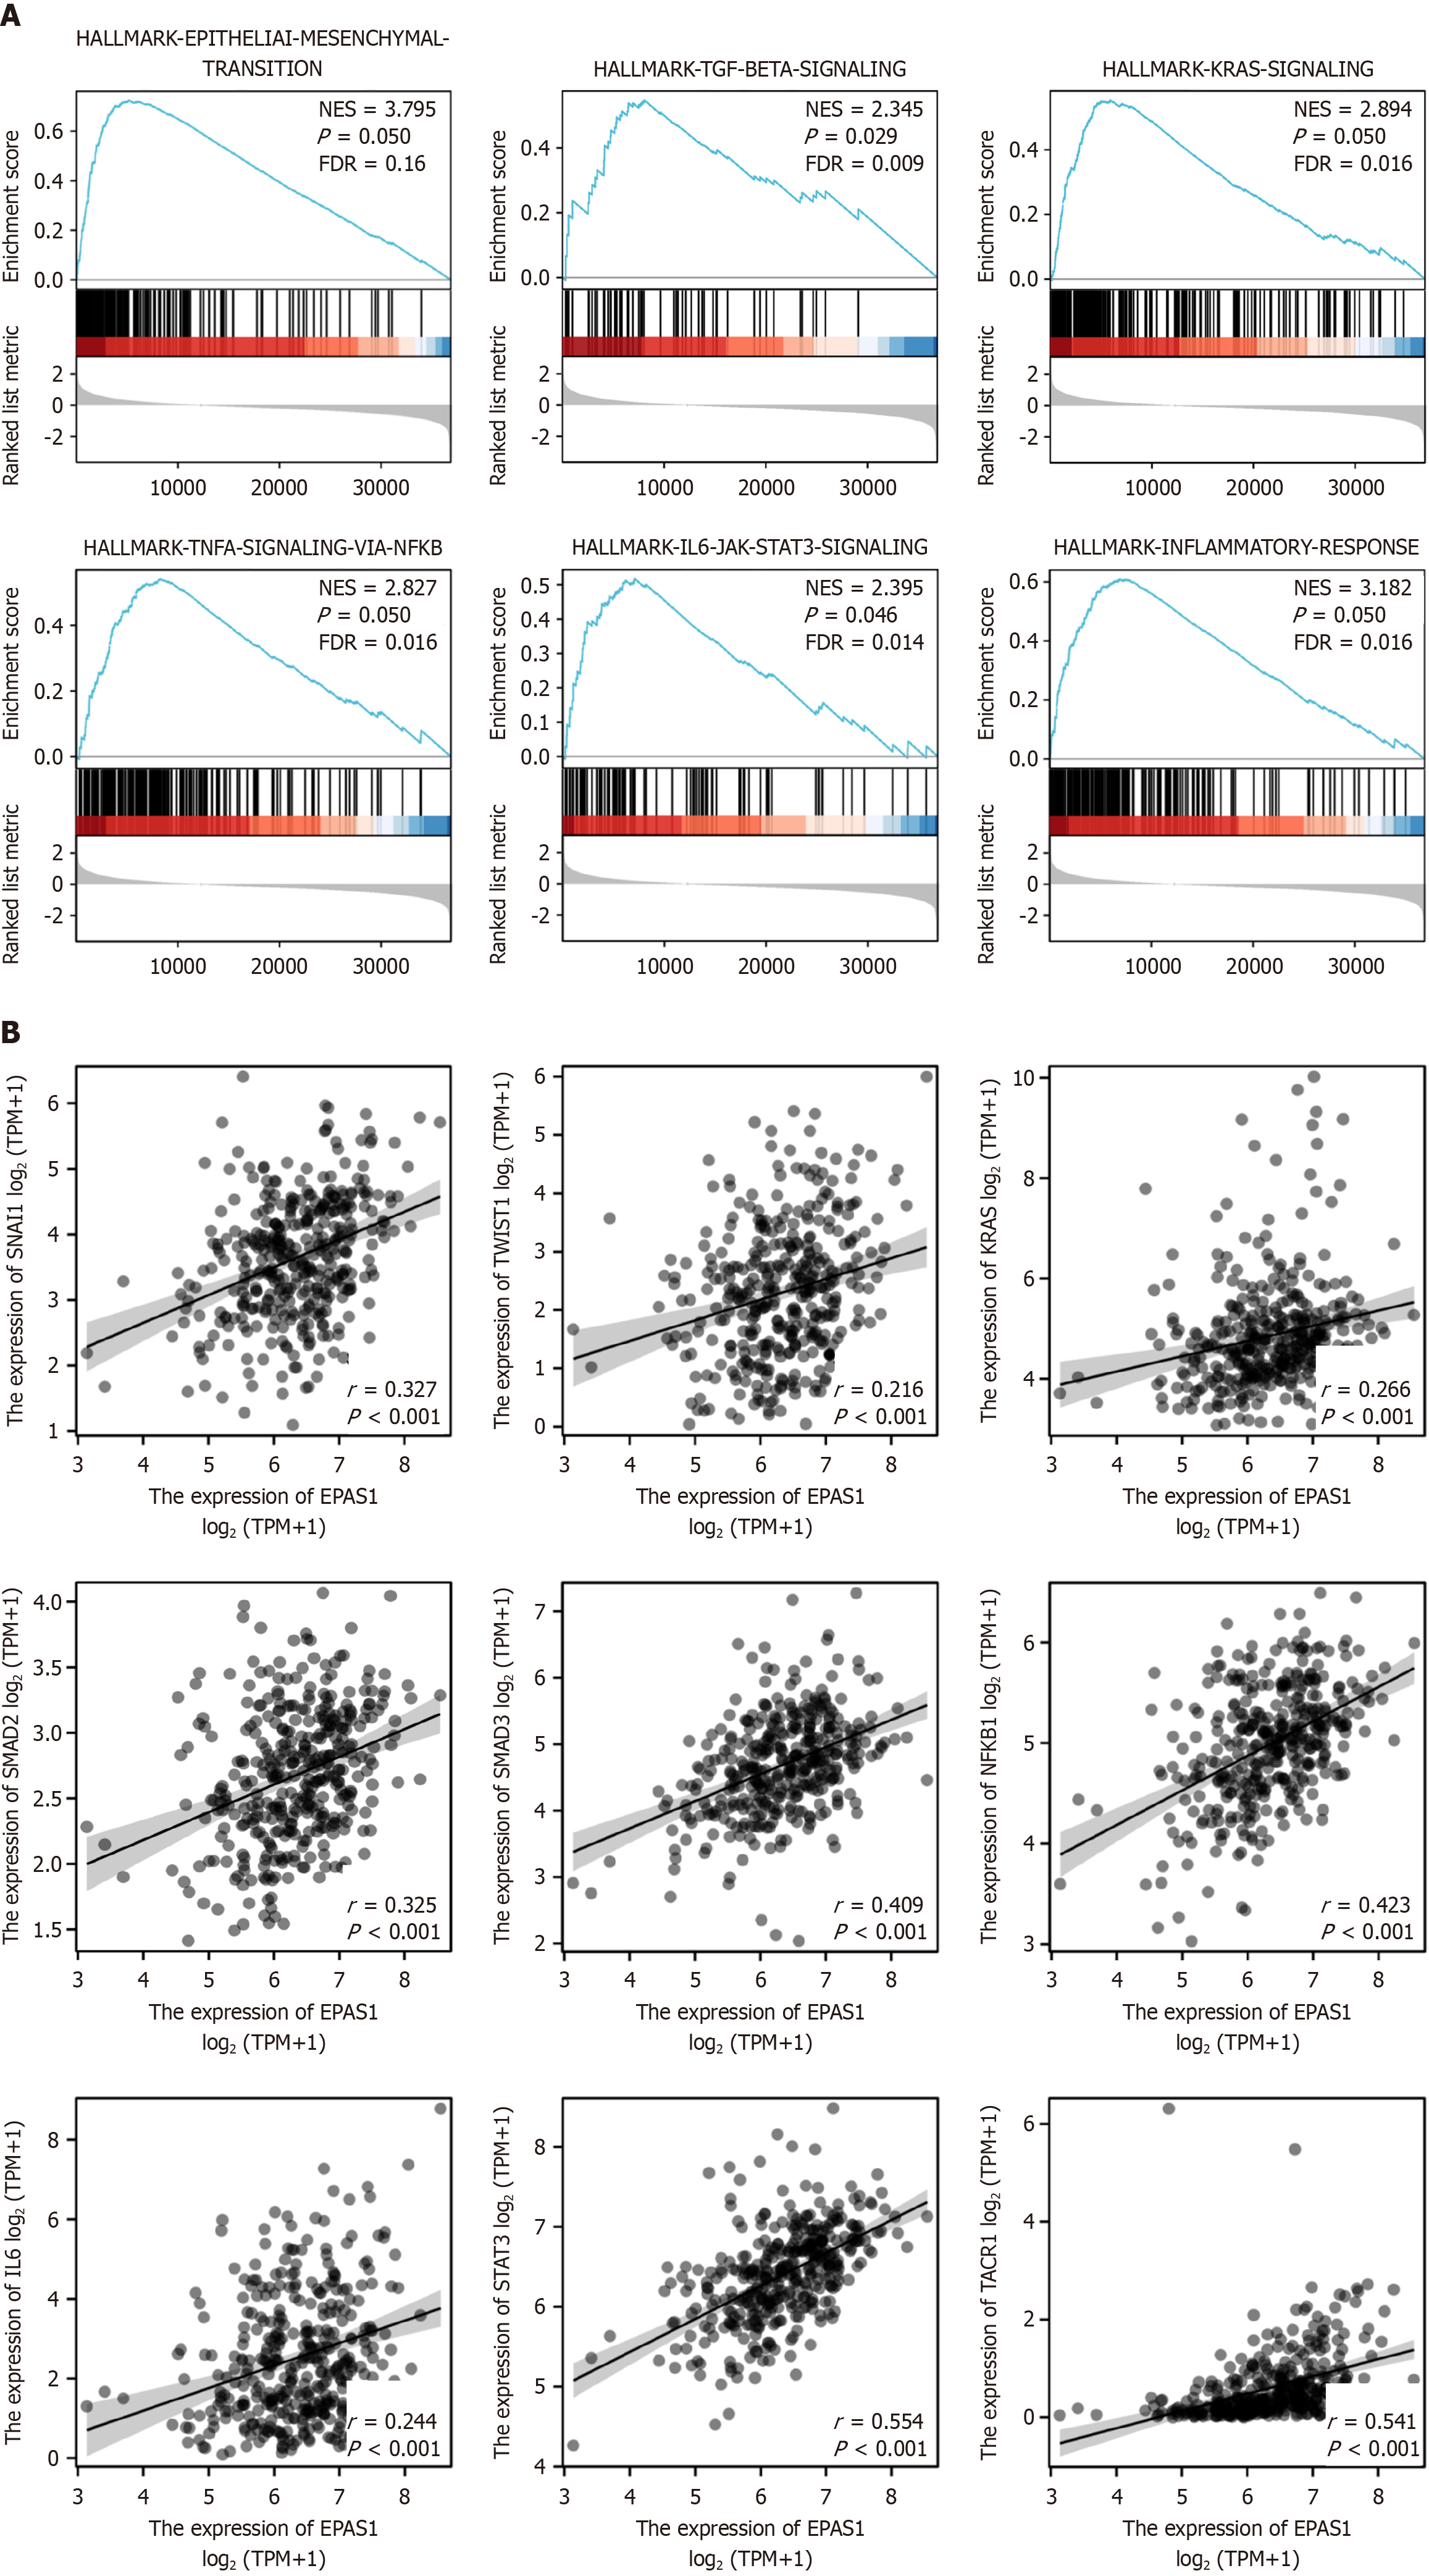
Figure 3 Correlation analysis of EPAS1 expression and signaling pathway-related molecules.
A: EPAS1 regulates the progression of gastric cancer through multiple signaling pathways; B: Molecular correlation analysis between EPAS1 and signaling pathway-related molecules.
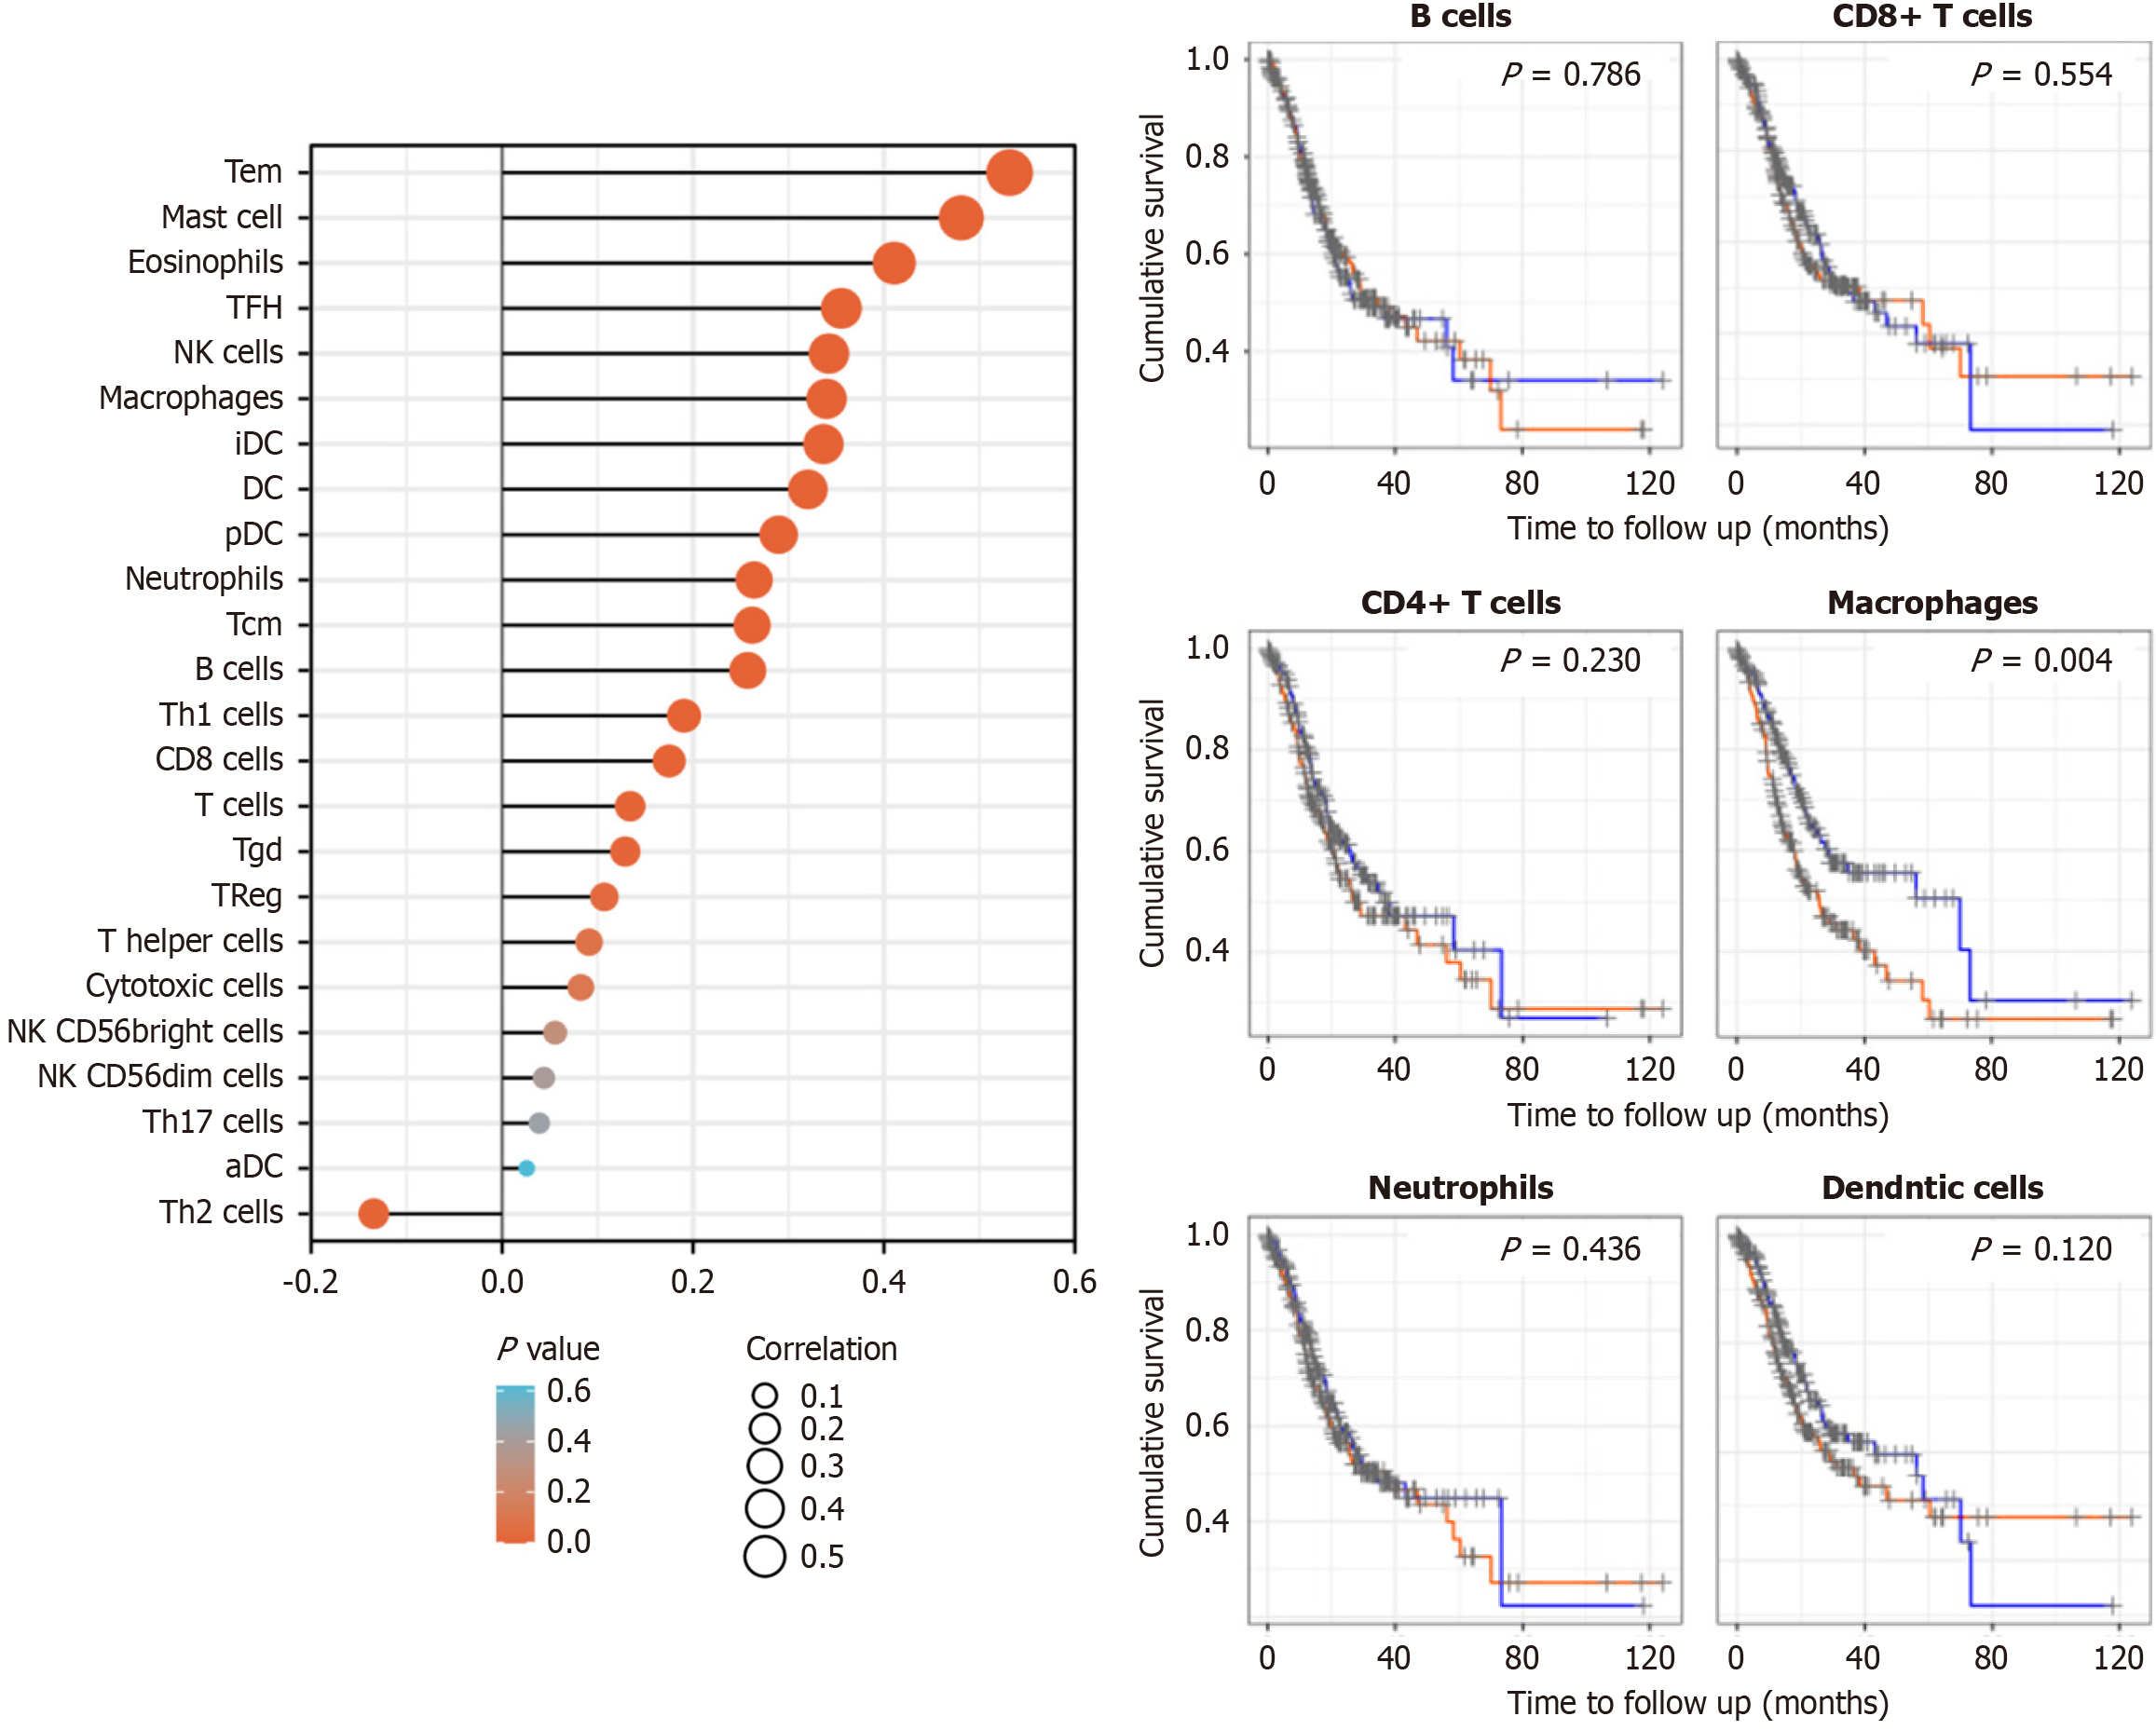
Figure 4 Correlation between EPAS1 expression and immune cell infiltration.
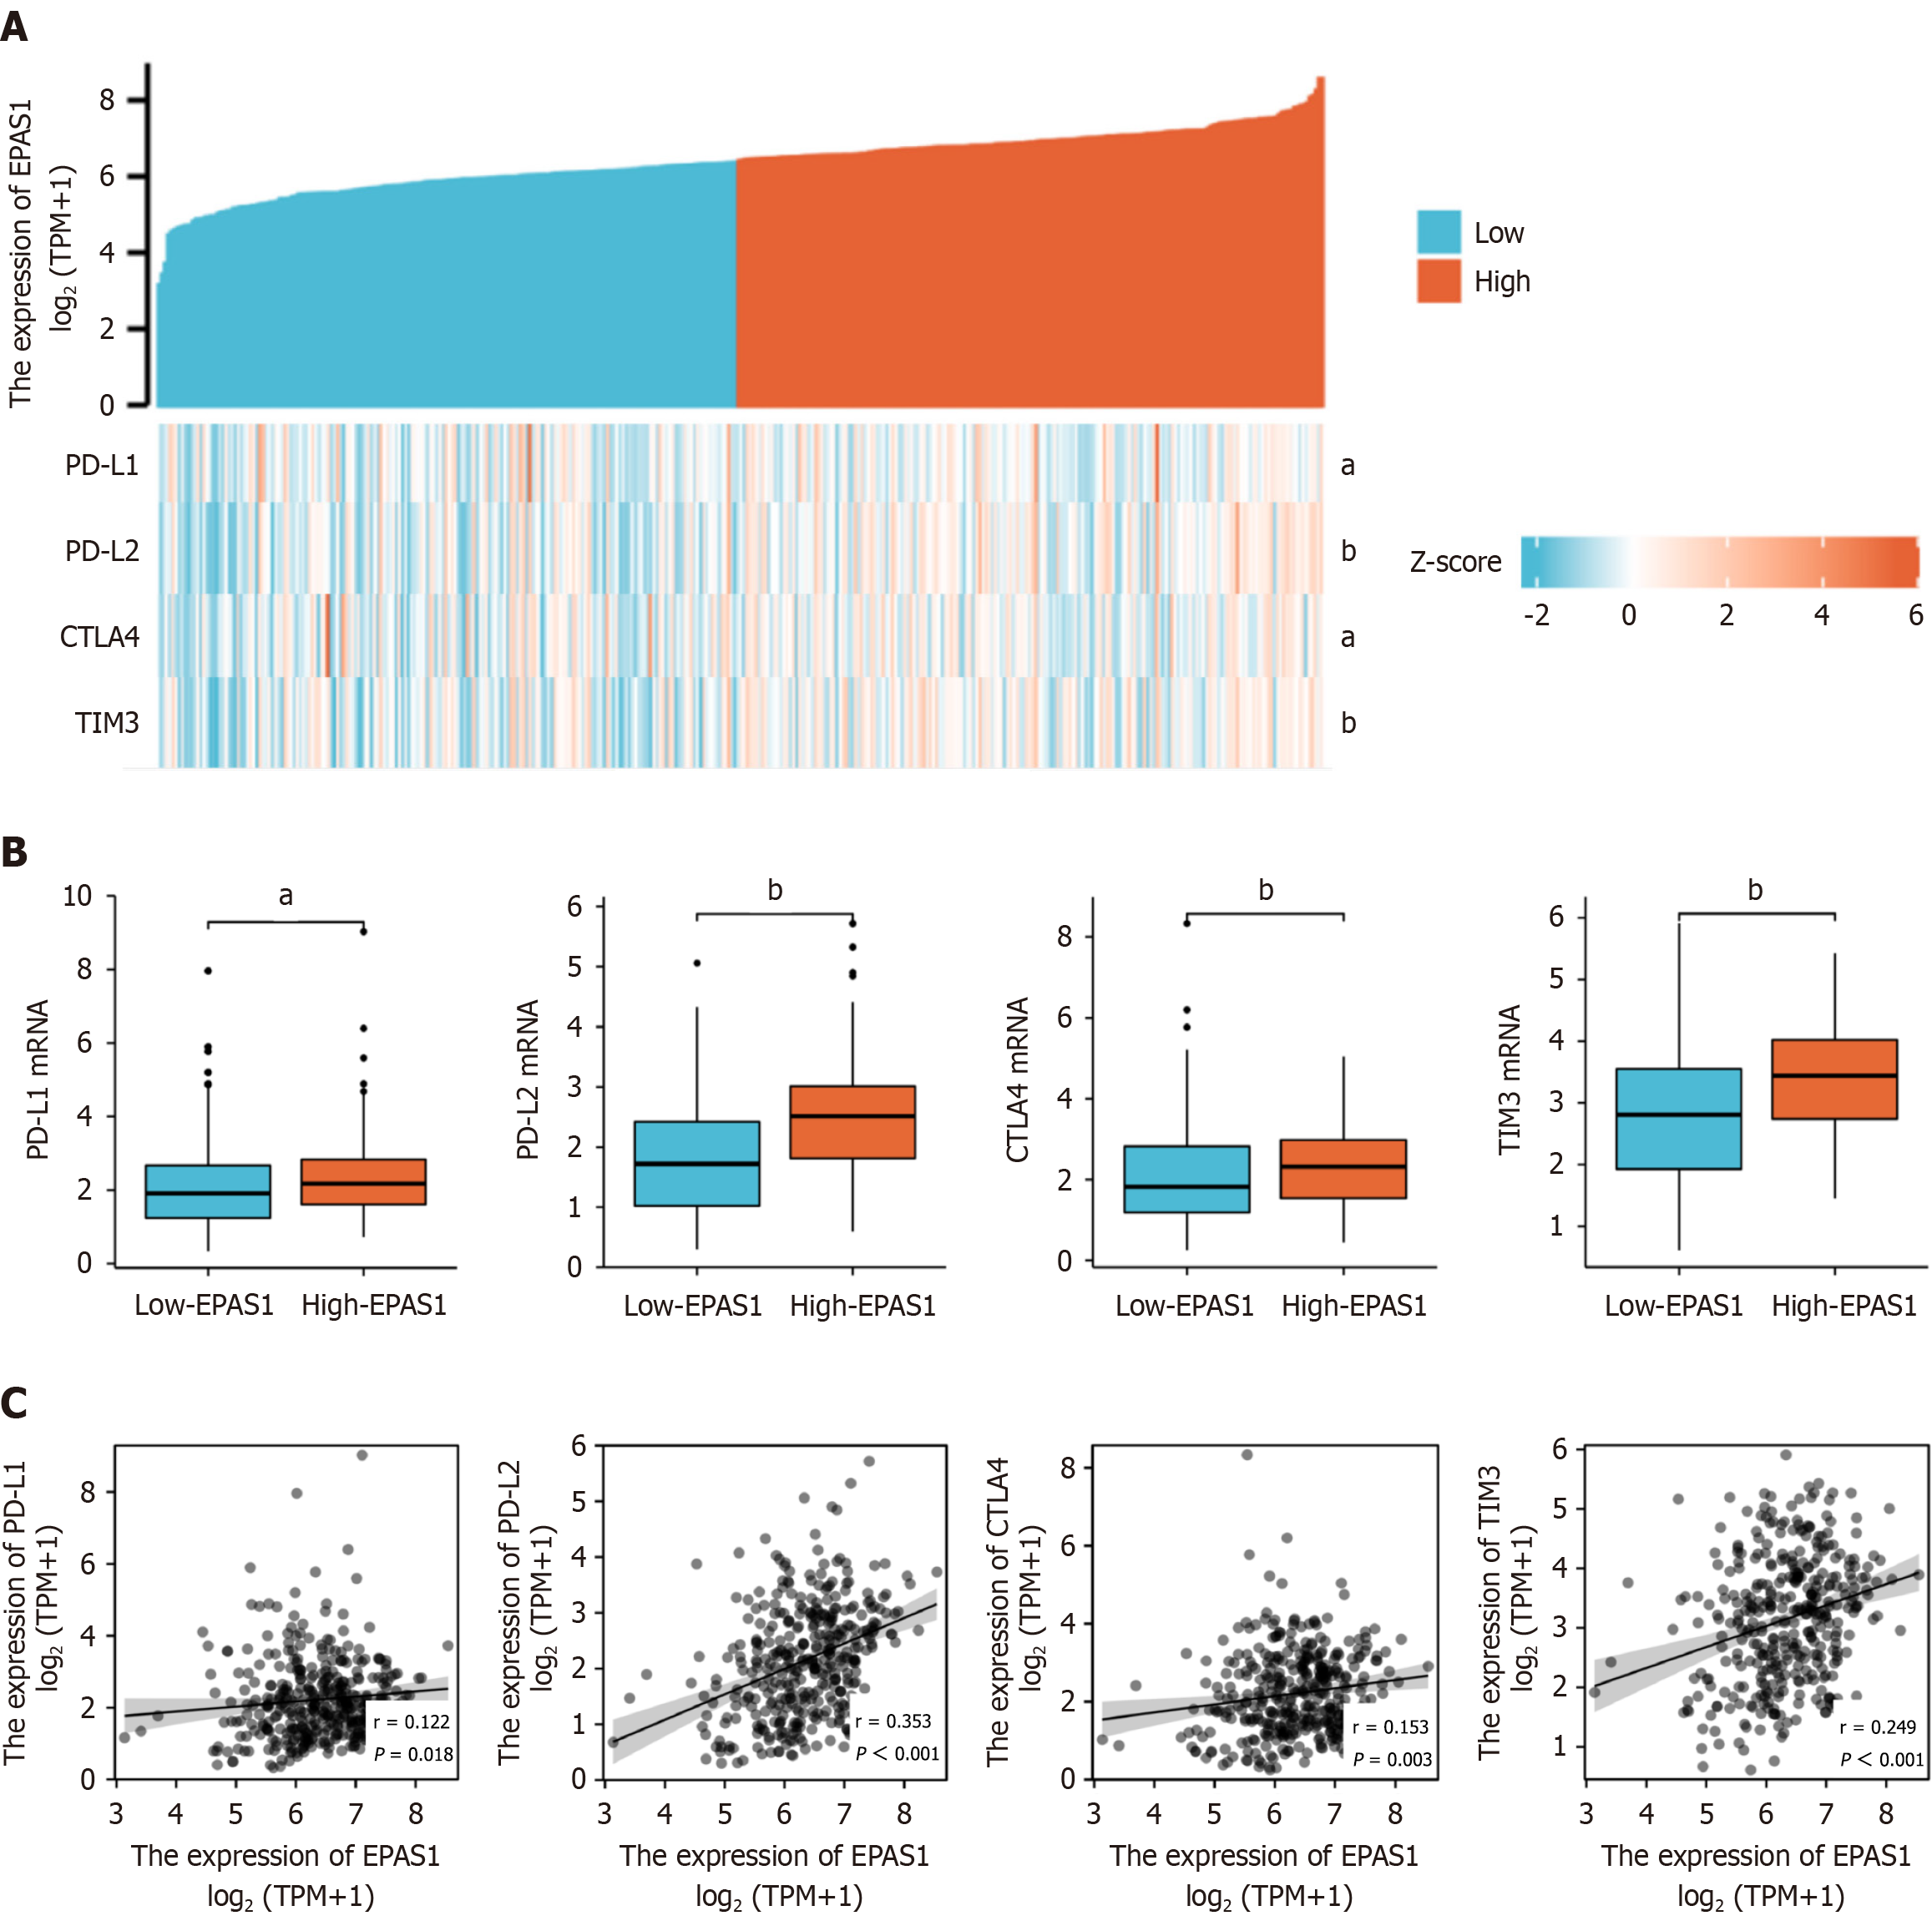
Figure 5 Correlation between different expression levels of EPAS1 and immunotherapy checkpoints.
A: Heatmap of immune checkpoints based on EPAS1 expression in the stomach; B: Upregulation of EPAS1 increases the expression of immunotherapy checkpoints; C: The correlation between EPAS1 expression and immune checkpoints. aP < 0.05, bP < 0.01.
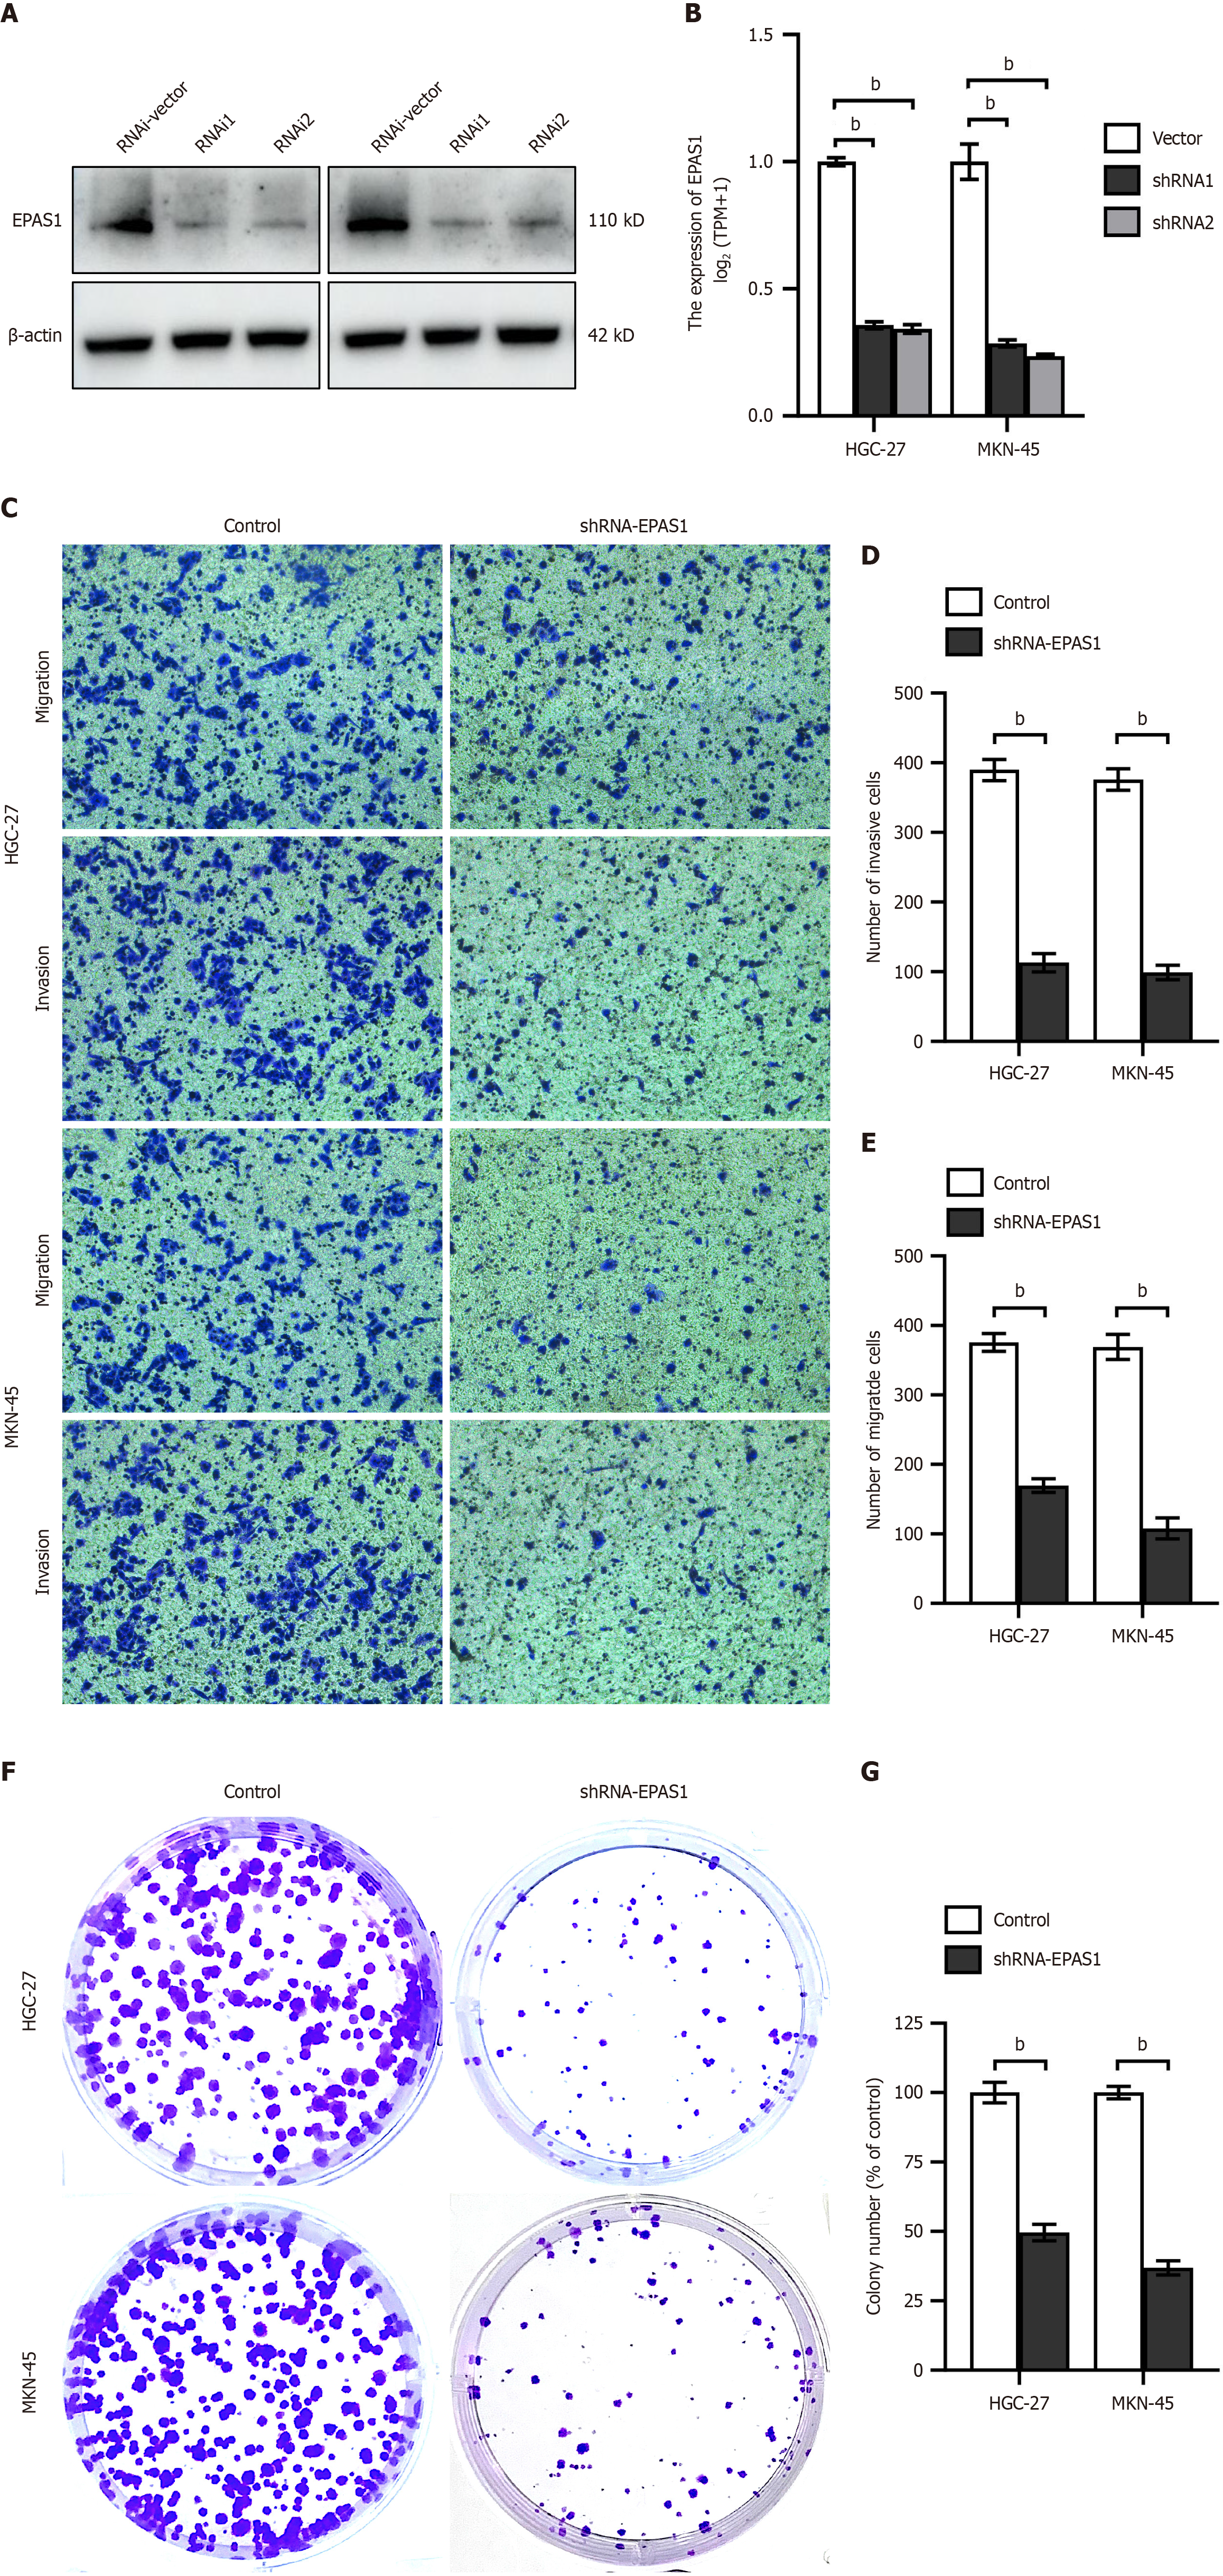
Figure 6 Inhibition of gastric cancer cell function after transfection with shRNA-EPAS1 in vitro.
A and B: Validation of transfection efficiency of shRNA-EPAS1; C-E: Transwell analysis showed the migration and invasion ability of gastric cancer (GC) cells transfected with shRNA-EPAS1; F and G: Colony formation assay showing the proliferative capacity of GC cells after transfection with shRNA-EPAS1. bP < 0.01.
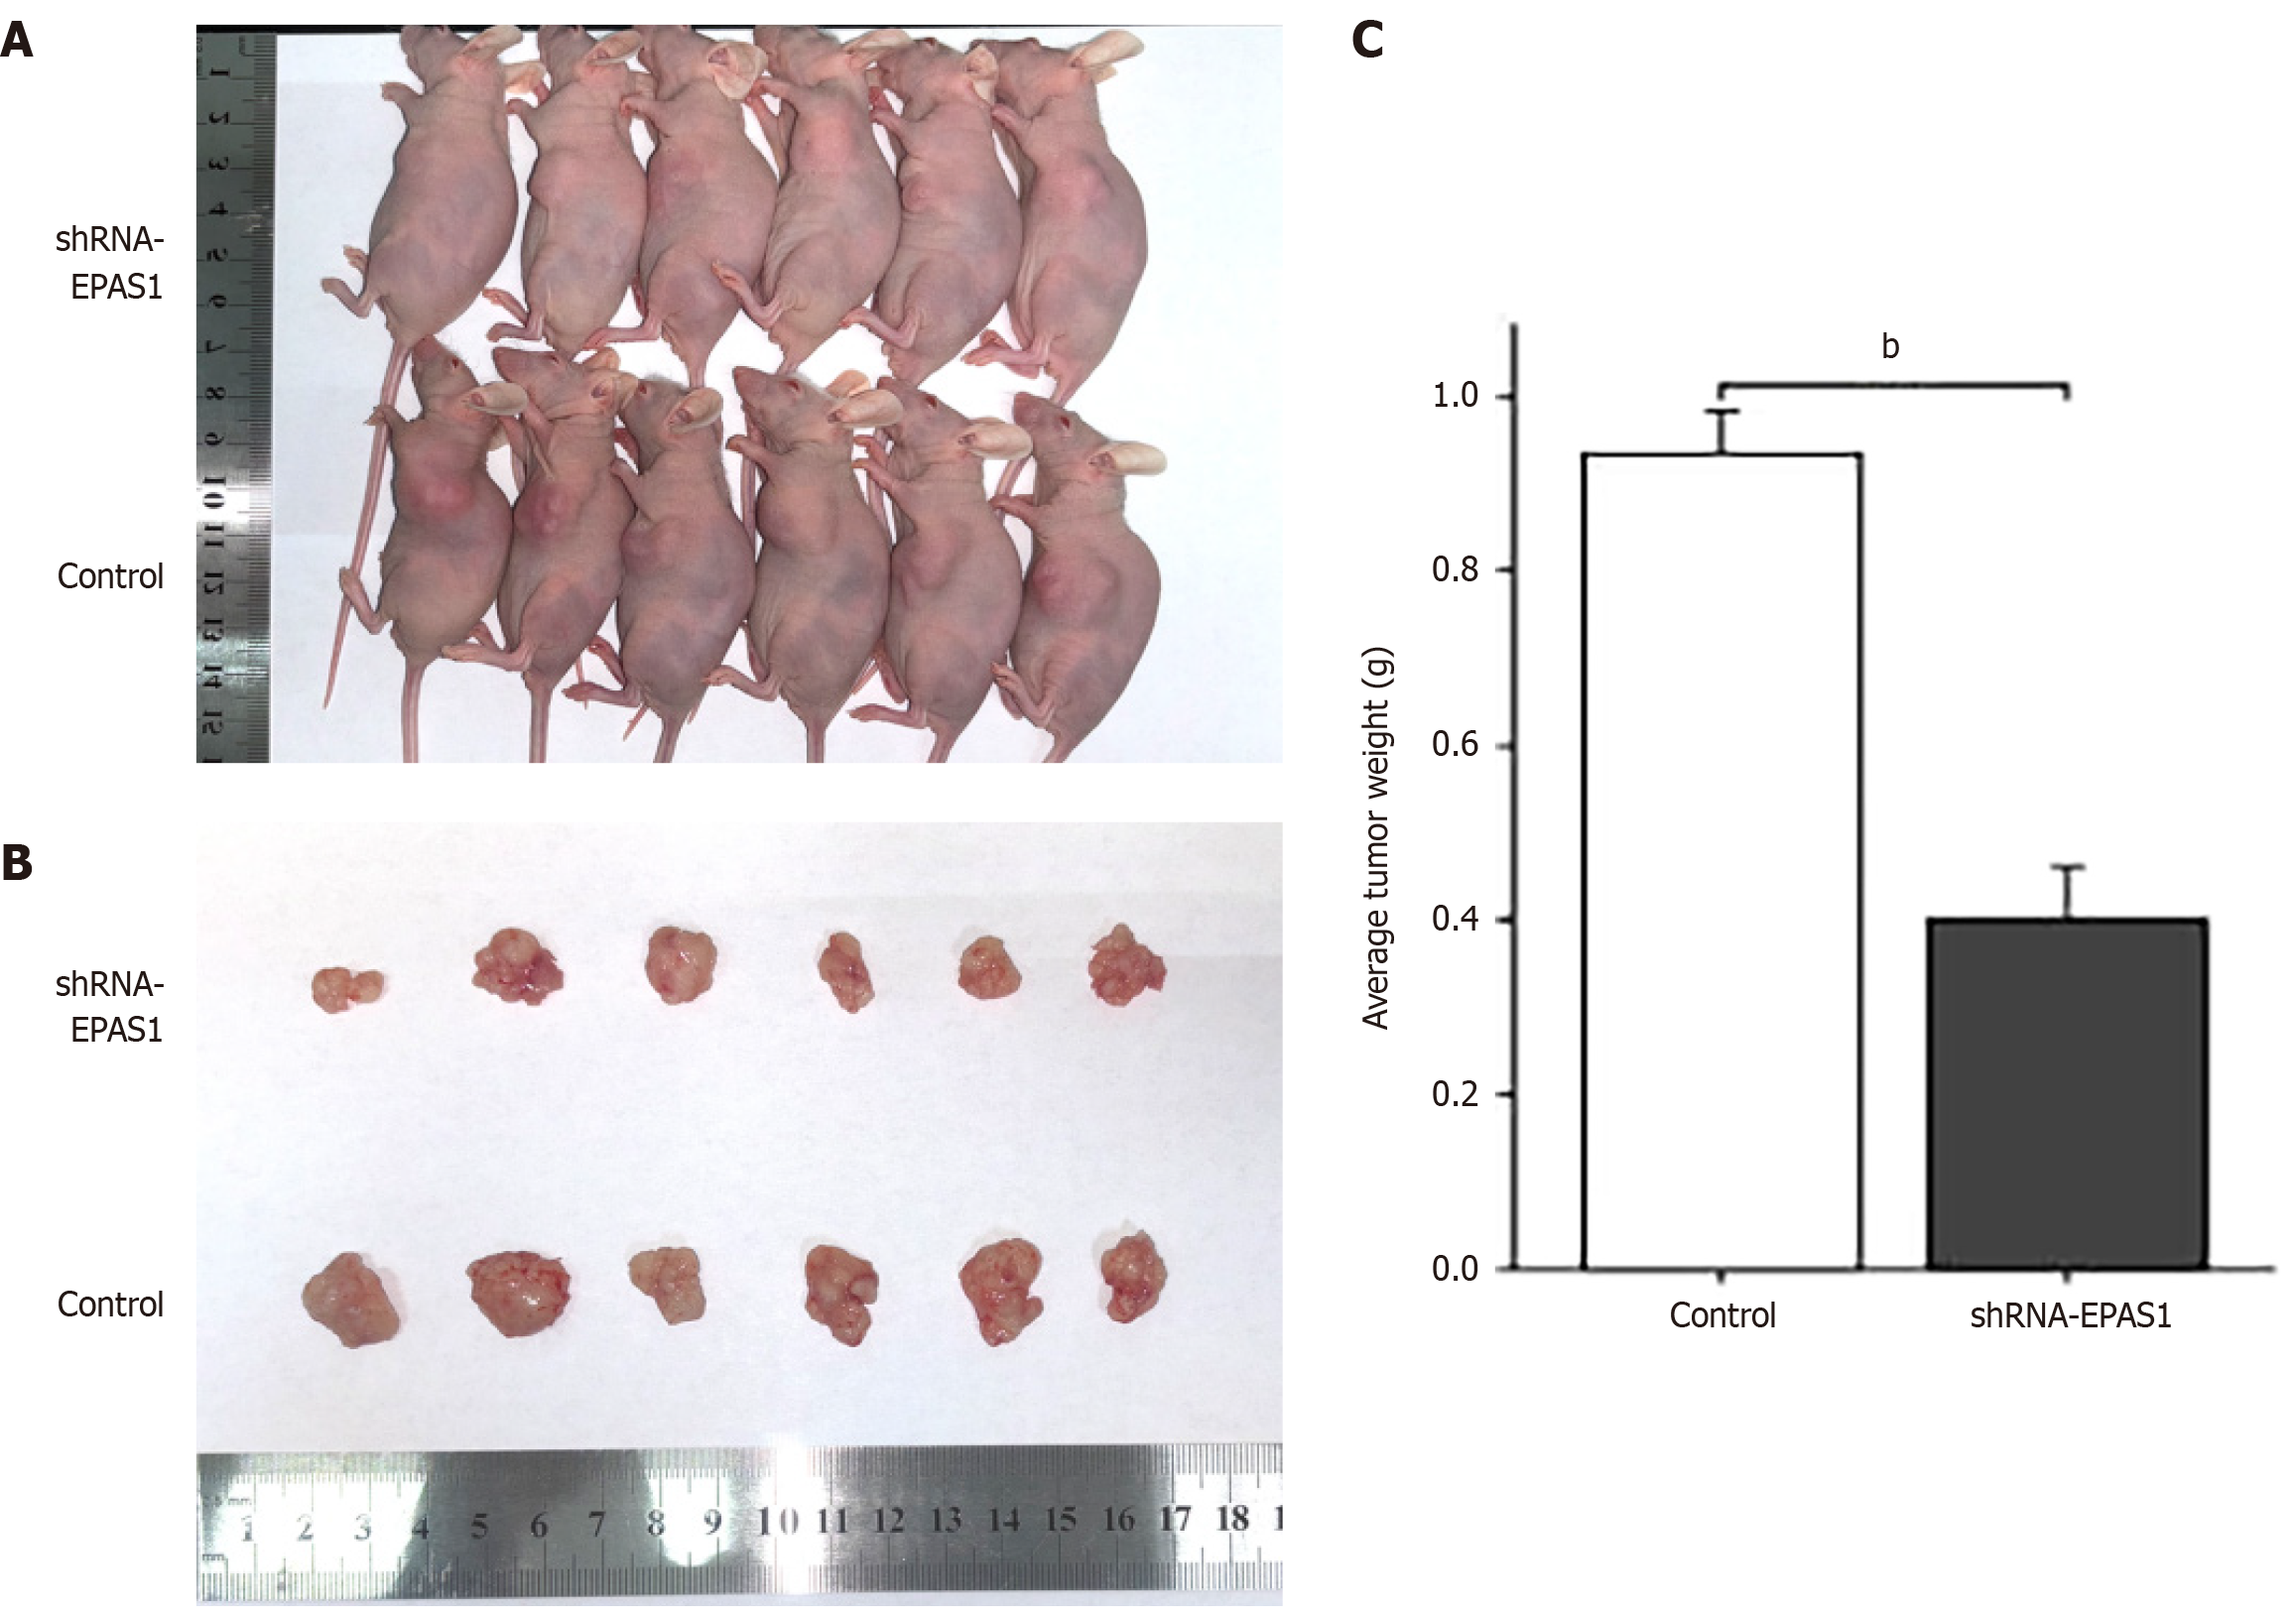
Figure 7 Inhibition of gastric cancer cell function after transfection with shRNA-EPAS1 in vivo.
A: Overall perspective on subcutaneous tumors; B: Tumor body perspective; C: The subcutaneous tumor weight was lighter in the shRNA-EPAS1 group. bP < 0.01.
- Citation: Xu W, Li W, Ru J. Endothelial Per-Arnt-Sim domain-containing protein 1 expression is correlated with poor prognosis and promotes invasion and metastasis in gastric cancer. World J Gastrointest Oncol 2025; 17(6): 105213
- URL: https://www.wjgnet.com/1948-5204/full/v17/i6/105213.htm
- DOI: https://dx.doi.org/10.4251/wjgo.v17.i6.105213


