Copyright
©The Author(s) 2025.
World J Gastrointest Oncol. May 15, 2025; 17(5): 102459
Published online May 15, 2025. doi: 10.4251/wjgo.v17.i5.102459
Published online May 15, 2025. doi: 10.4251/wjgo.v17.i5.102459
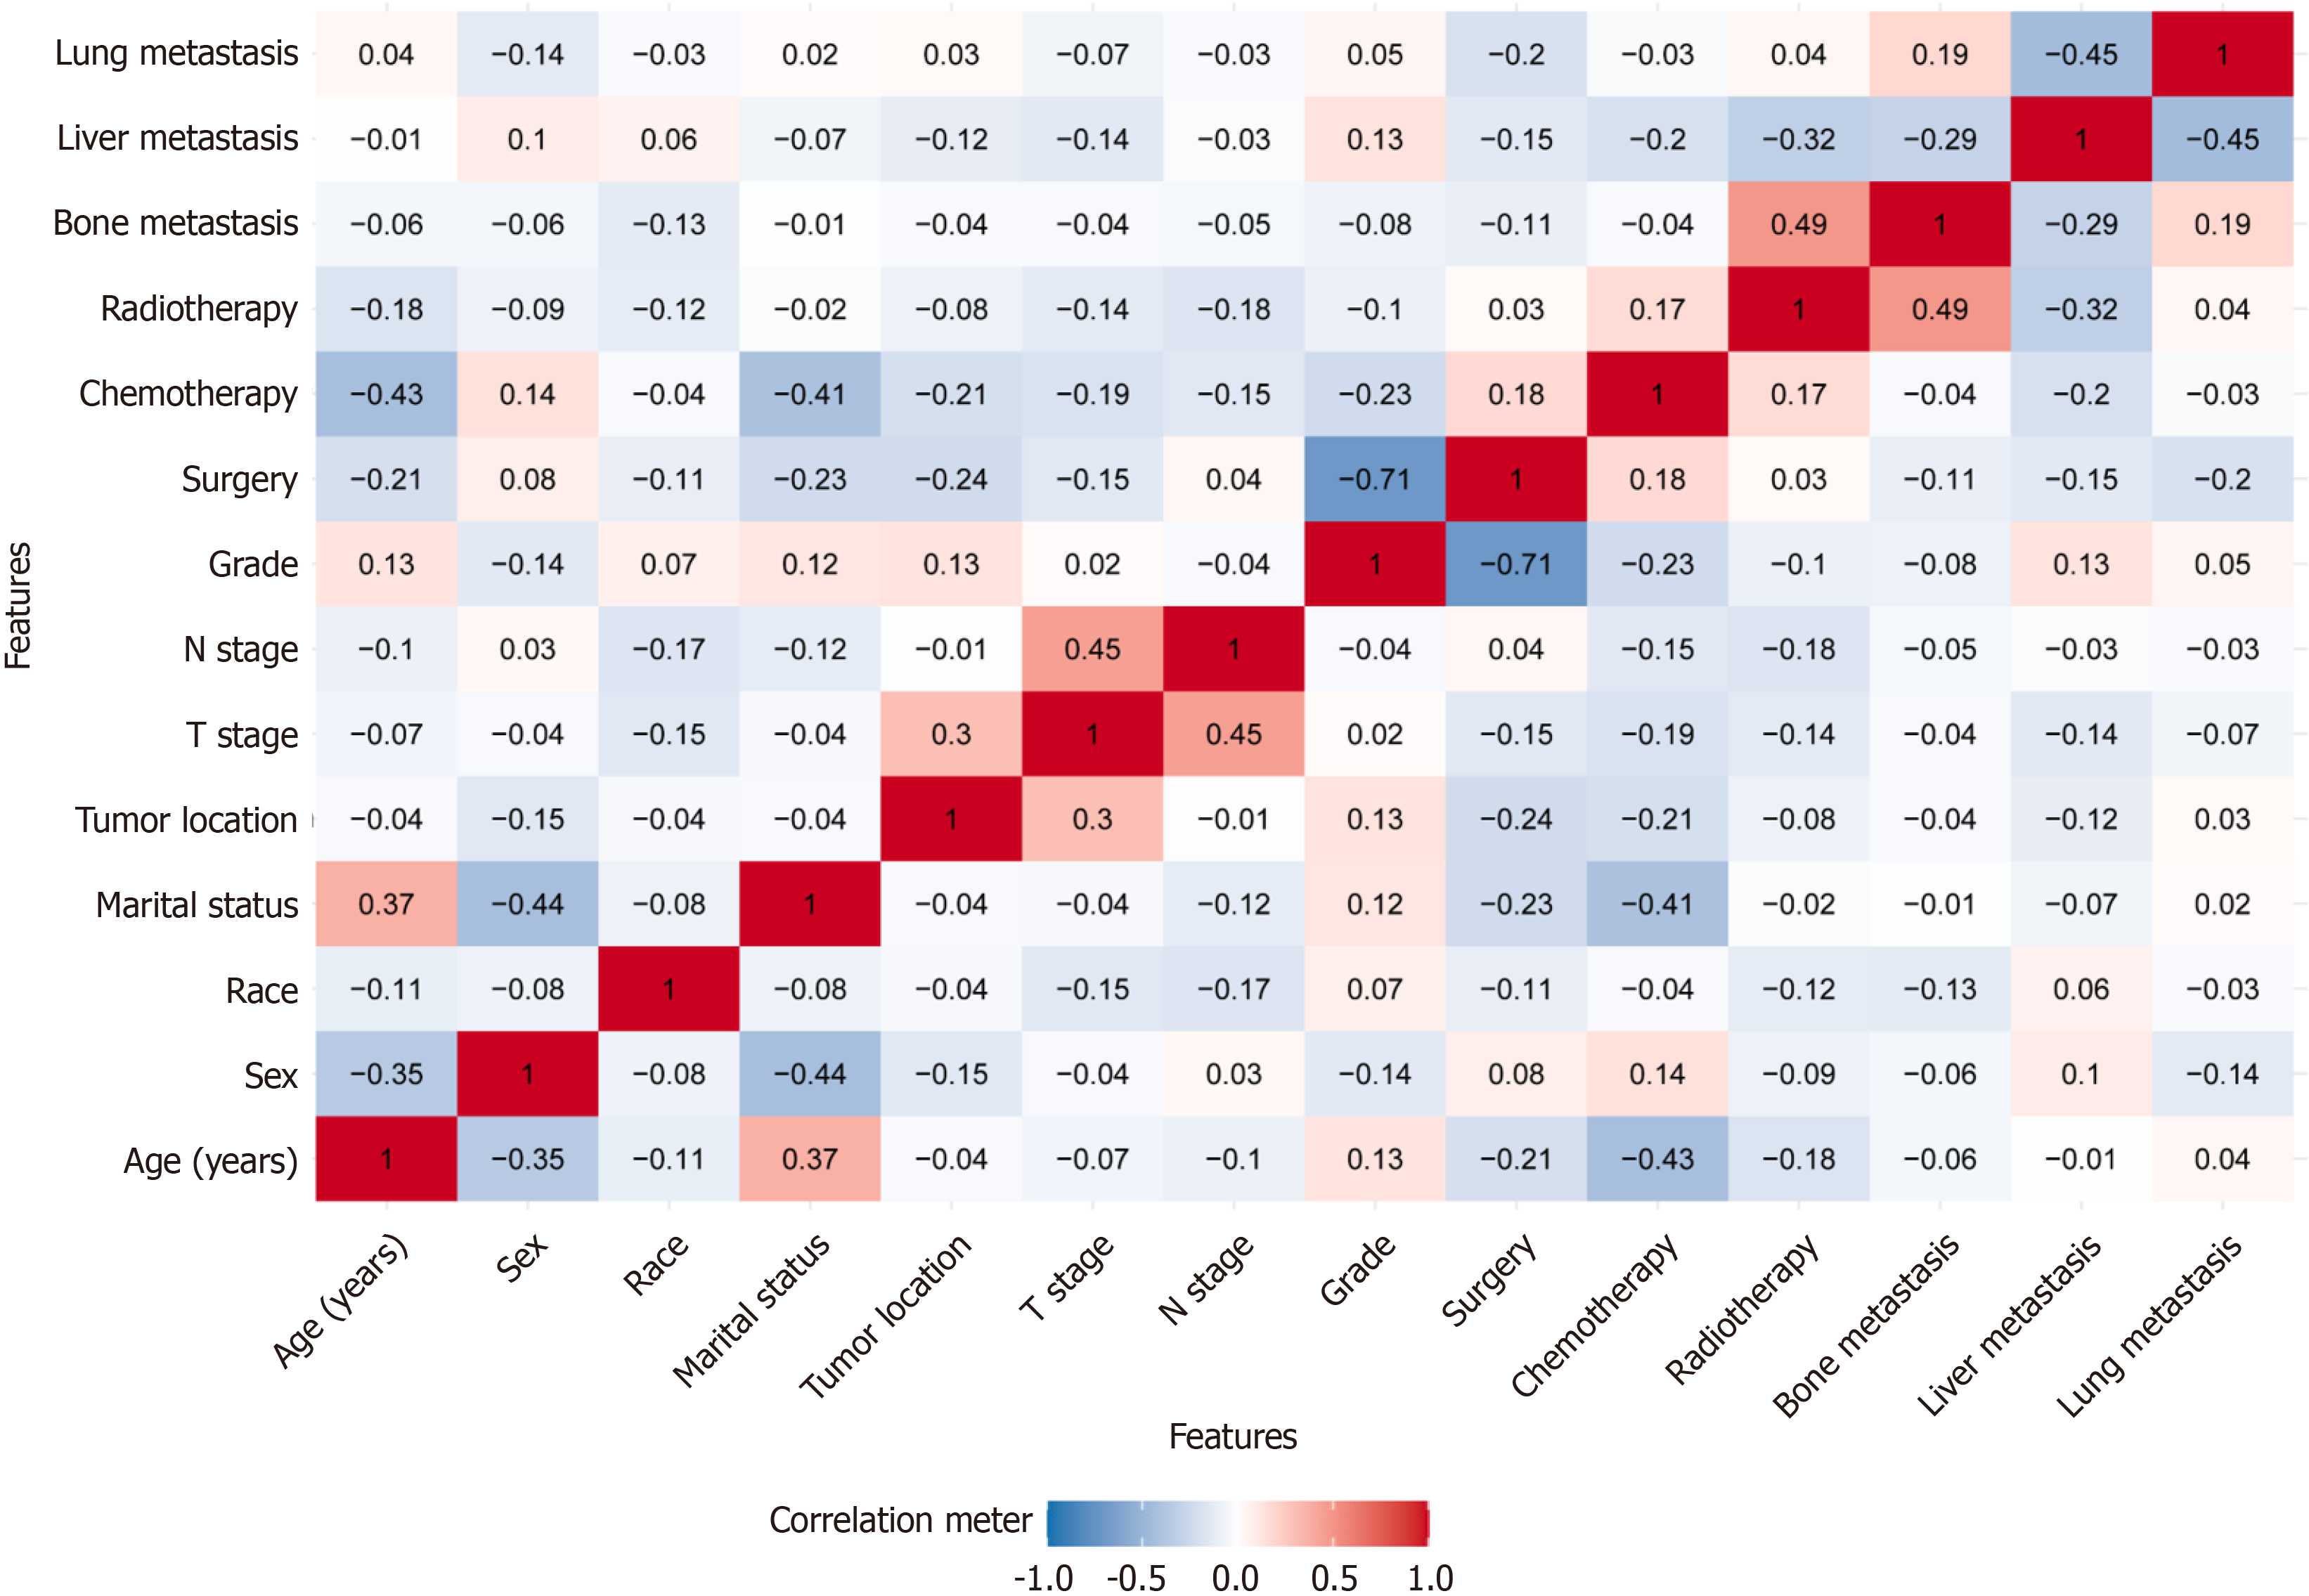
Figure 1 Pearson’s correlation coefficients between variable pairs.
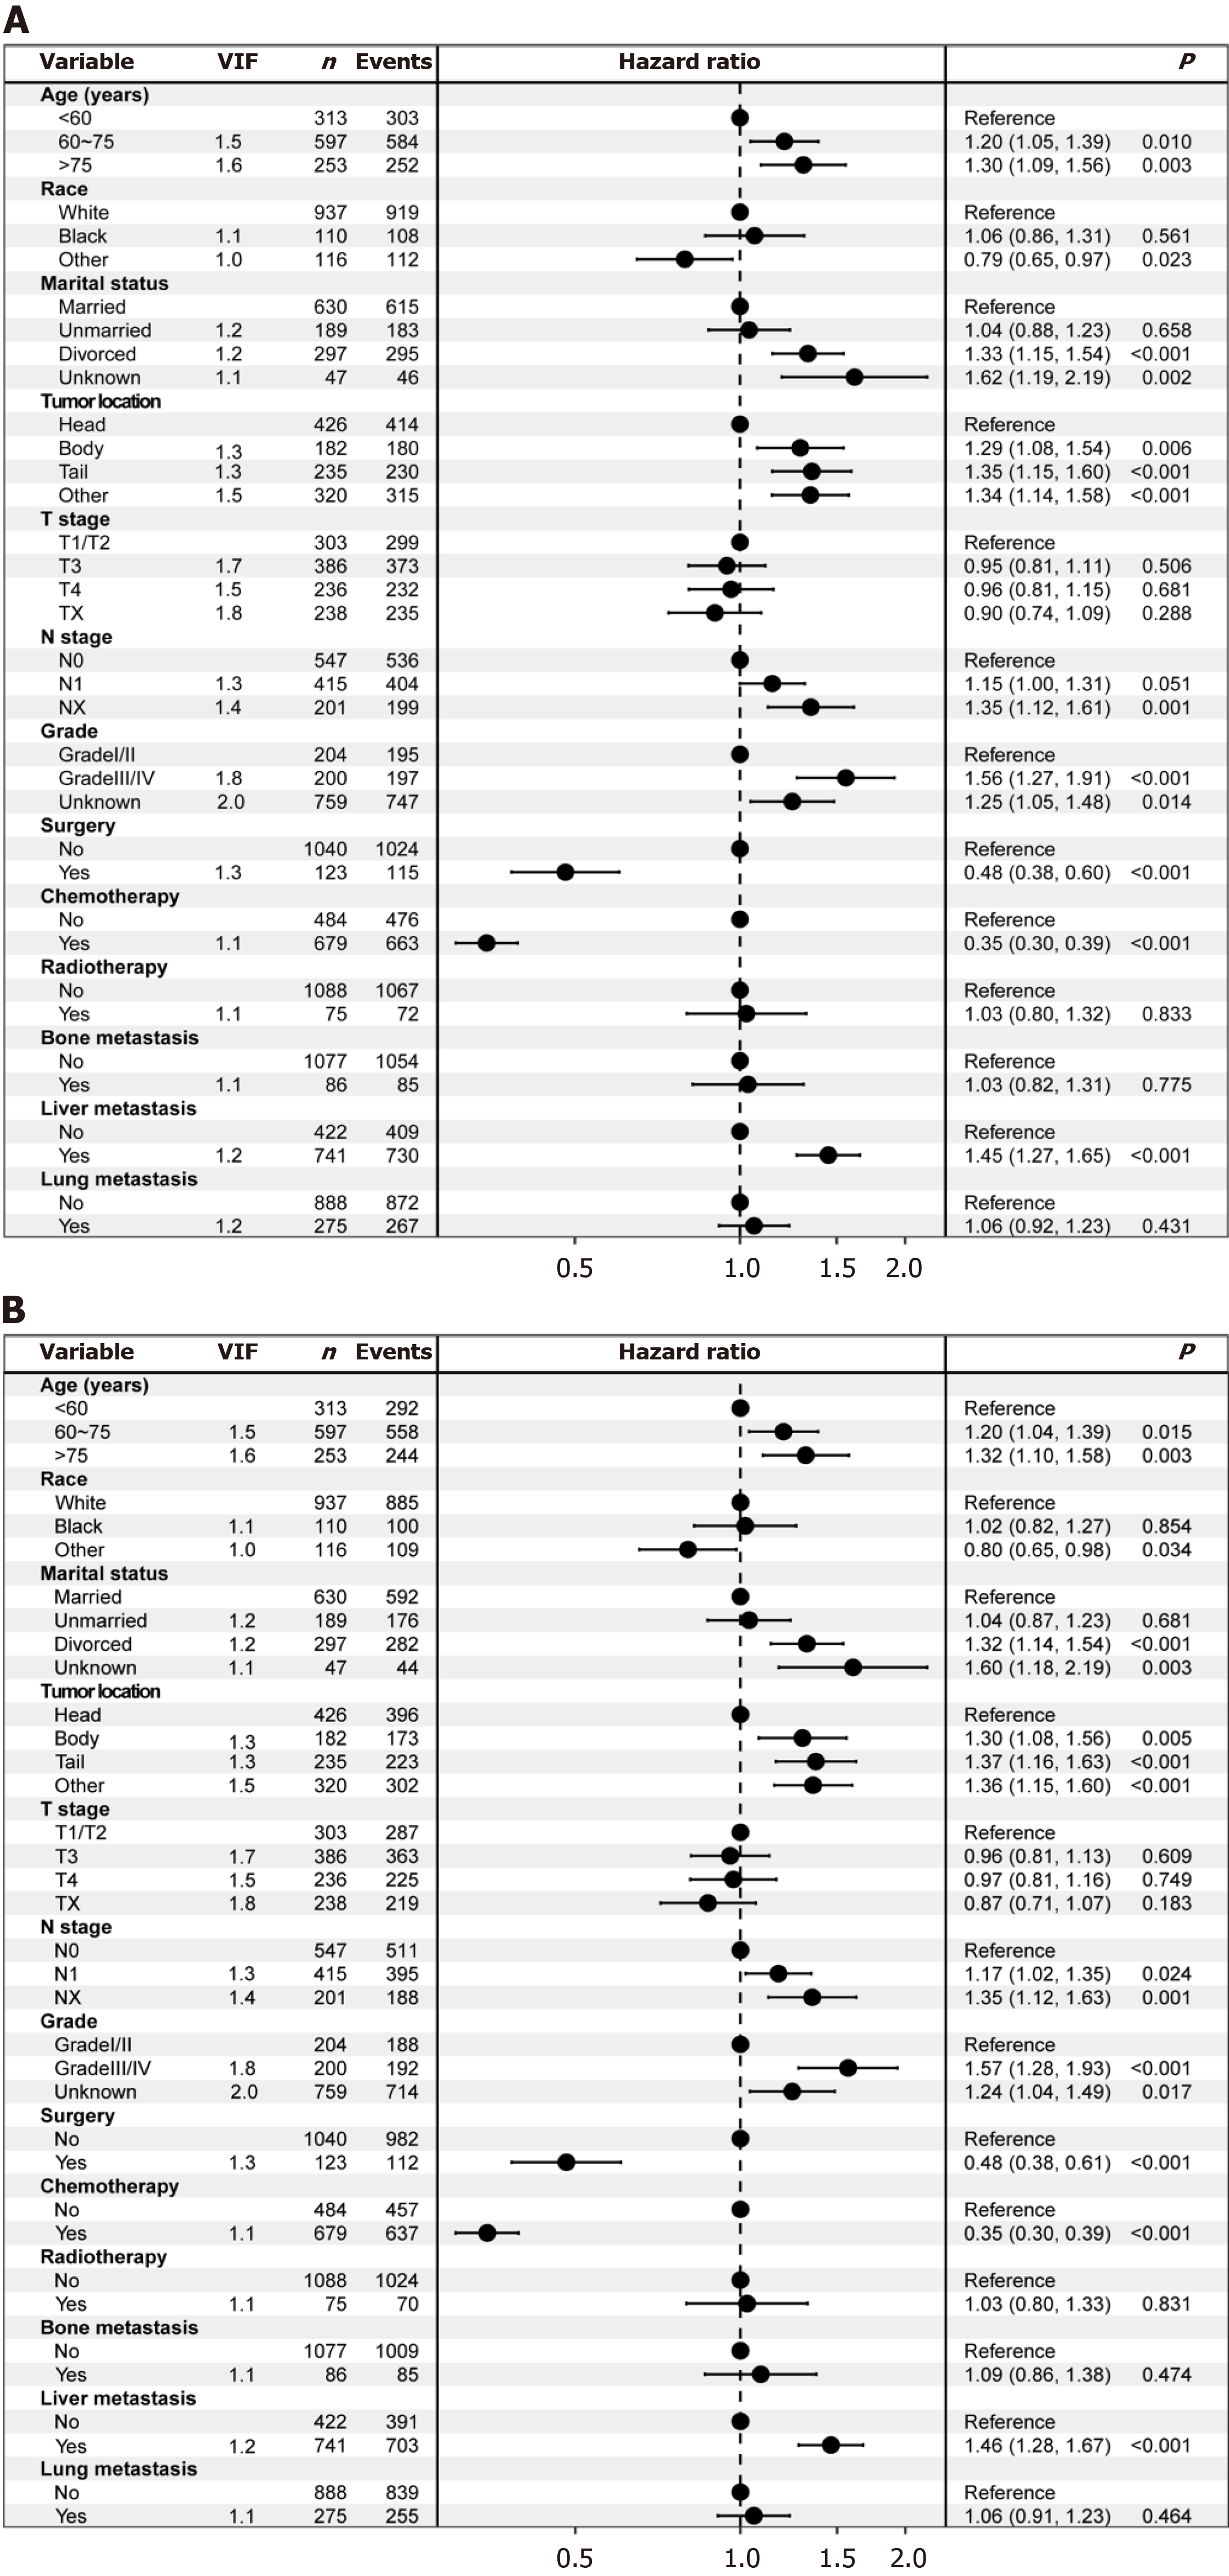
Figure 2 Forest plot for overall survival and cancer-specific survival using multivariate Cox regression analysis in patients.
A: Overall survival; B: Cancer-specific survival.
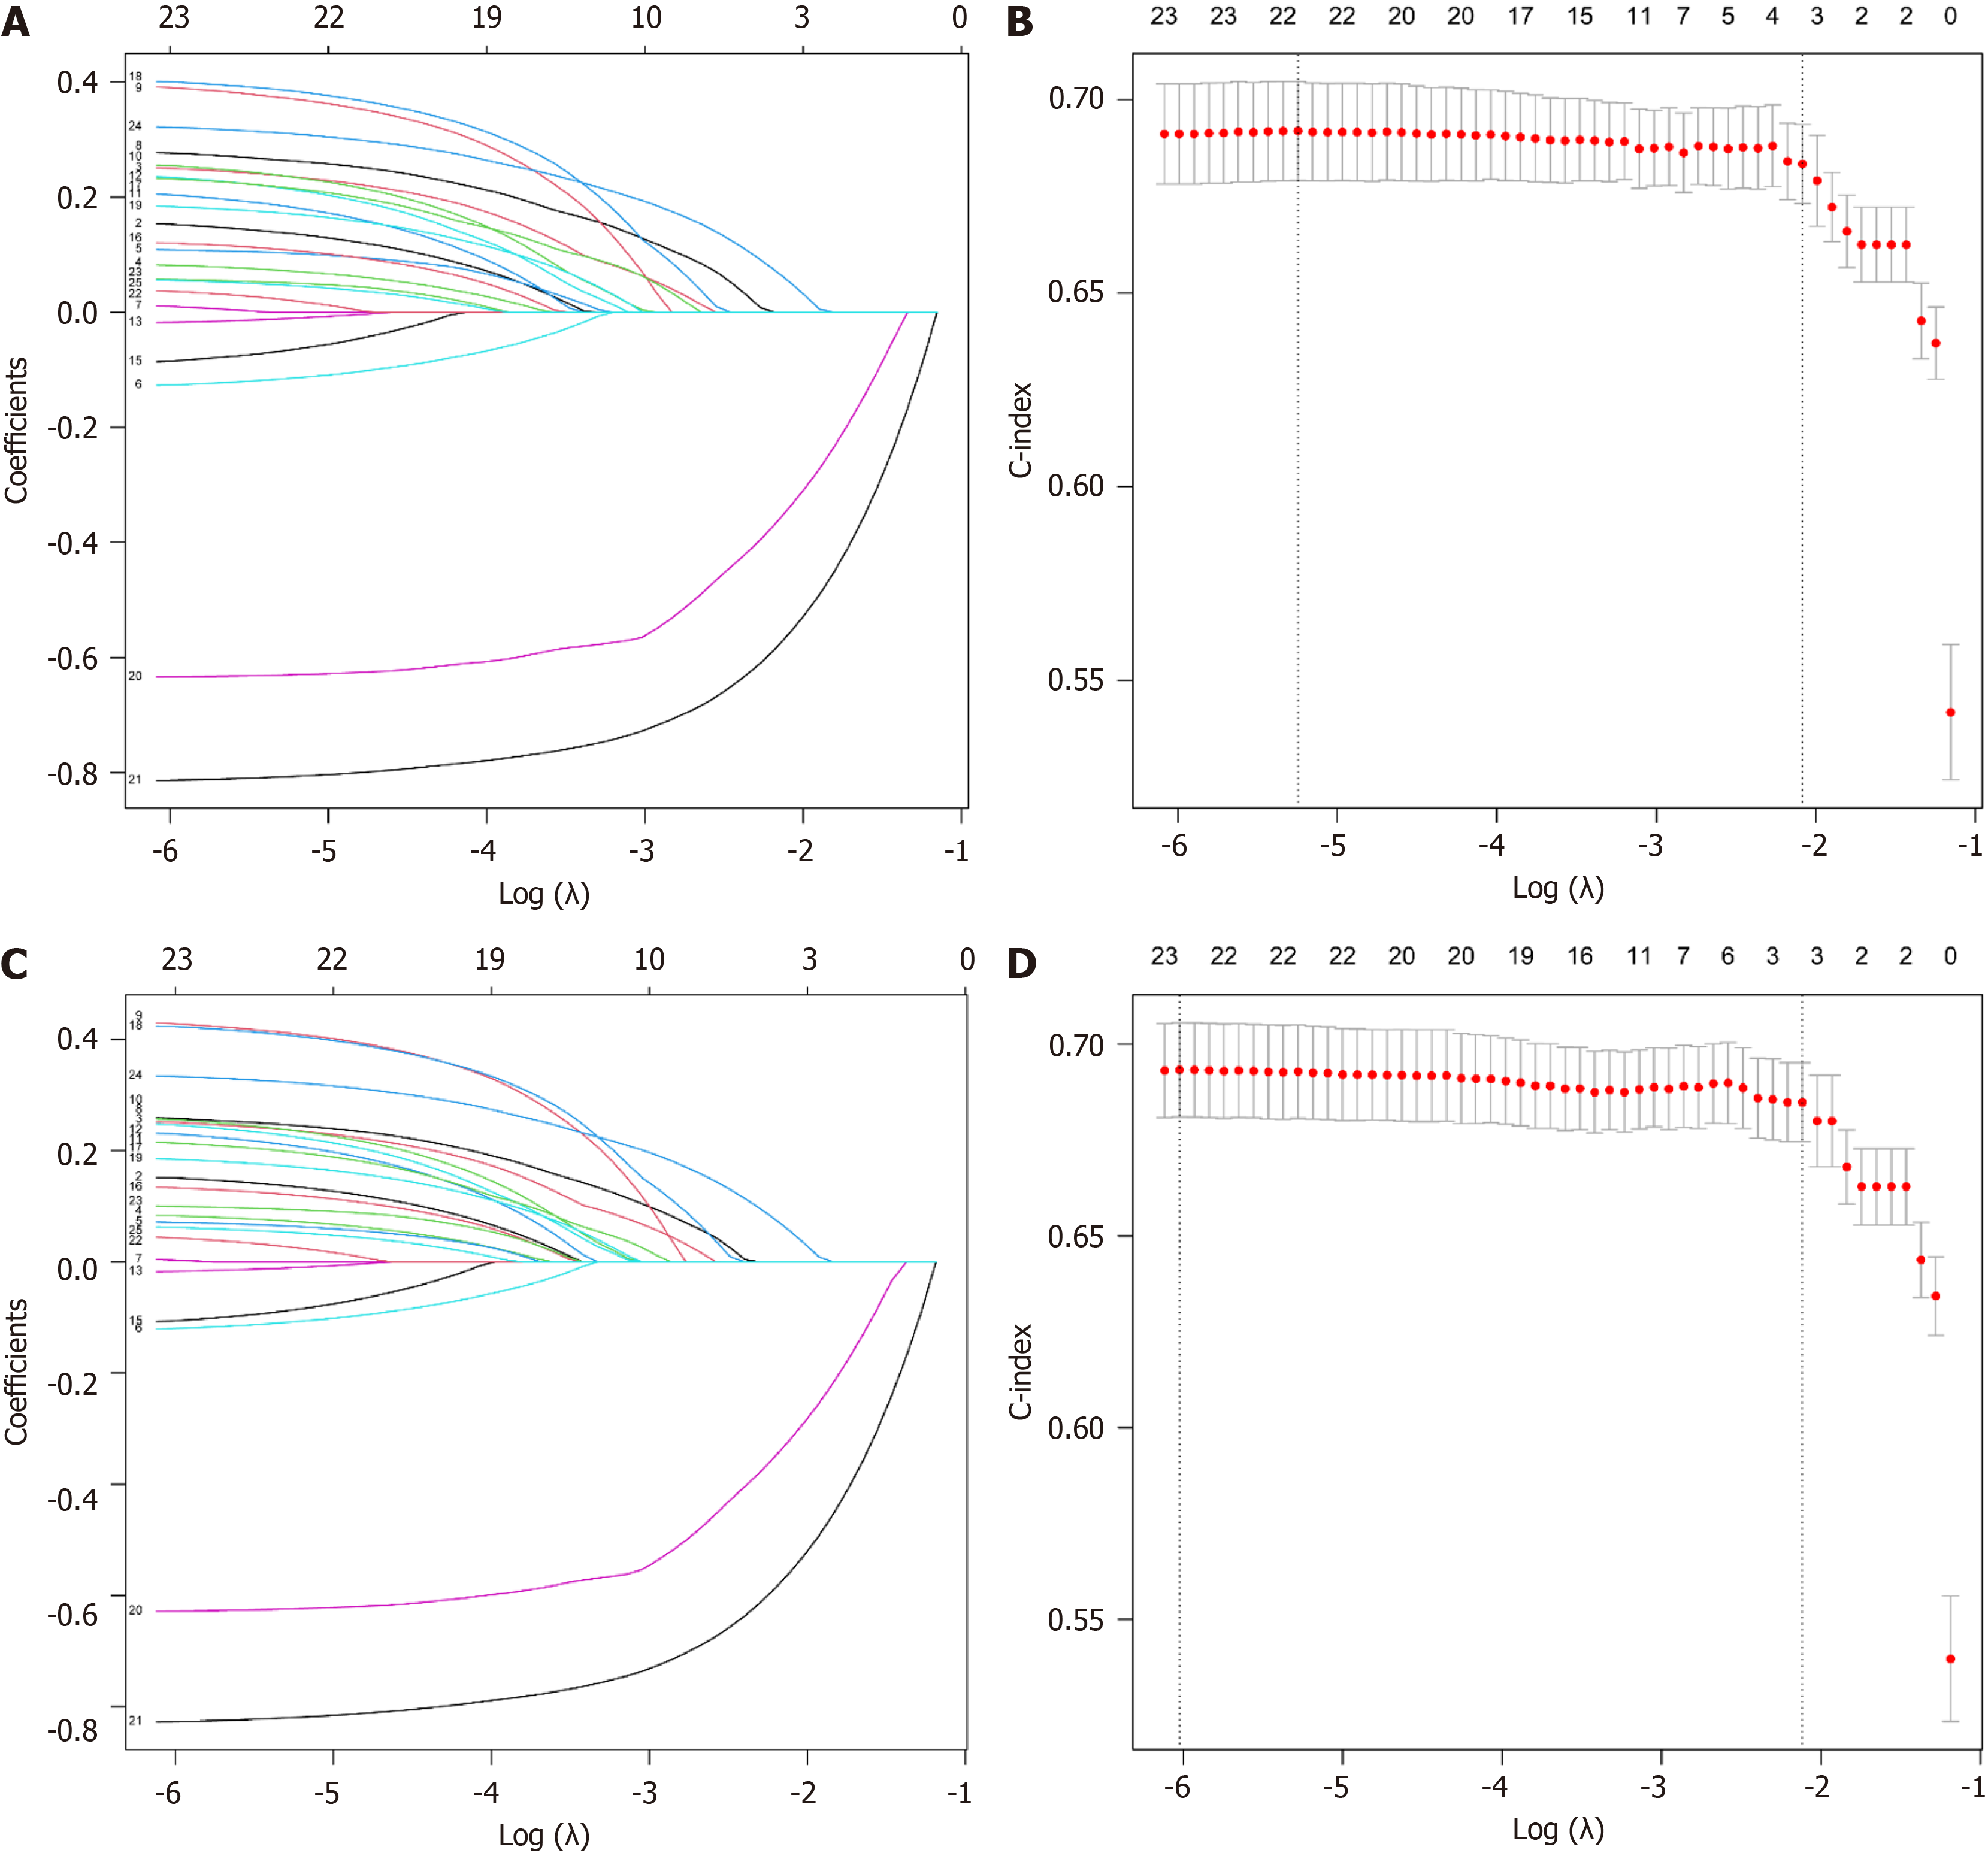
Figure 3 Feature selection based on Least Absolute Shrinkage and Selection Operator regression.
A: Curve of Least Absolute Shrinkage and Selection Operator (LASSO) regression coefficients with changing Log (λ) for overall survival (OS); B: Curve of 10-fold cross-validated C-index with changing Log (λ) for OS; C: Curve of LASSO regression coefficients with changing Log (λ) for cancer-specific survival (CSS); D: Curve of 10-fold cross-validated C-index with changing Log (λ) for CSS.
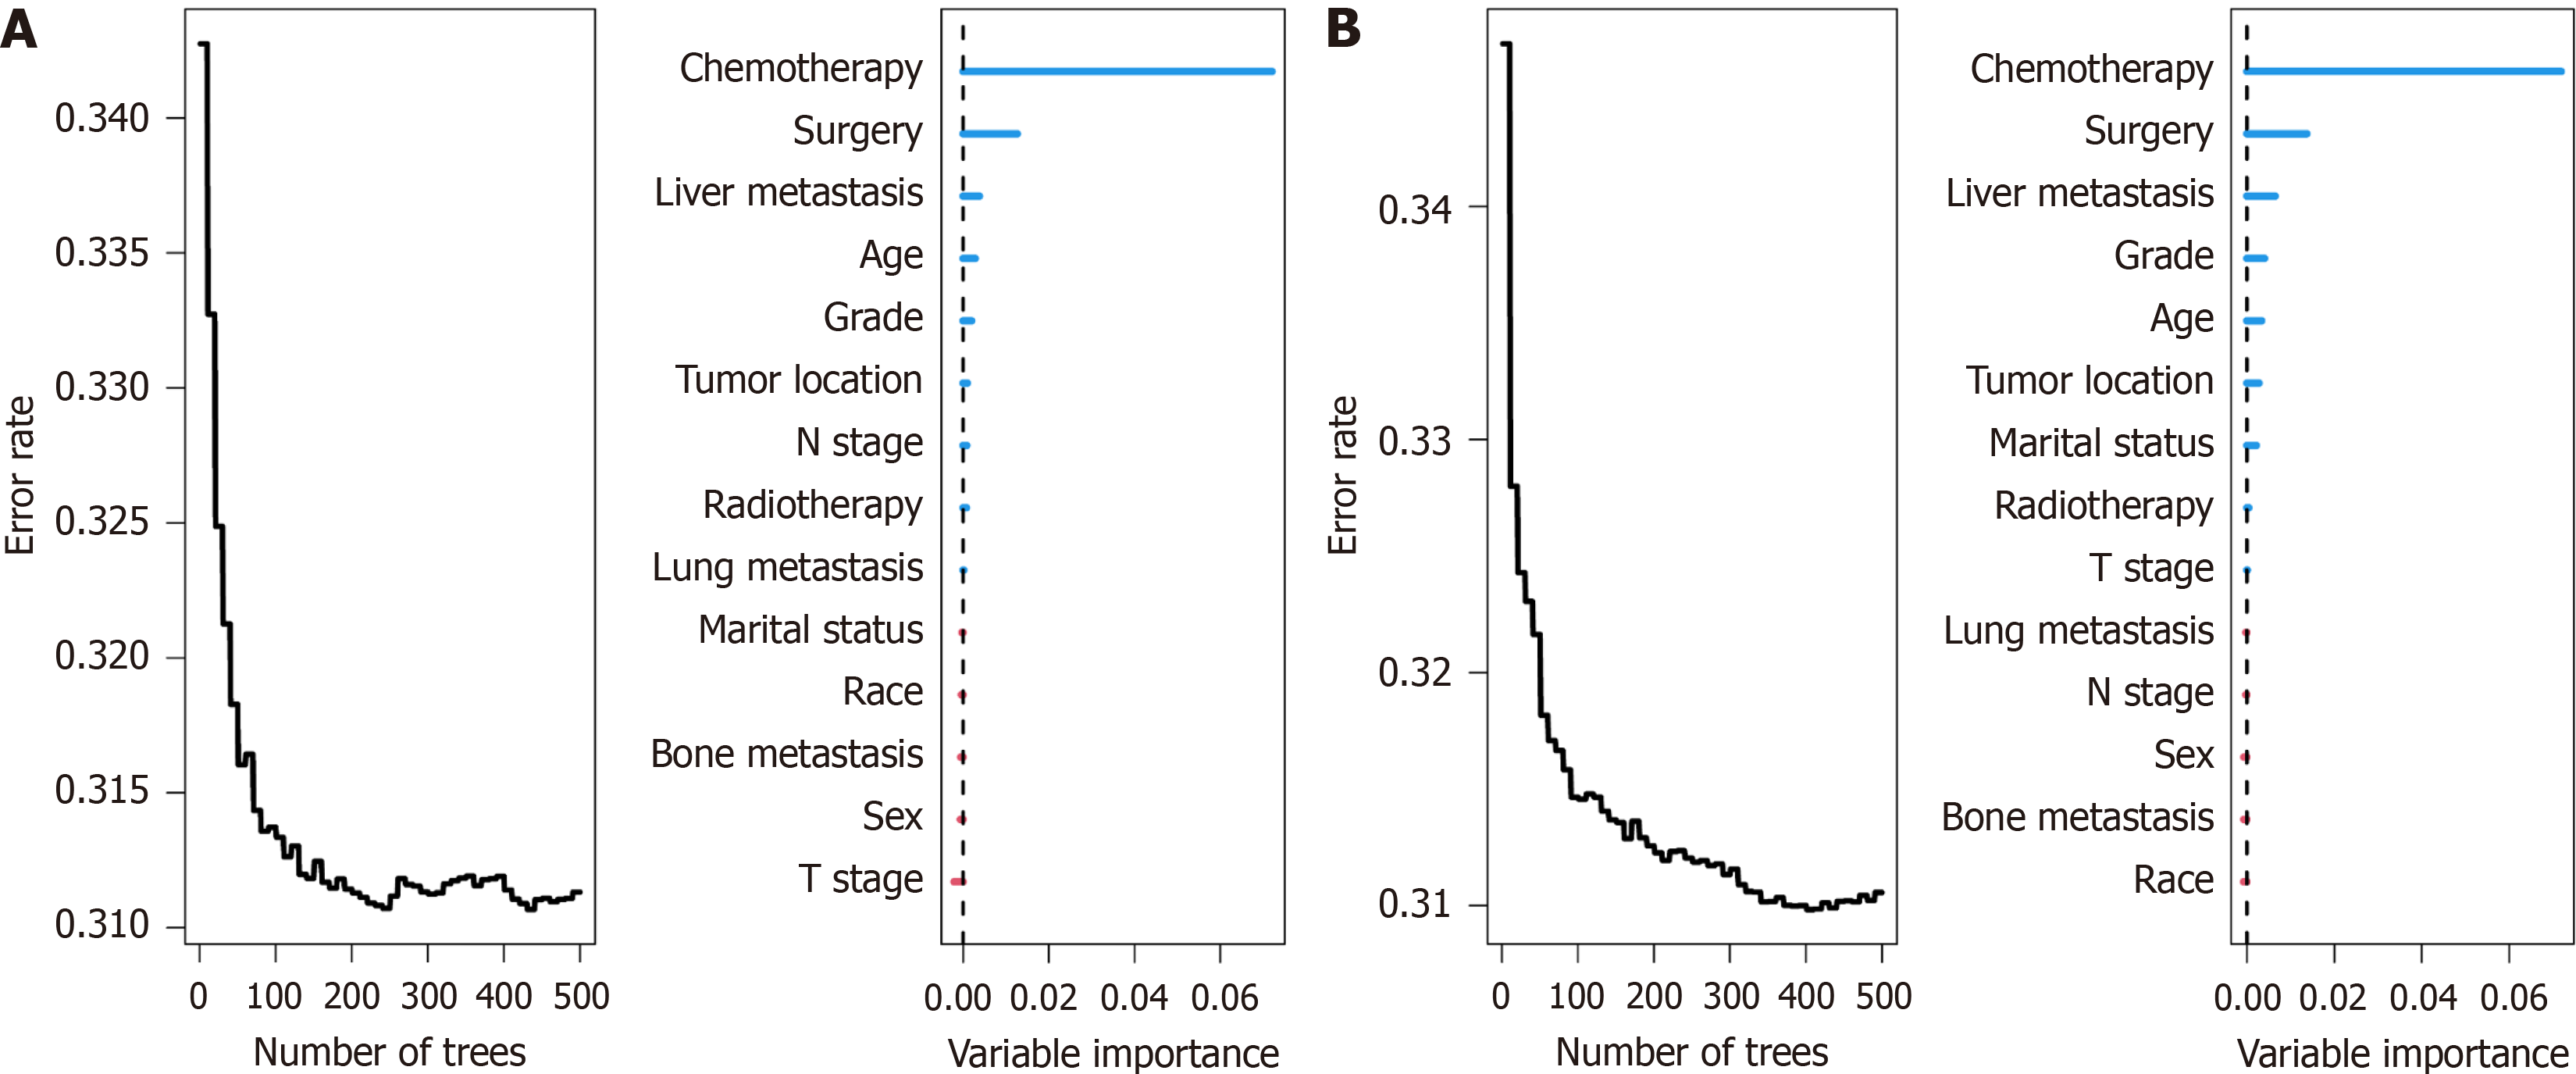
Figure 4 Importance scores based on Random Survival Forest for overall survival and cancer-specific survival.
A: Overall survival; B: Cancer-specific survival.
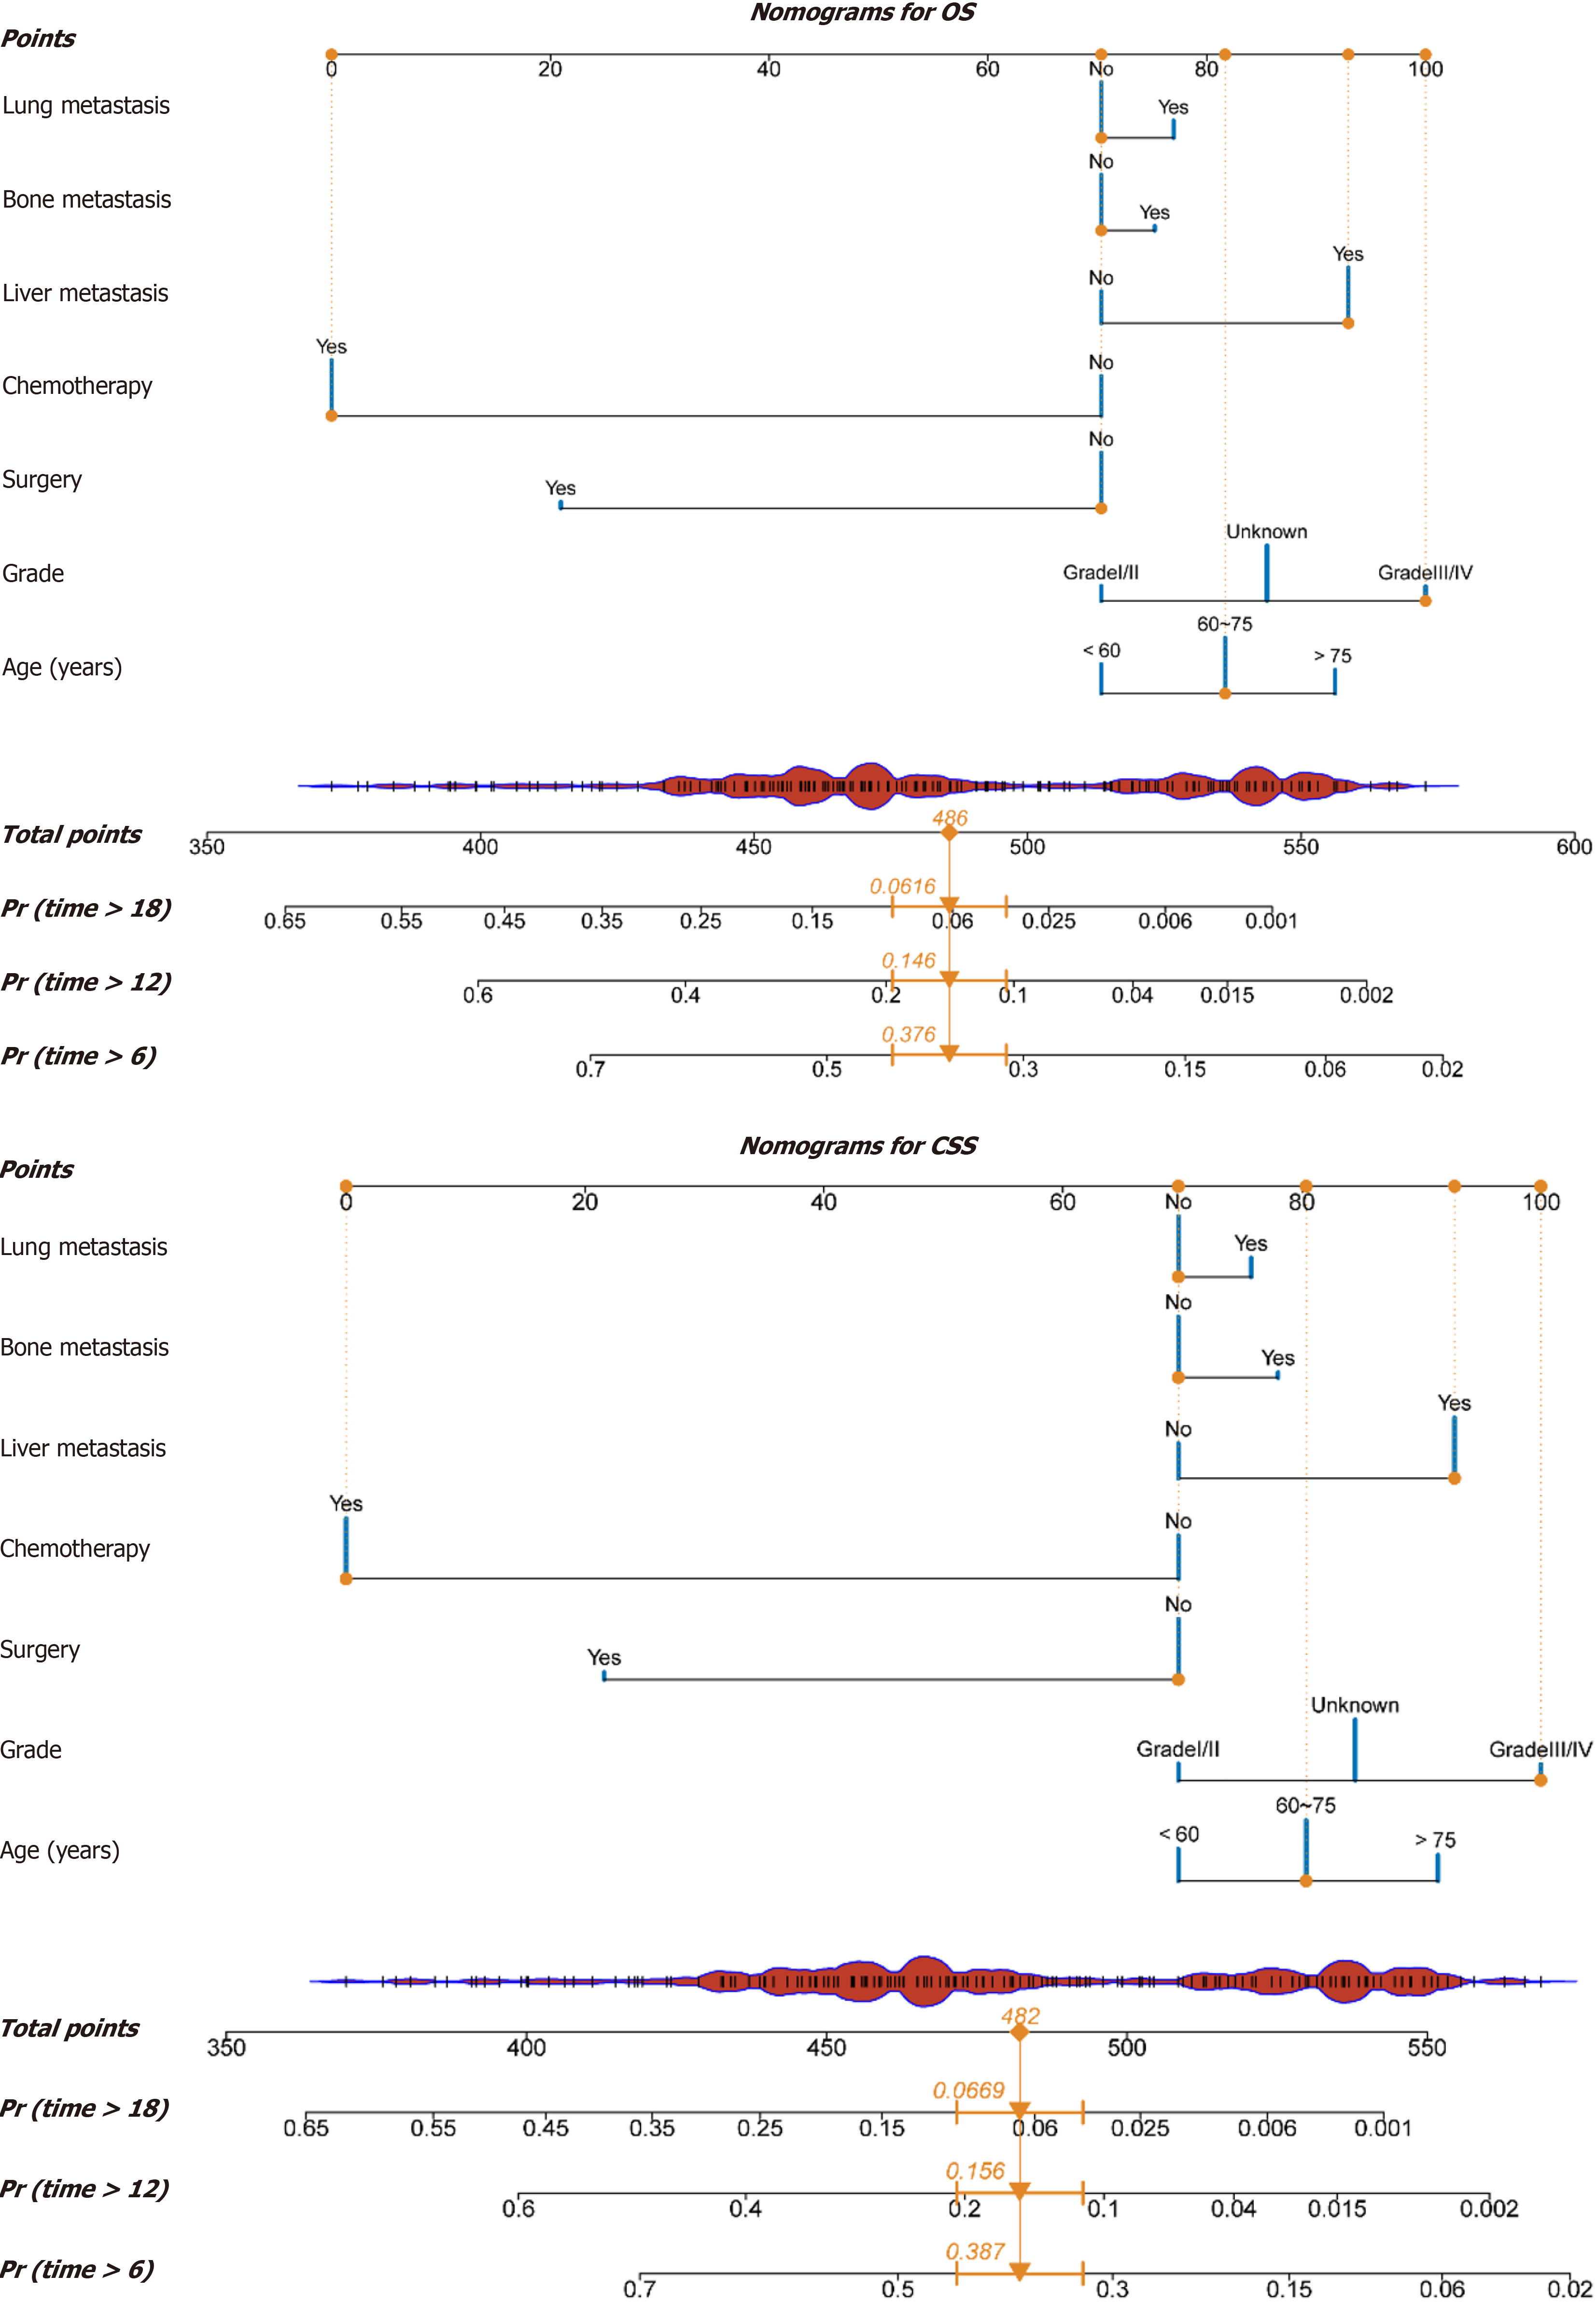
Figure 5 Nomogram predicting overall survival and cancer-specific survival for stage IV pancreatic cancer at 6, 12, and 18 months.
OS: Overall survival; CSS: Cancer-specific survival.
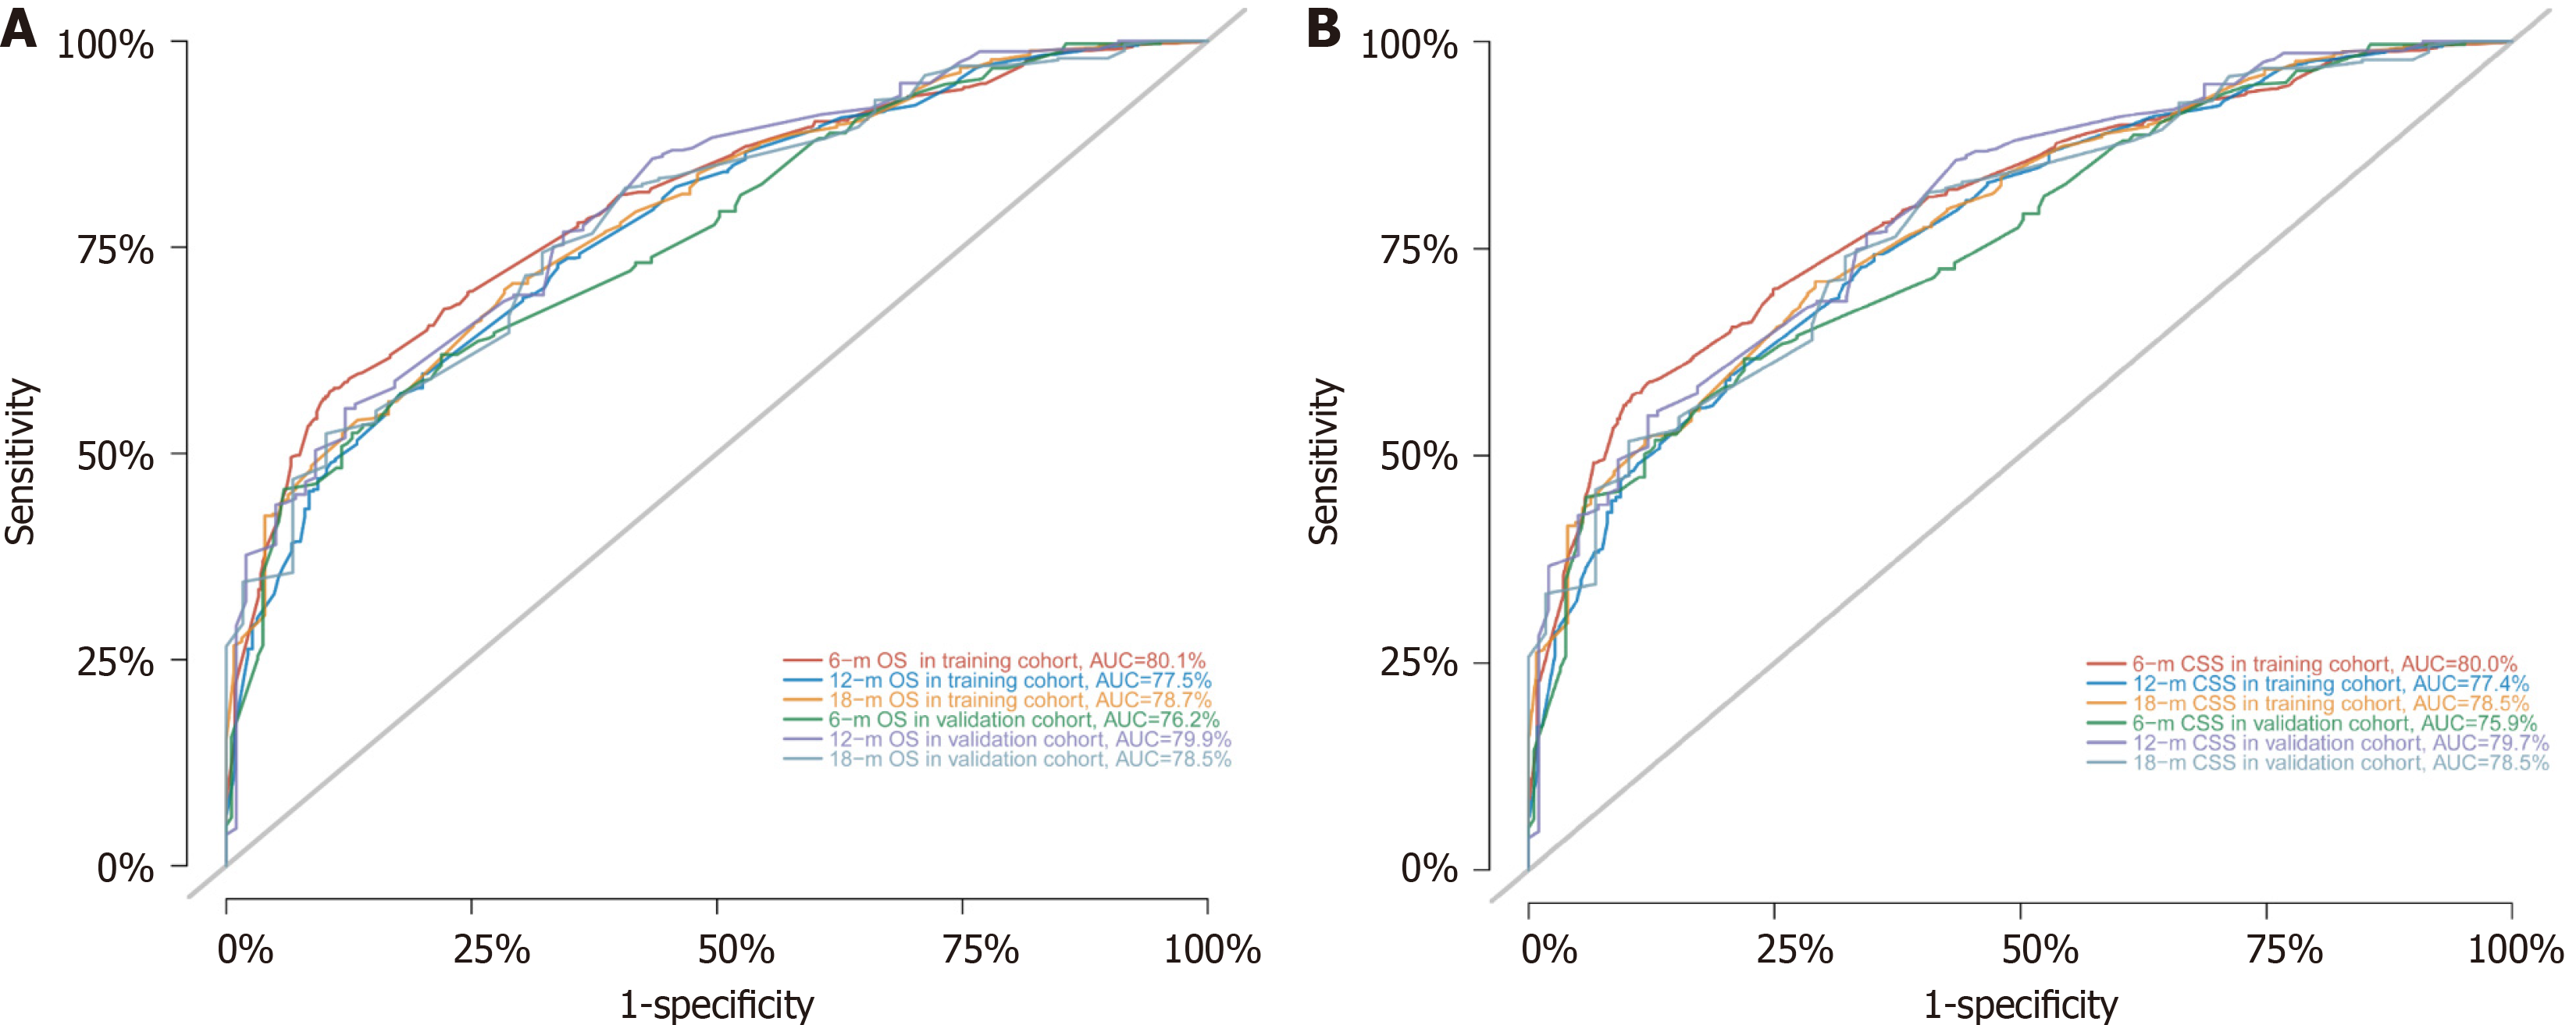
Figure 6 Receiver operating characteristic curves for 6-, 12-, and 18-month overall survival and cancer-specific survival in the training cohort and validation cohort.
A: Overall survival; B: Cancer-specific survival. OS: Overall survival; CSS: Cancer-specific survival; AUC: Area under the curve.
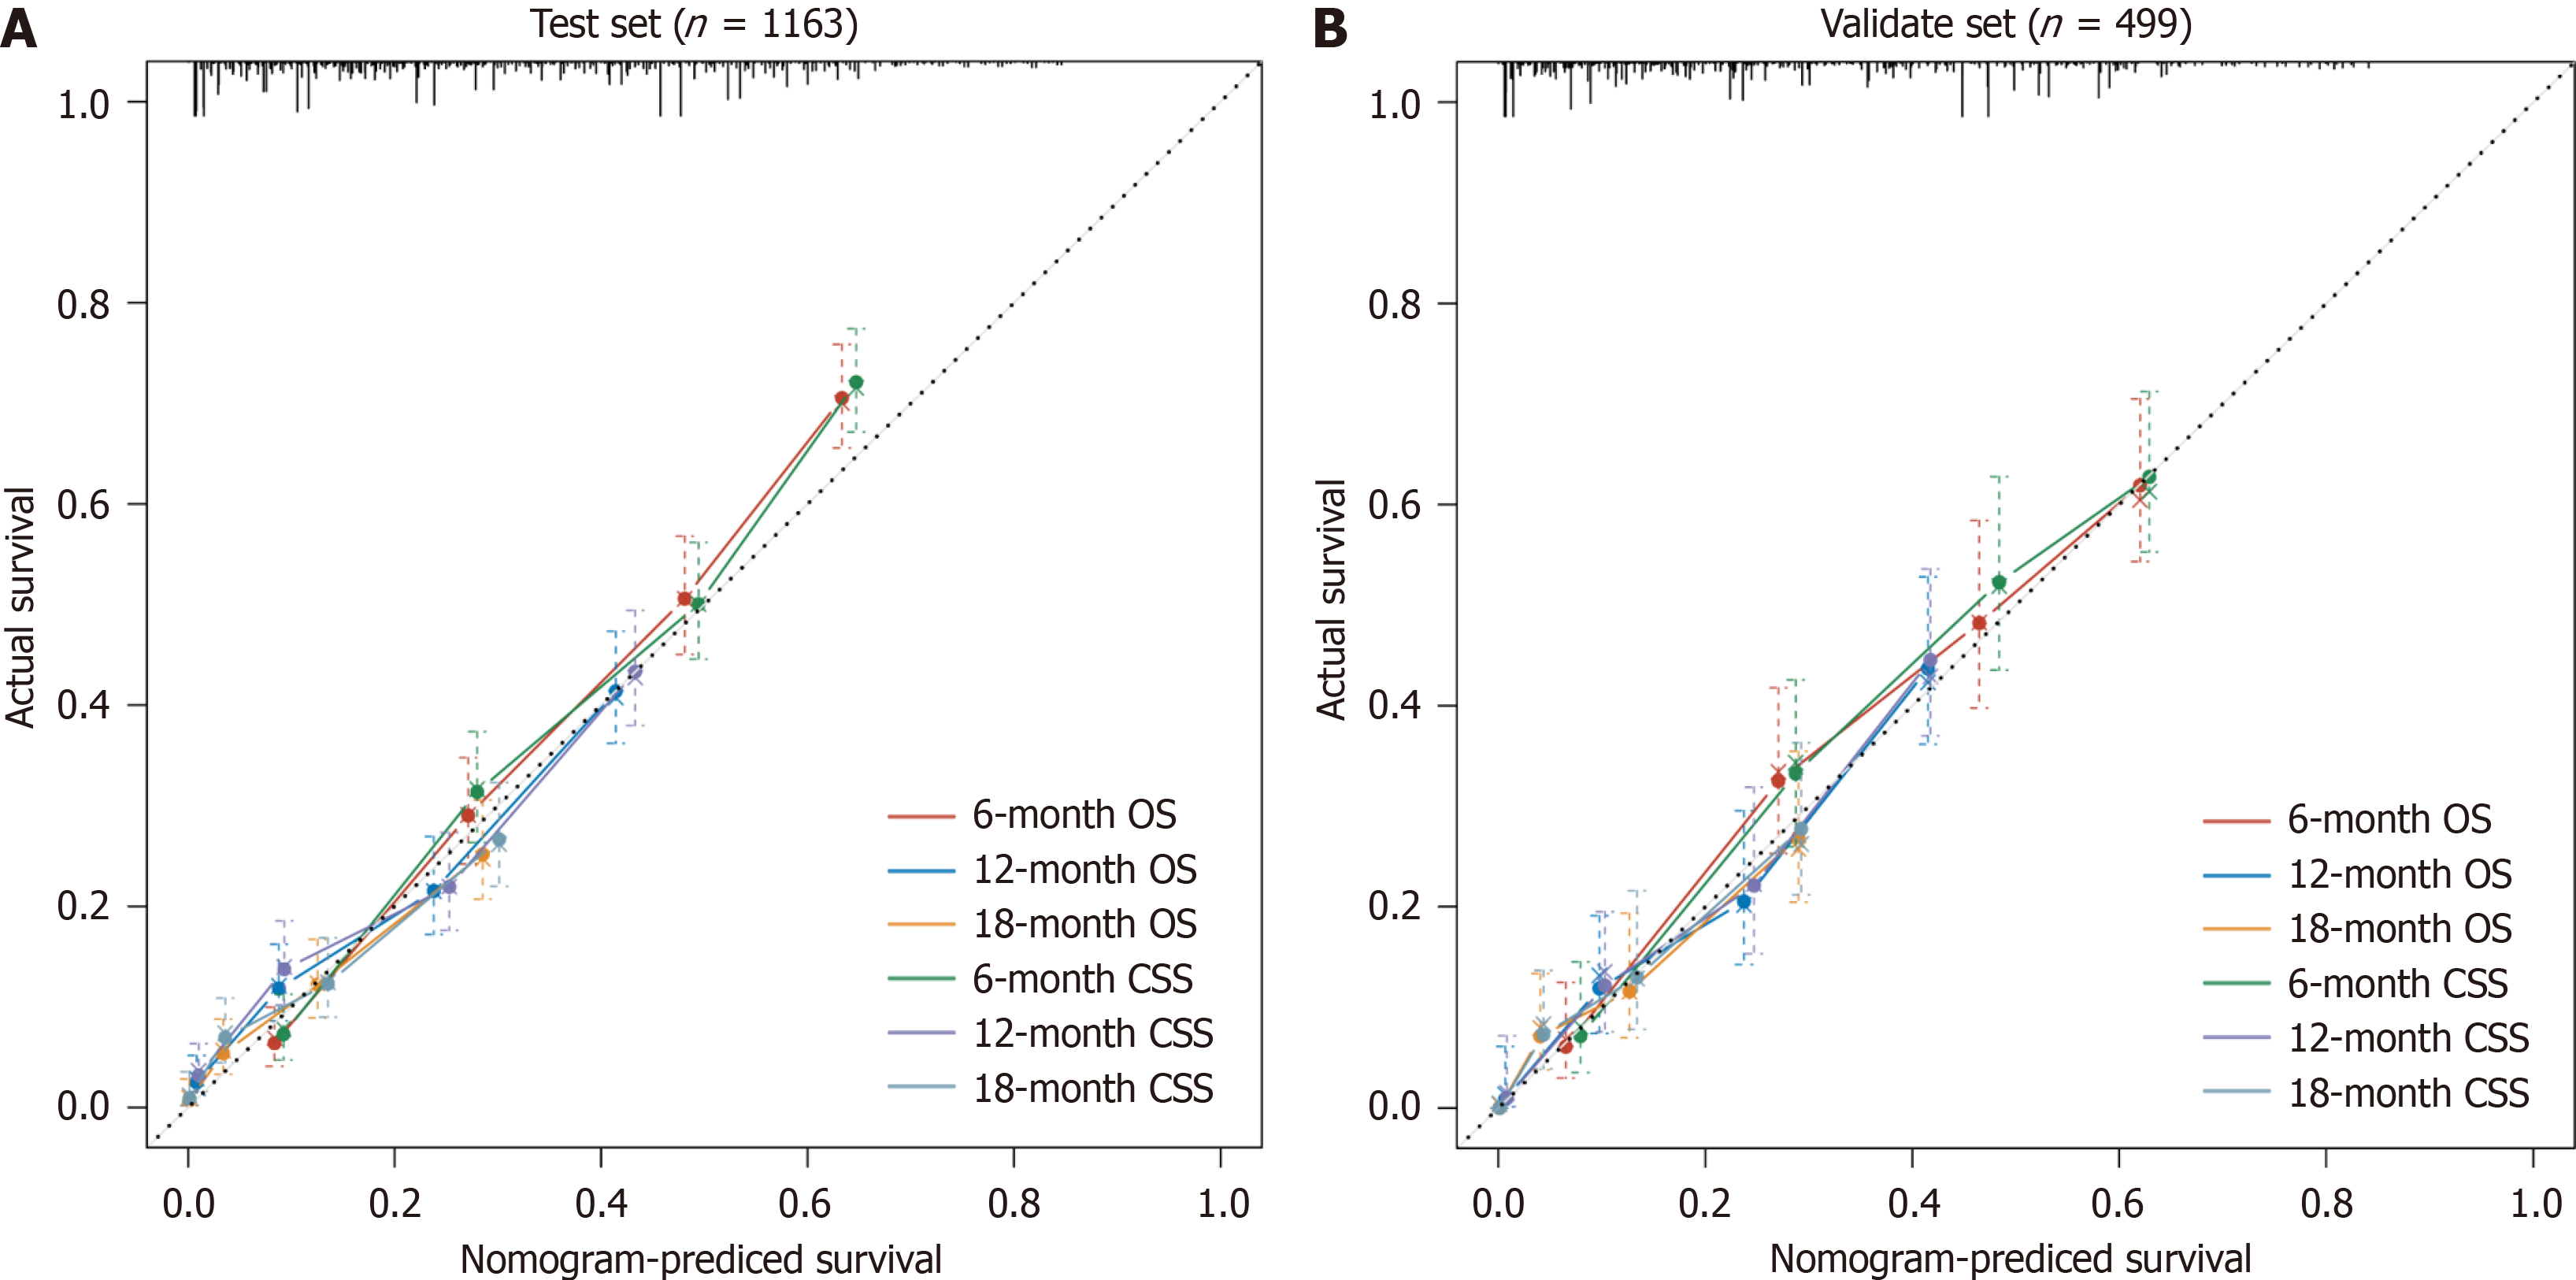
Figure 7 Calibration curves for 6-, 12-, and 18-month overall survival and cancer-specific survival in the training cohort and validation cohort.
A: The training cohort; B: Validation cohort. OS: Overall survival; CSS: Cancer-specific survival.
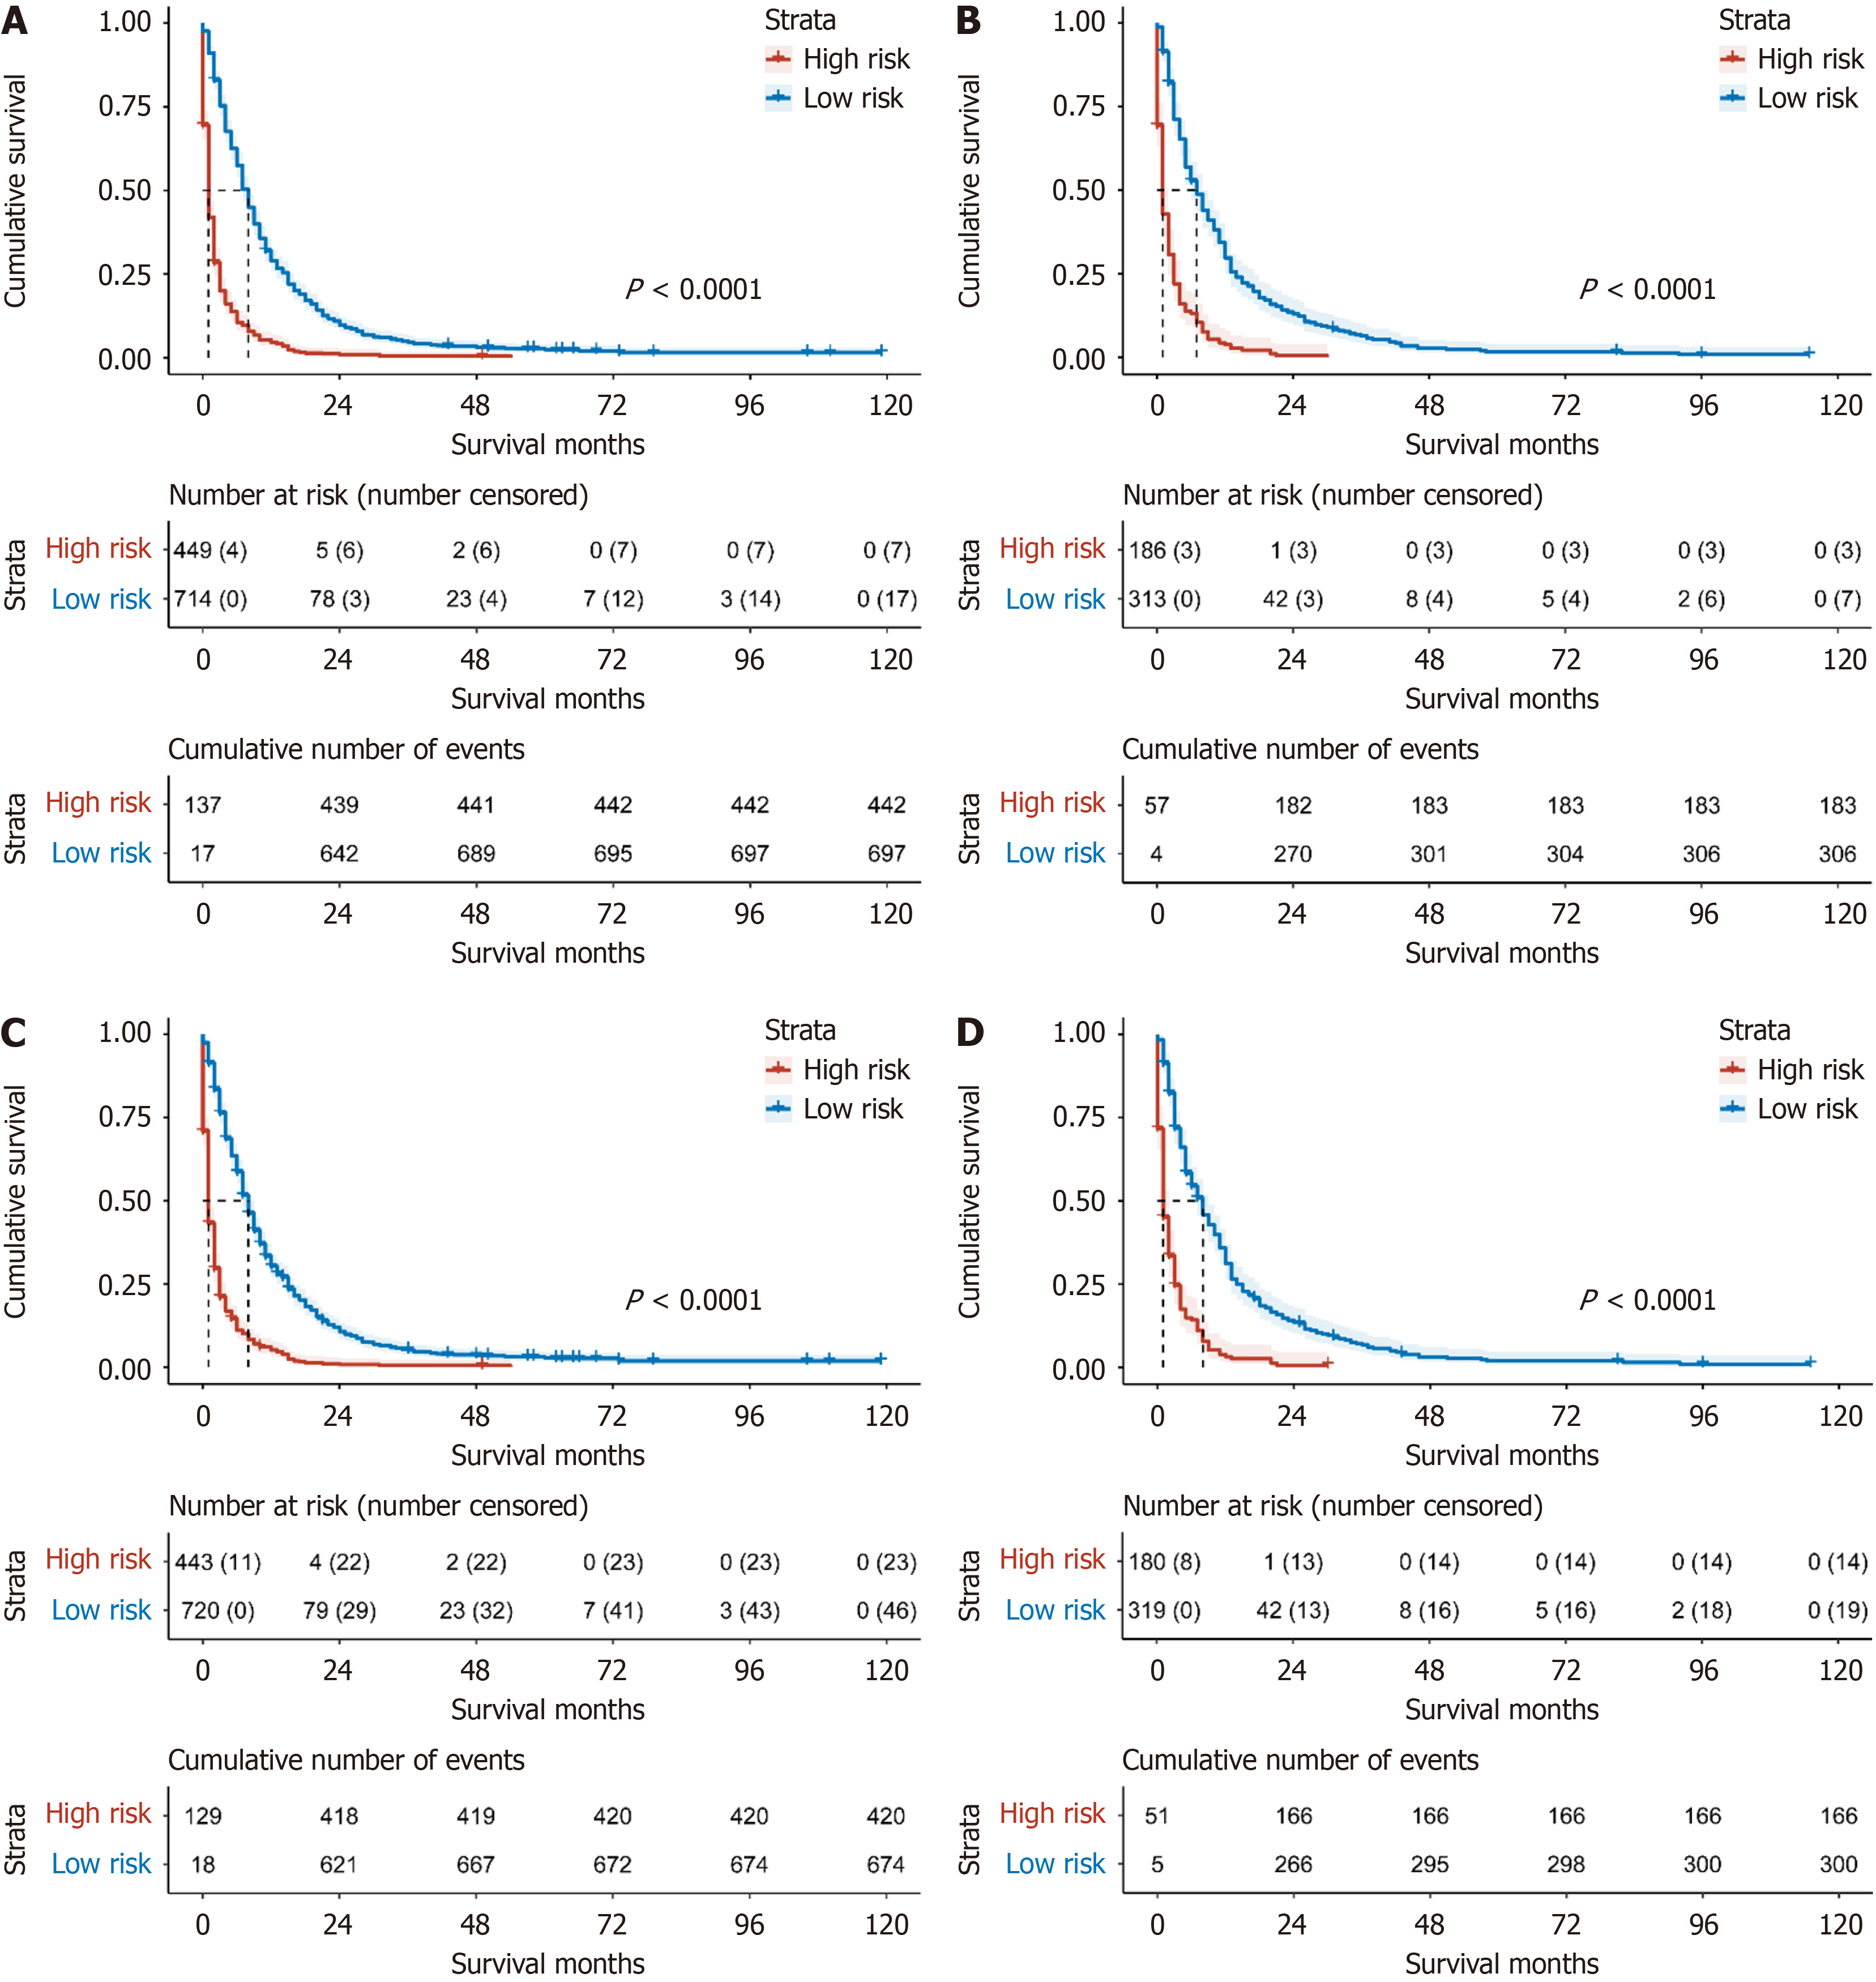
Figure 8 Risk-stratified survival curves of overall survival and cancer-specific survival in the training cohort, and overall survival and cancer-specific survival in the validation cohort.
A and B: Risk-stratified survival curves of overall survival (OS) (A) and cancer-specific survival (CSS) (B) in the training cohort; C and D: OS (C) and CSS (D) in the validation cohort.
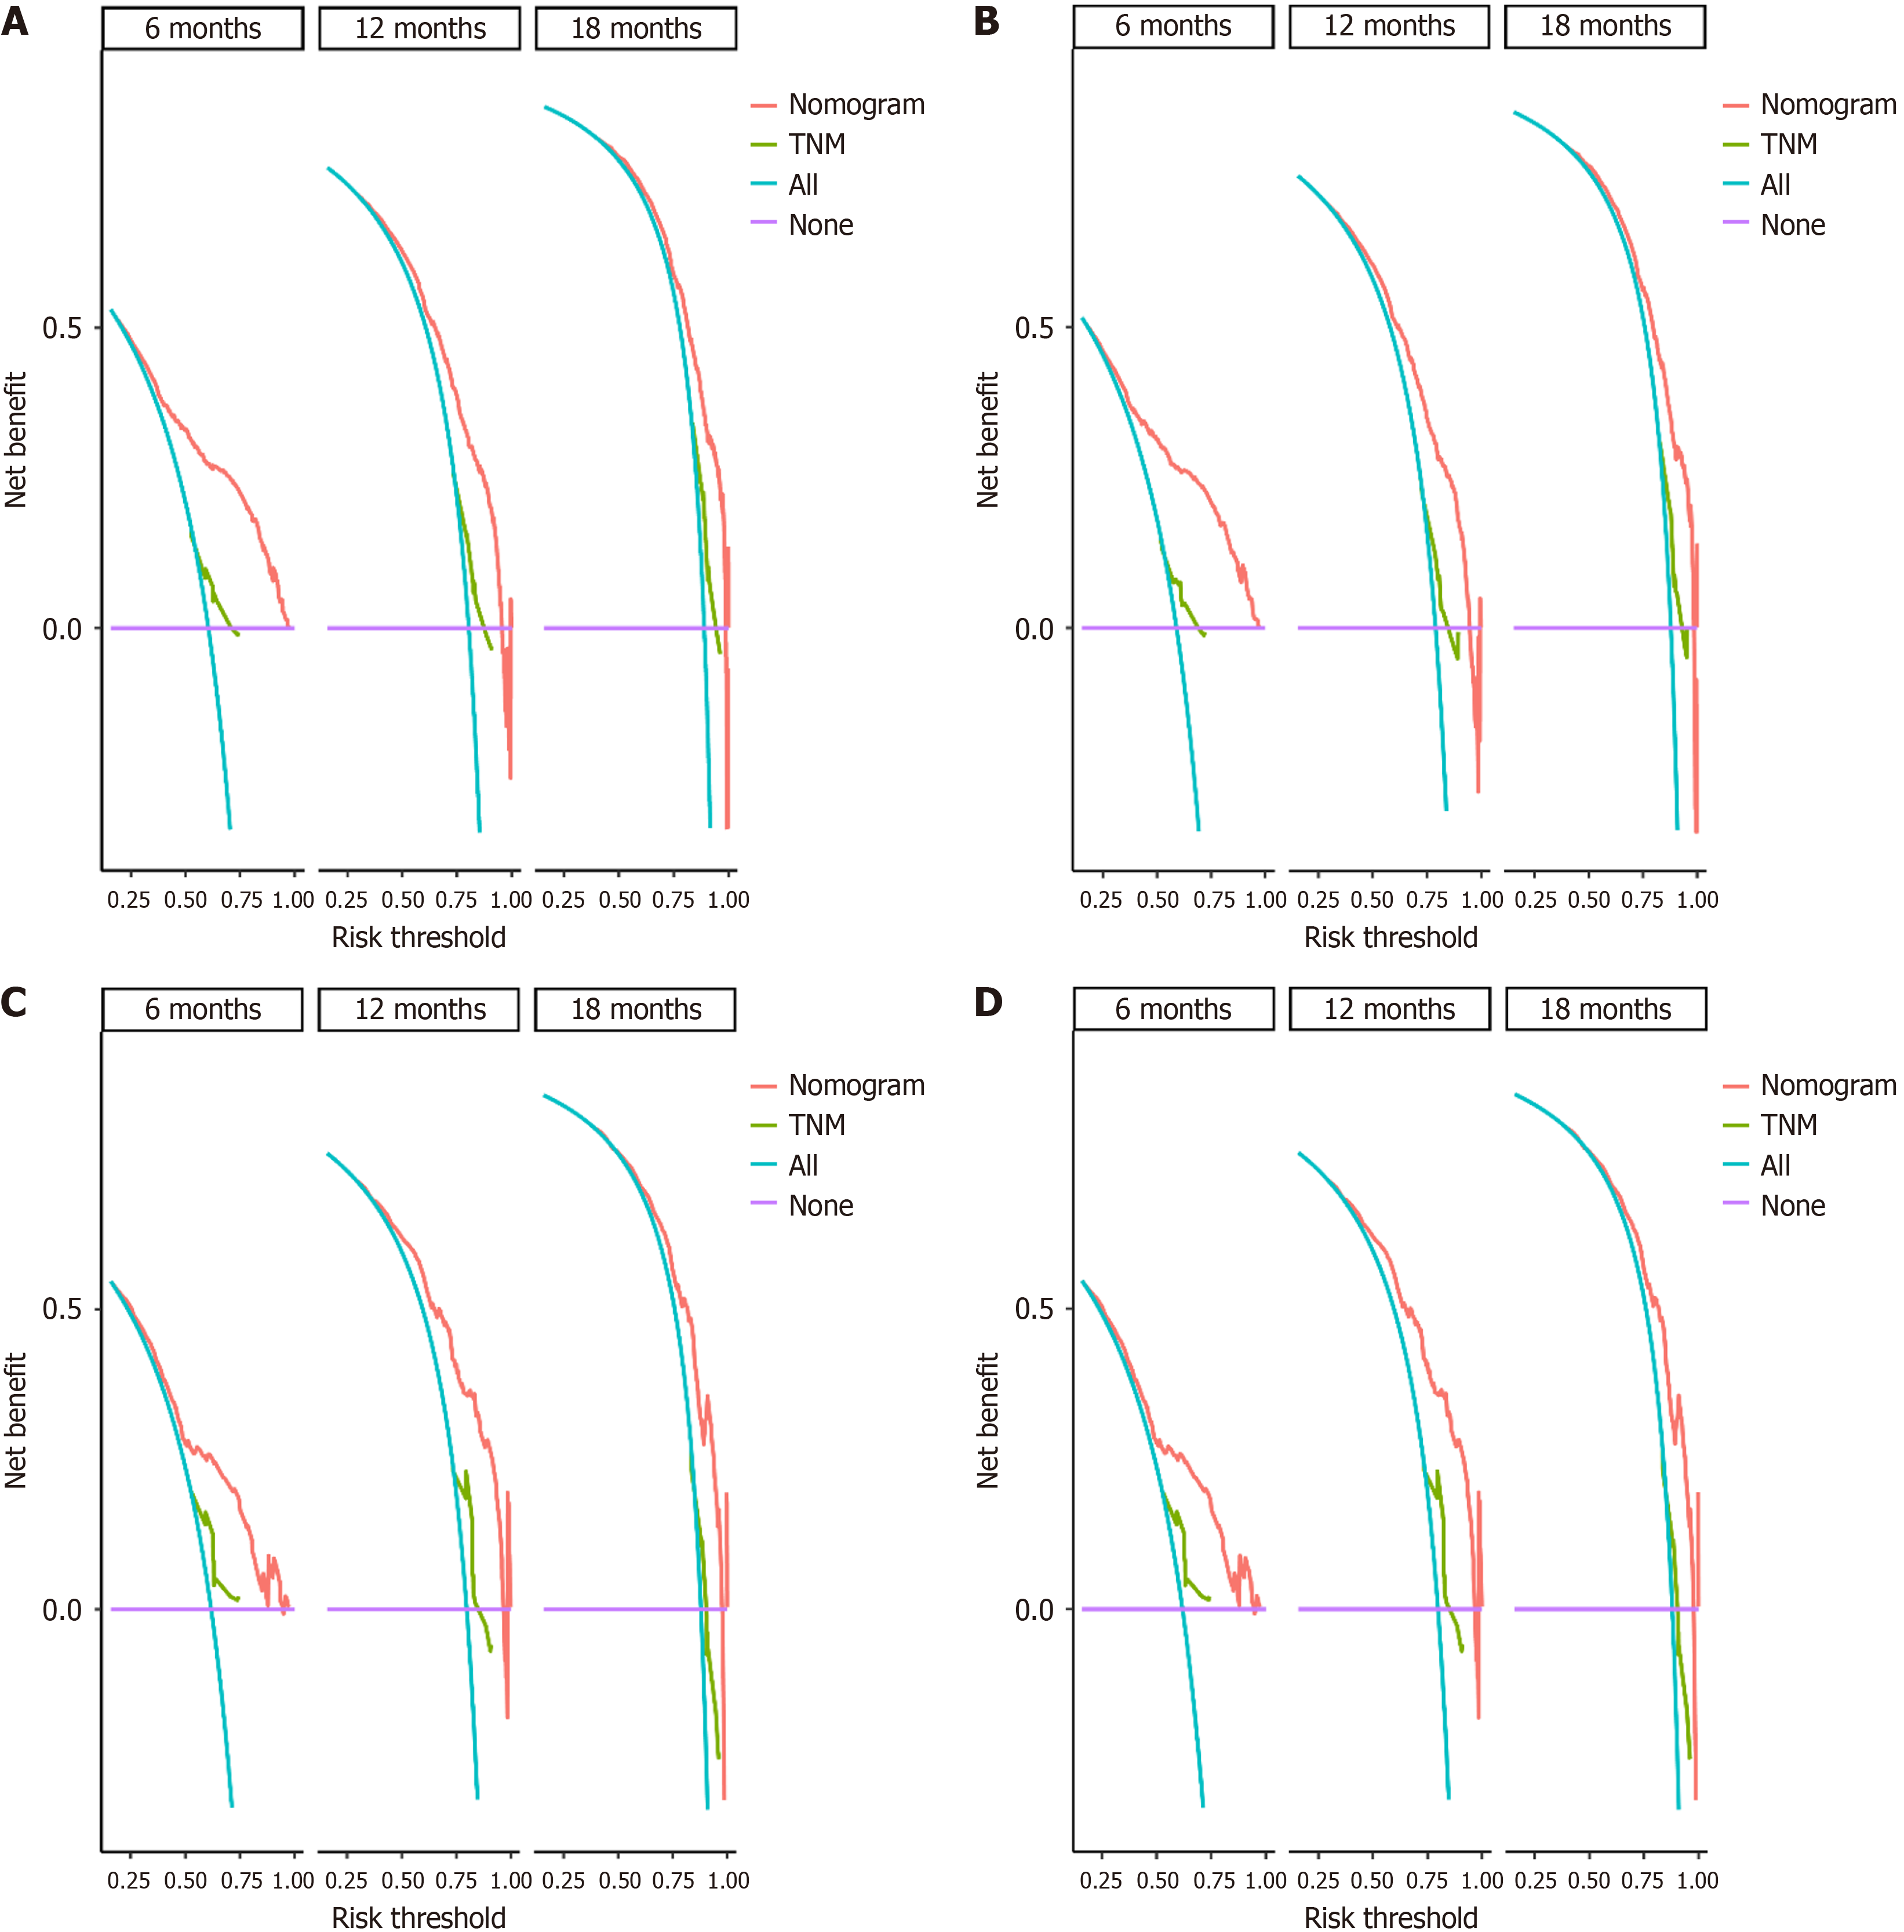
Figure 9 Comparison of decision curve analysis for the nomogram and tumor-node-metastasis staging system in predicting 6-month, 12-month, and 18-month overall survival and cancer-specific survival in both training and validation sets.
A: Training set overall survival (OS); B: Training set cancer-specific survival (CSS); C: Validation set OS; D: Validation set CSS. TNM: Tumor-node-metastasis.
- Citation: Huang K, Chen Z, Yuan XZ, He YS, Lan X, Du CY. Development and validation of machine learning nomograms for predicting survival in stage IV pancreatic cancer: A retrospective study. World J Gastrointest Oncol 2025; 17(5): 102459
- URL: https://www.wjgnet.com/1948-5204/full/v17/i5/102459.htm
- DOI: https://dx.doi.org/10.4251/wjgo.v17.i5.102459


