Copyright
©The Author(s) 2025.
World J Gastrointest Oncol. Mar 15, 2025; 17(3): 98844
Published online Mar 15, 2025. doi: 10.4251/wjgo.v17.i3.98844
Published online Mar 15, 2025. doi: 10.4251/wjgo.v17.i3.98844
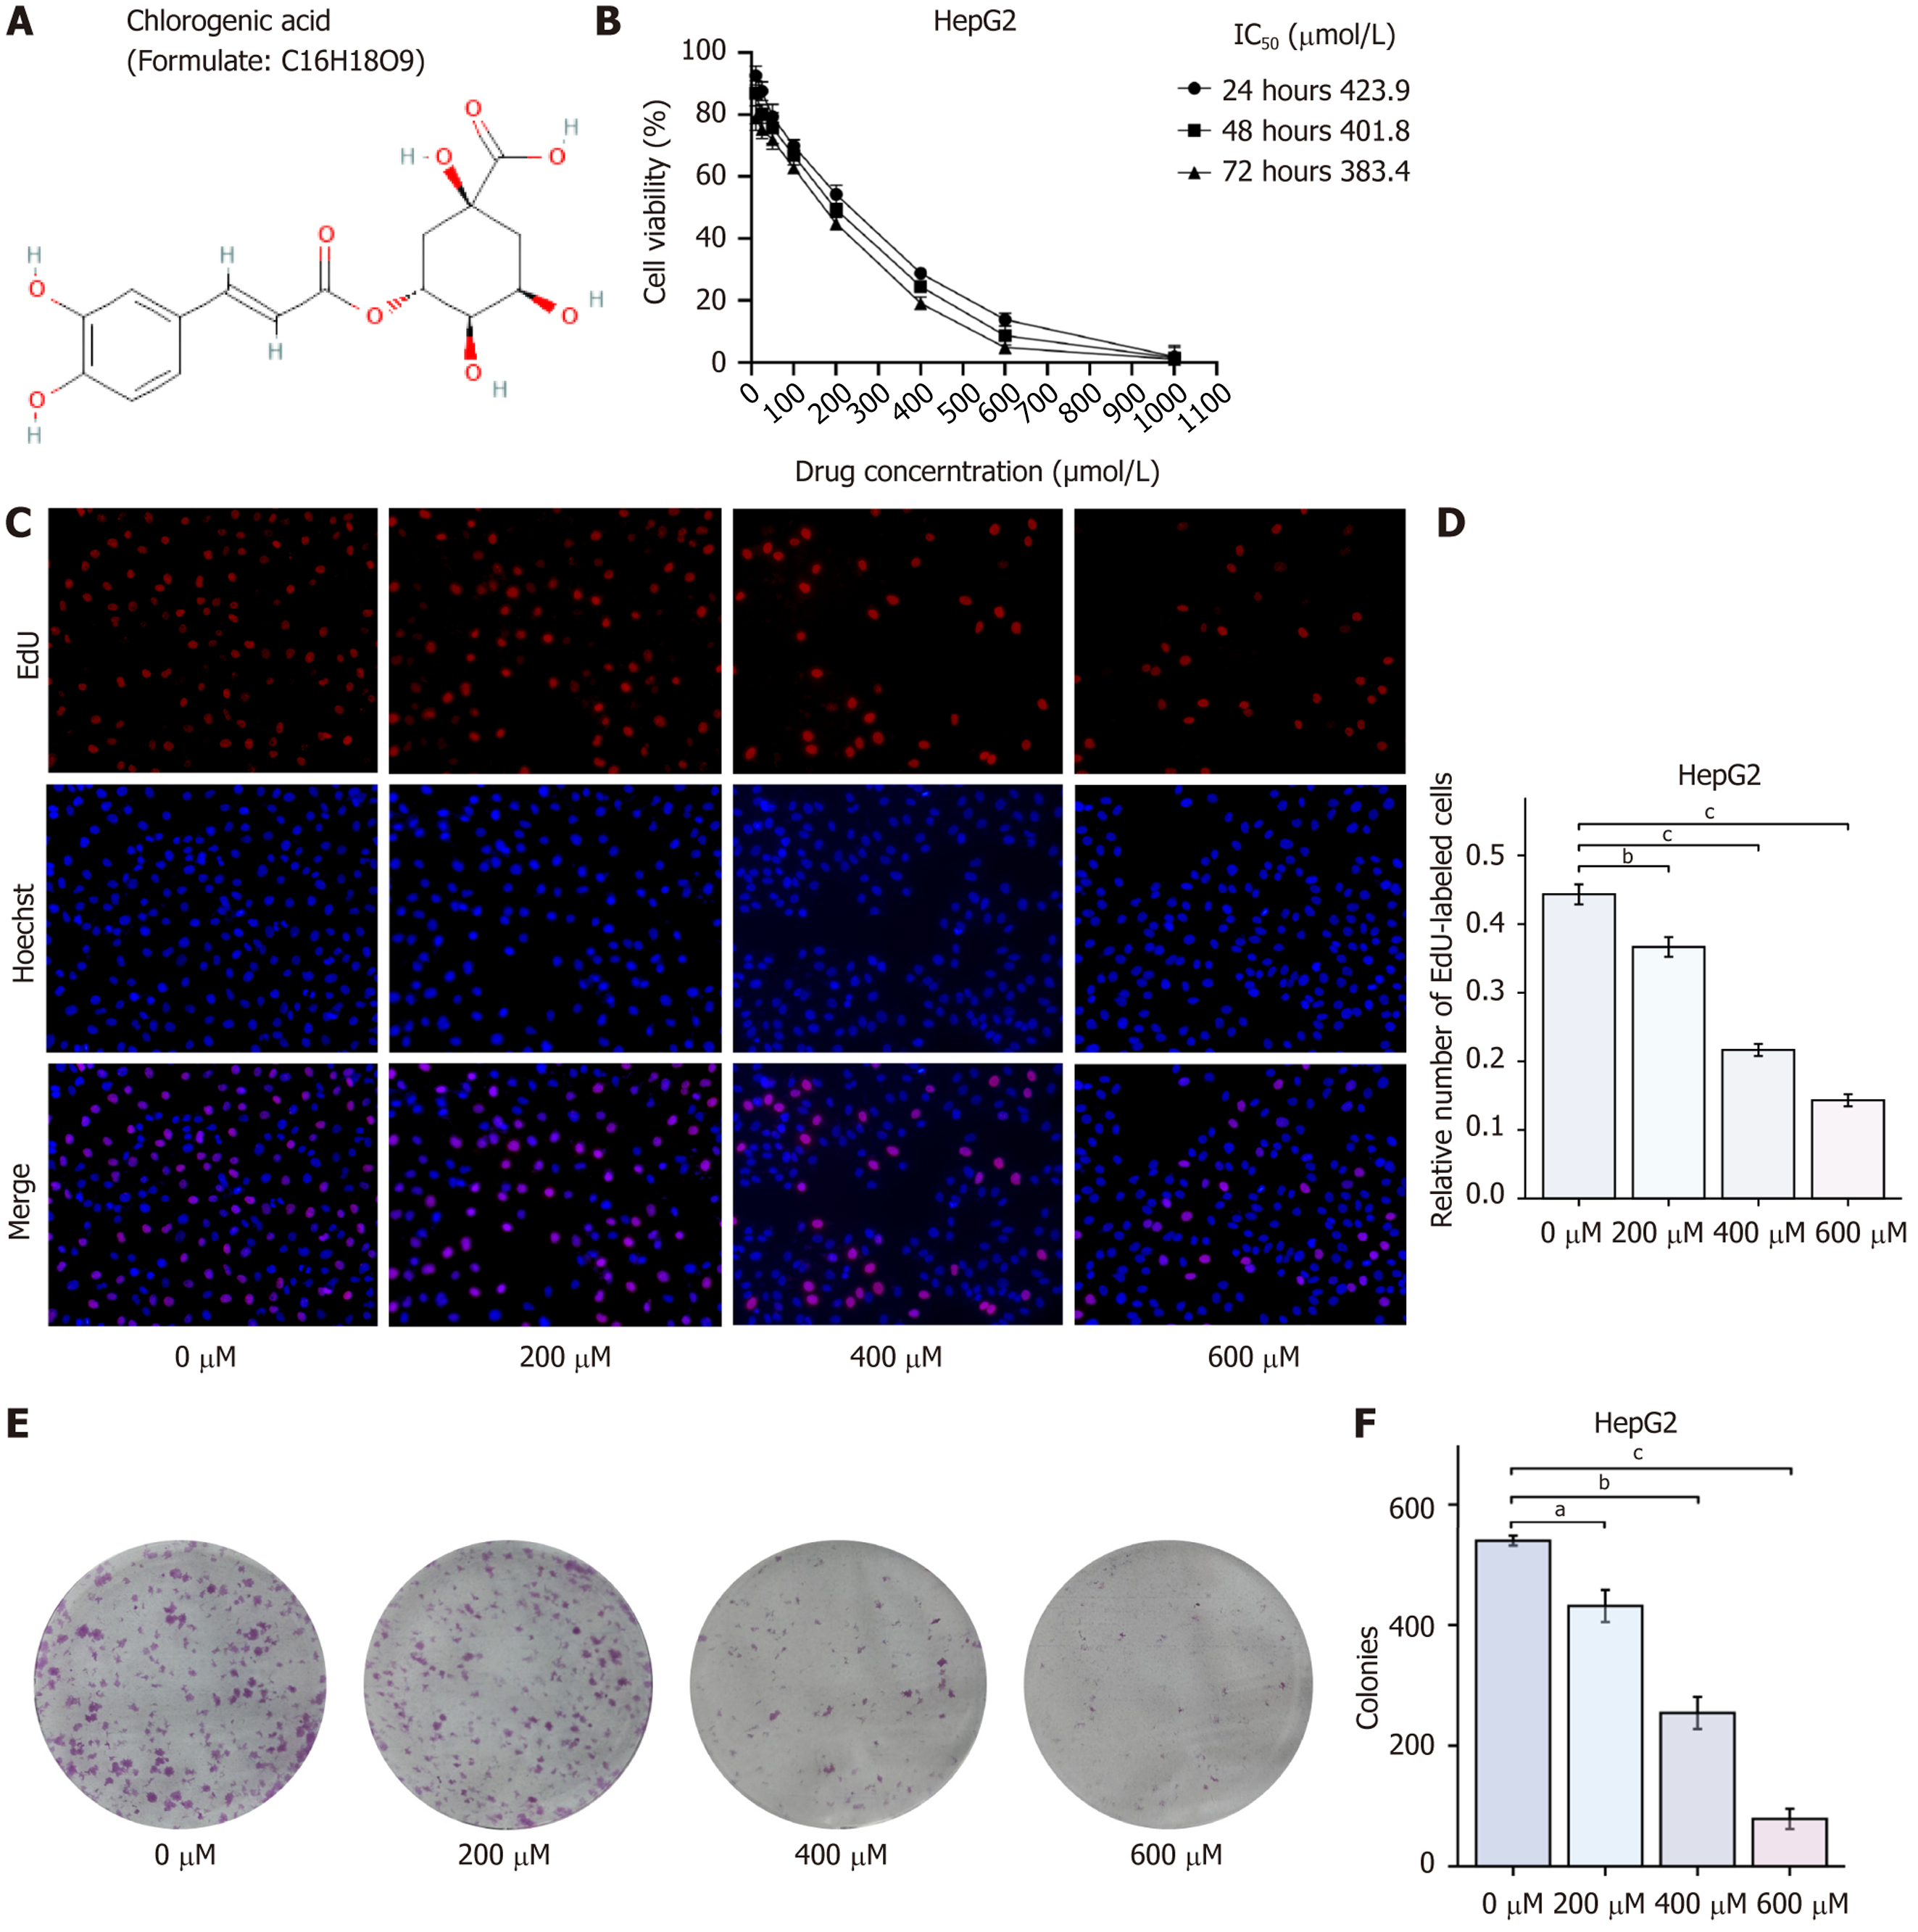
Figure 1 Chlorogenic acid inhibits HepG2 cell proliferation.
A: Chemical structure of chlorogenic acid; B: Cell viability of HepG2 cells measured by CCK-8 assay; C and D: Cell proliferation of HepG2 cells measured by EdU assay; E and F: Colony formation assay to evaluate long-term cell proliferation of HepG2 cells. Data are presented as the mean ± SEM of three independent experiments. aP < 0.05, bP < 0.01, and cP < 0.001 compared to the 0 μmol chlorogenic acid group.
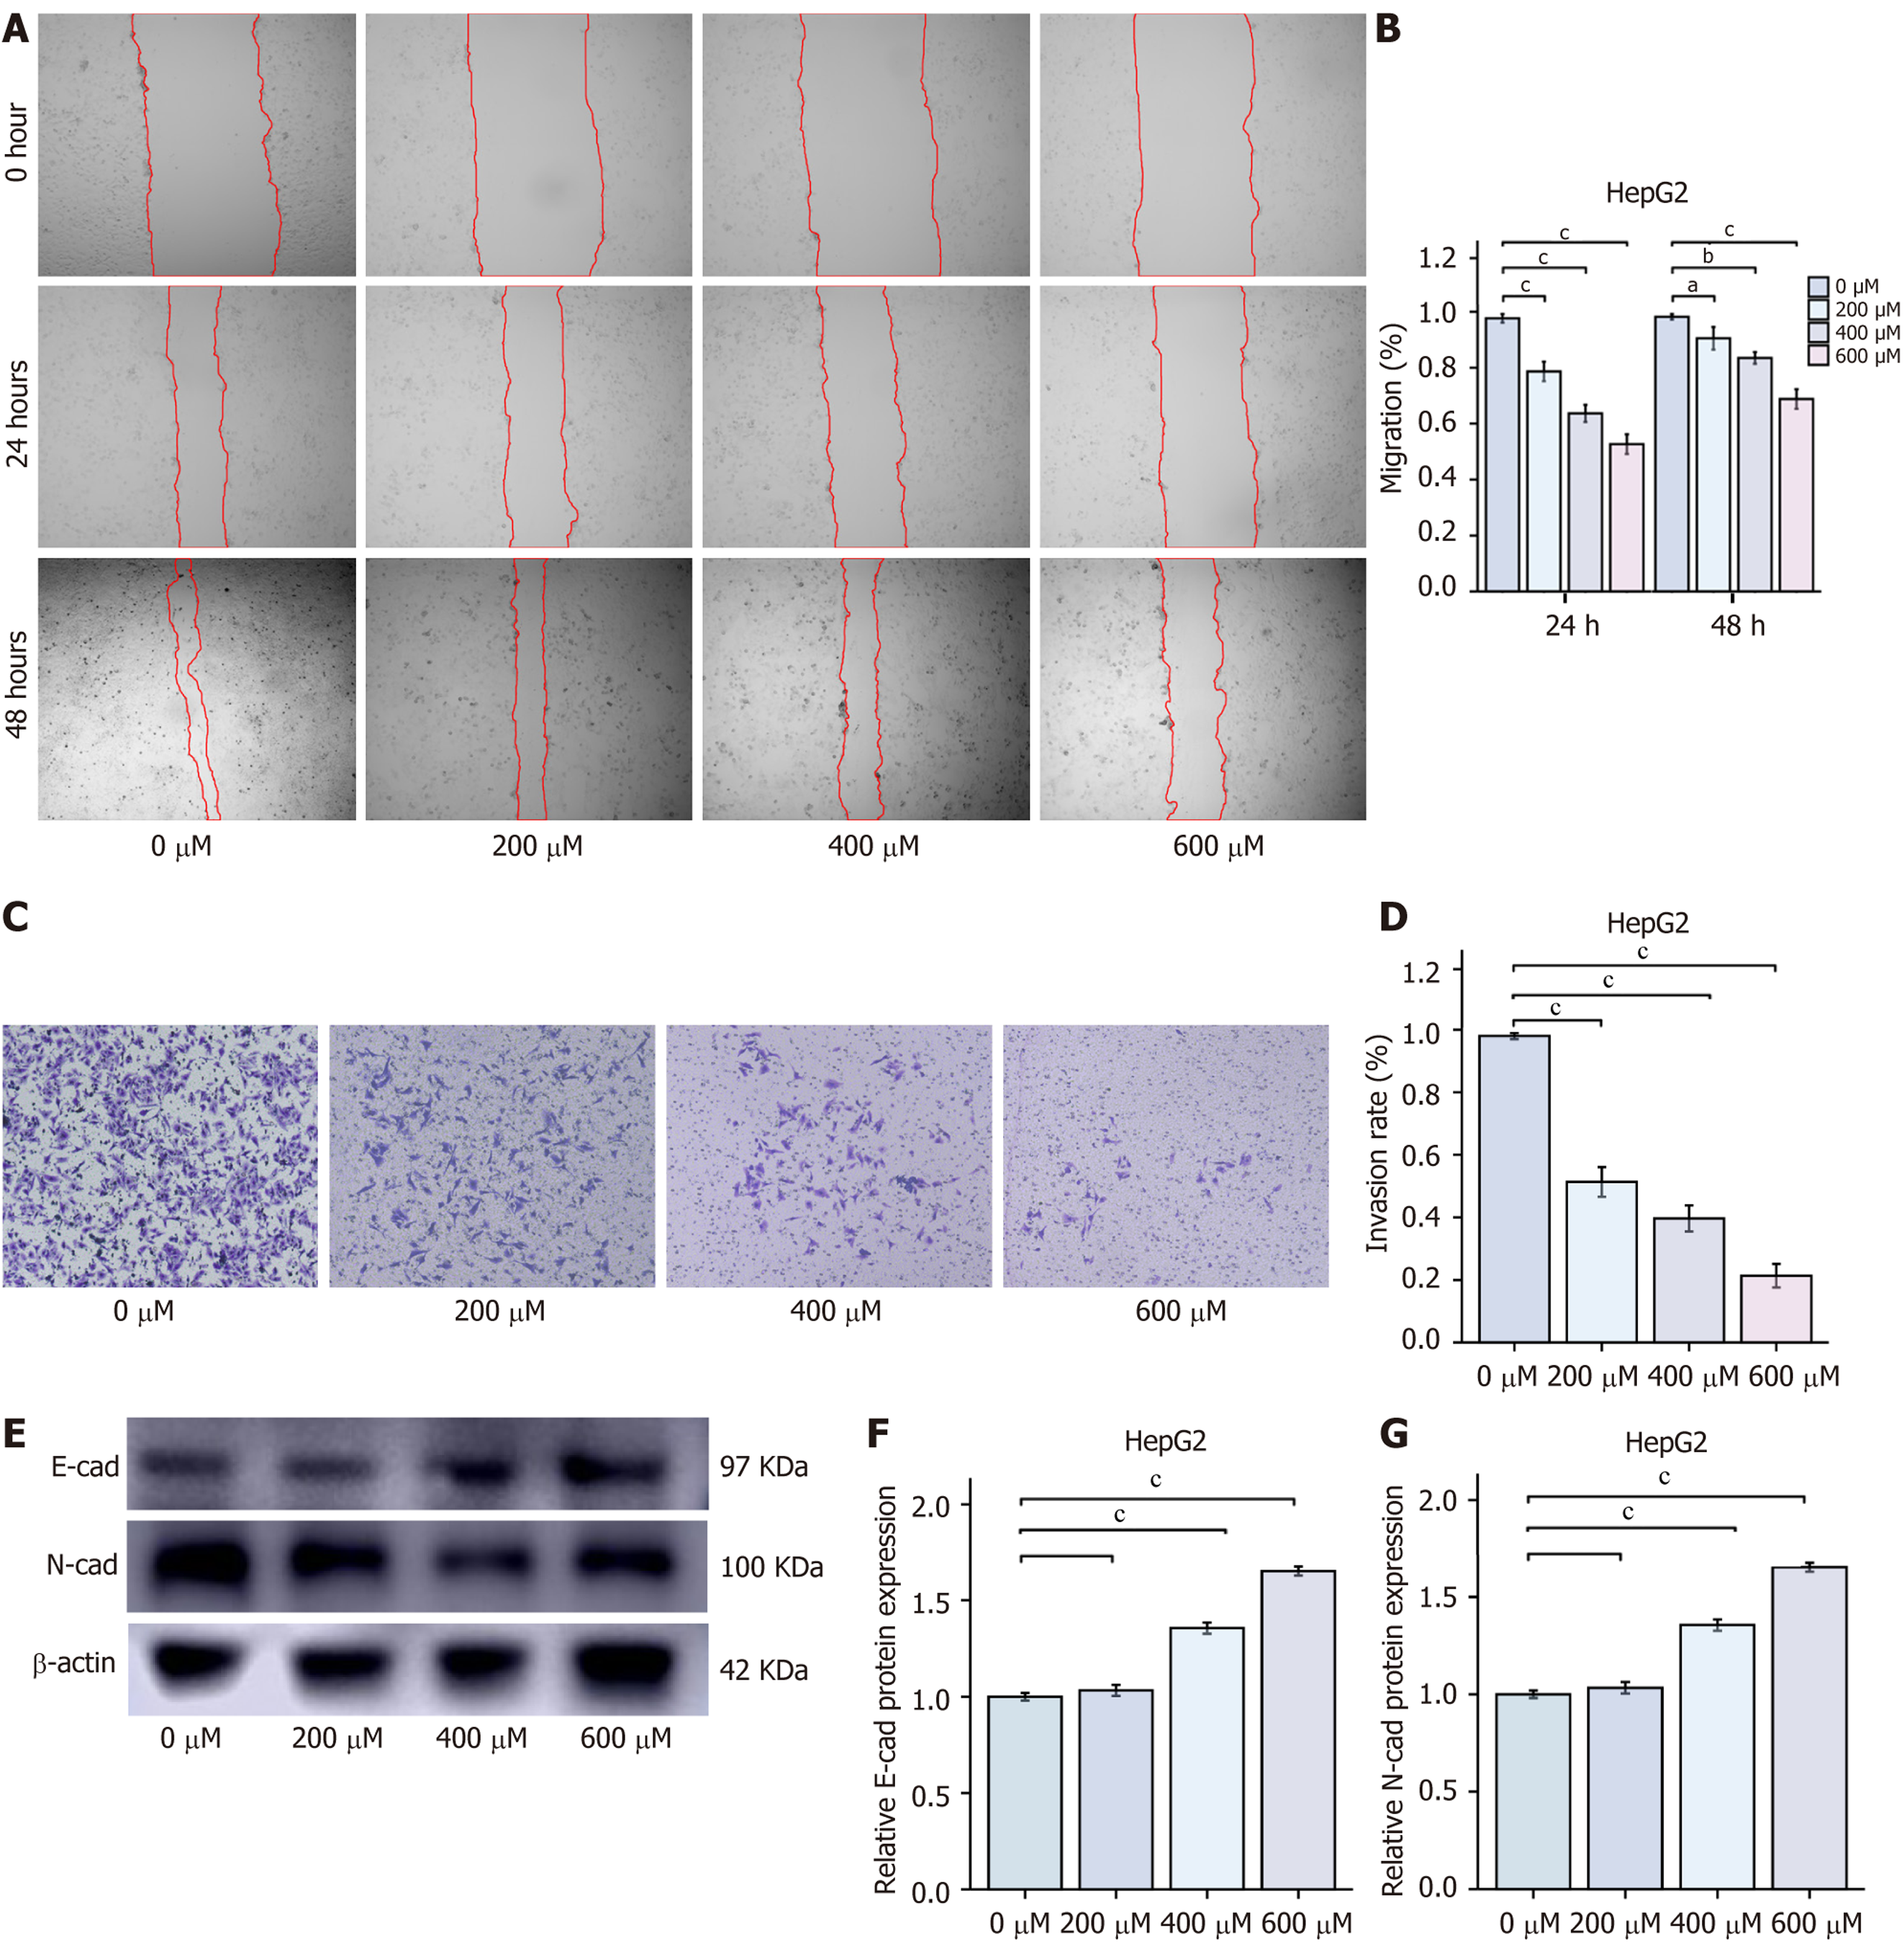
Figure 2 Chlorogenic acid inhibits HepG2 cell migration and invasion (mean ± SD, n = 3).
A and B: Wound healing assay to evaluate the migration ability of HepG2 cells; C and D: Transwell assay (× 100 magnification) to evaluate the invasion ability of HepG2 cells; E-G: Western blot analysis of E-cadherin and N-cadherin protein levels. aP < 0.05, bP < 0.01, and cP < 0.001 compared to the 0 μmol chlorogenic acid group. E-cad: E-cadherin; N-cad: N-cadherin.
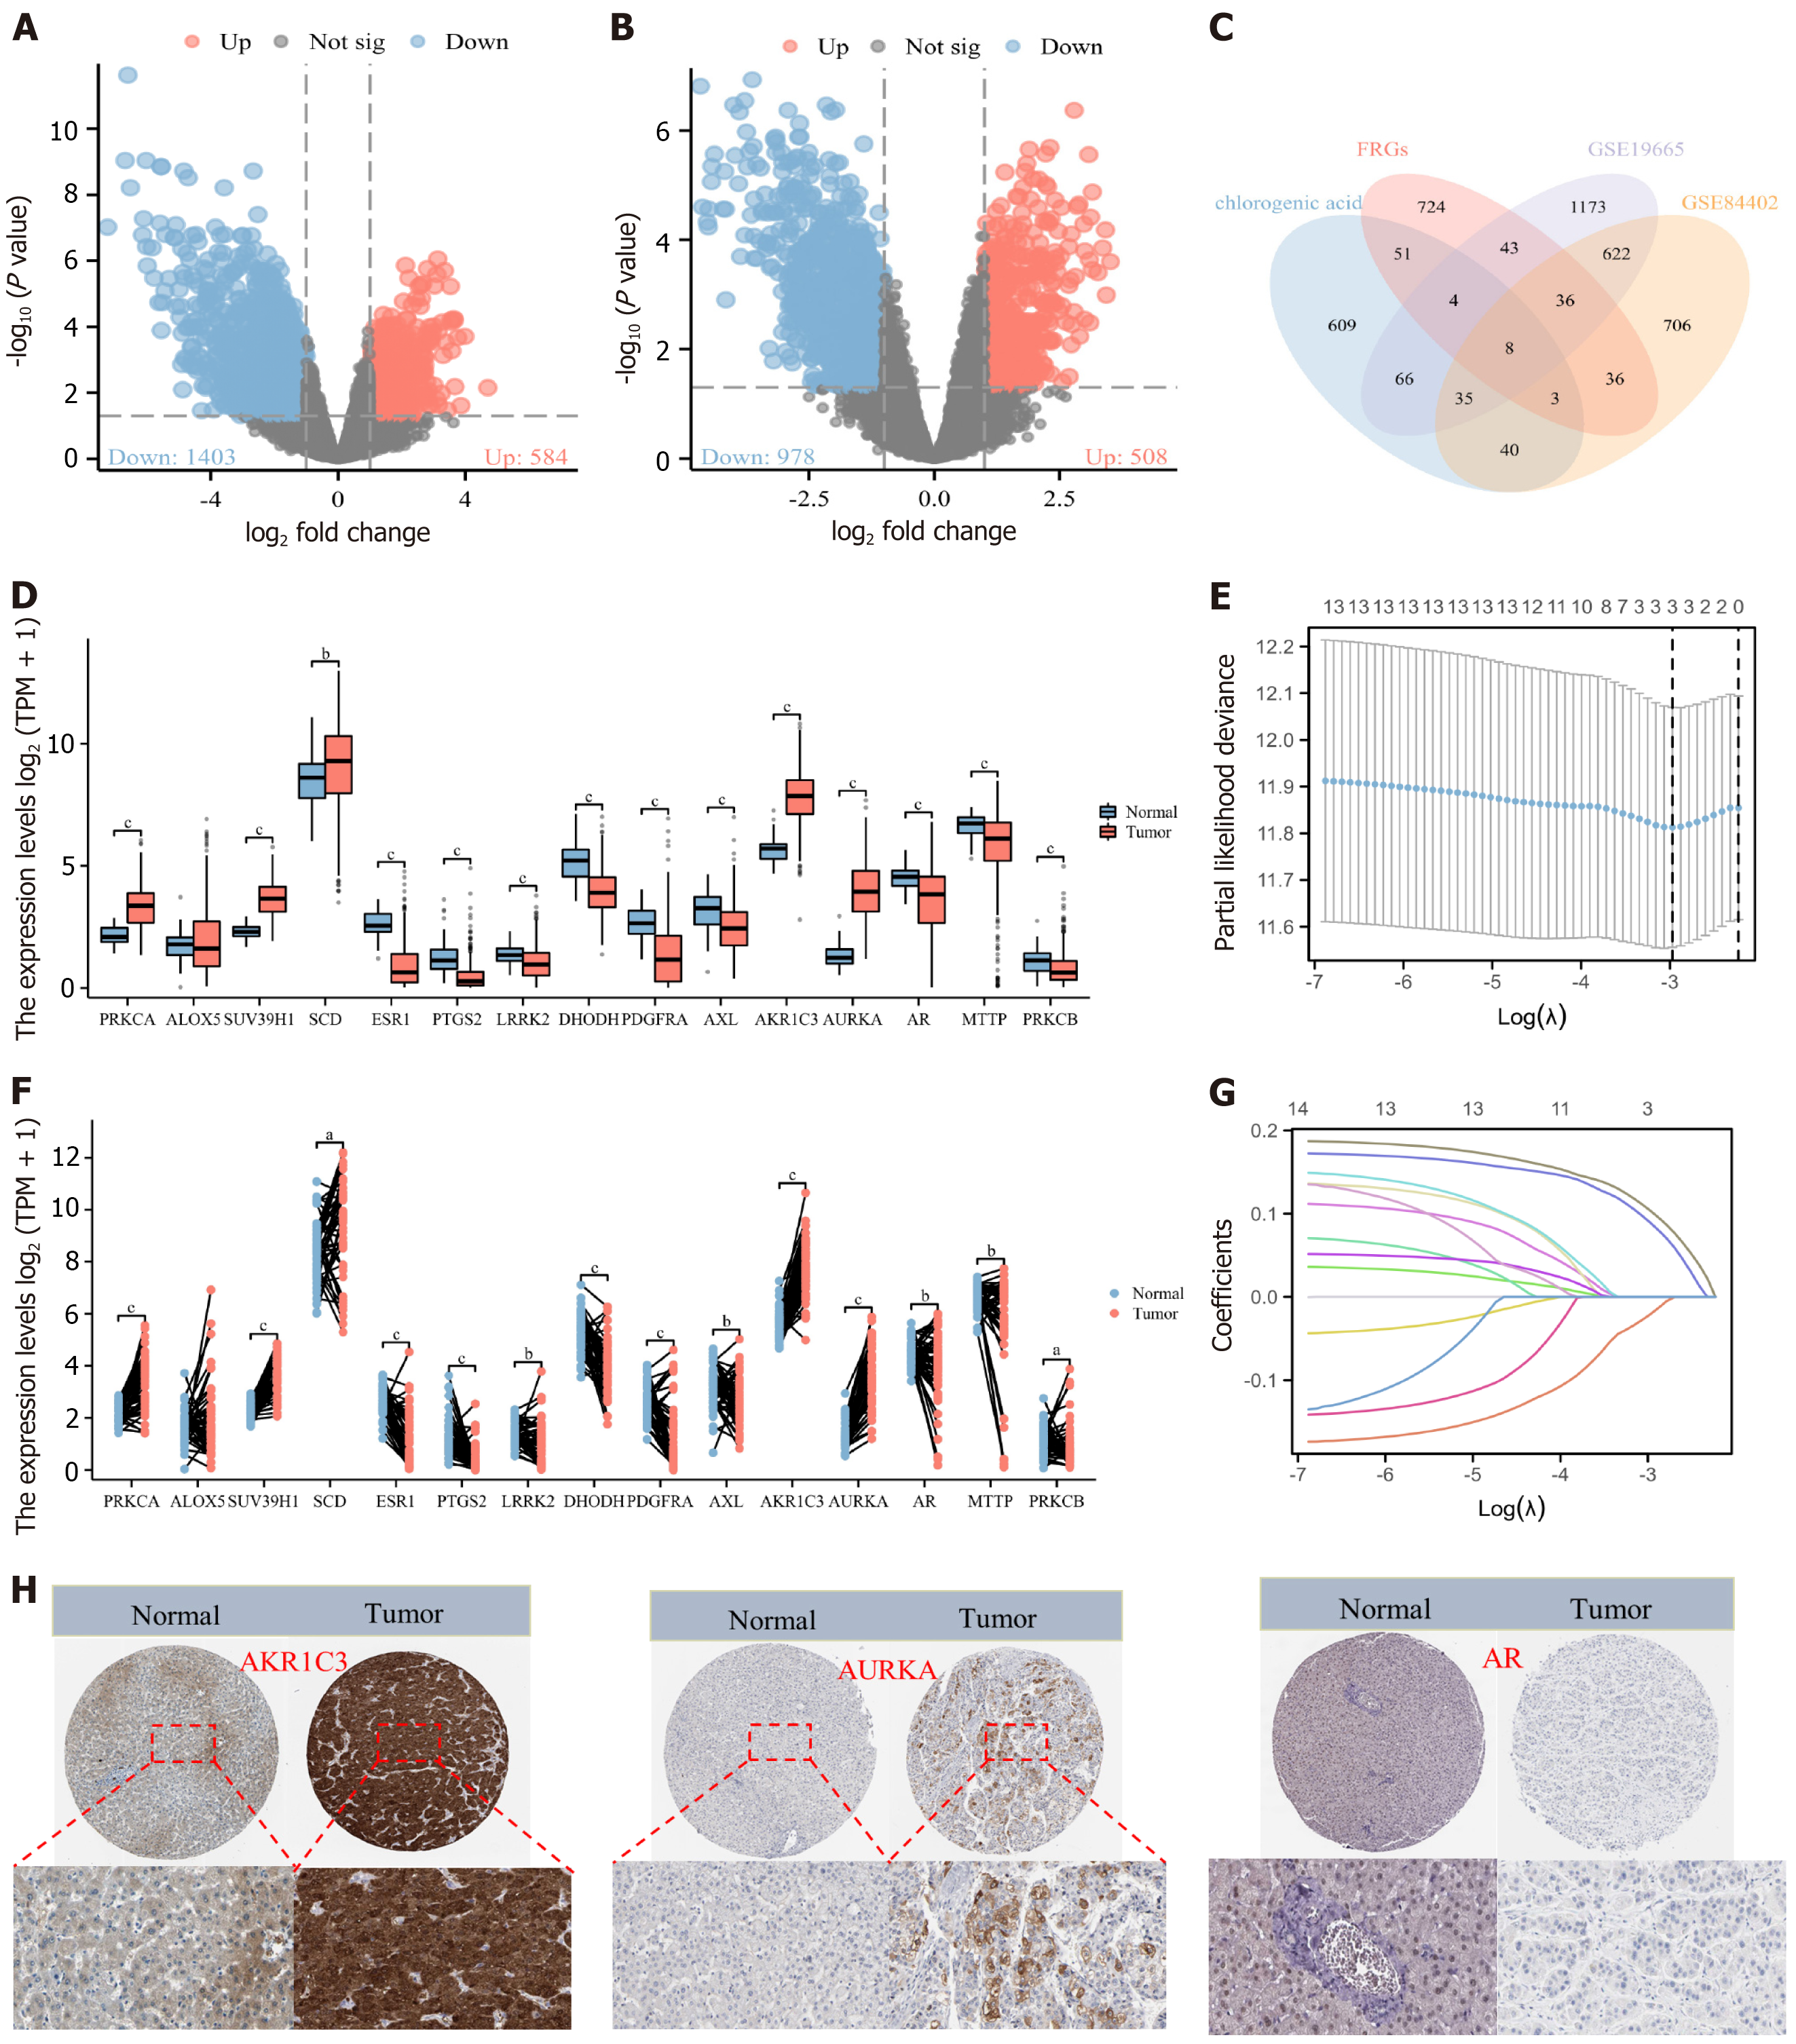
Figure 3 Acquisition, expression difference, and prognostic analysis of chlorogenic acid intervention targets (mean ± SD, n = 374).
A: Volcano plot of differential analysis based on GSE19665 dataset; B: Volcano plot of differential analysis based on GSE84402 dataset; C: Venn diagram showing the intersection of chlorogenic acid (CGA) targets, hepatocellular carcinoma (HCC) targets from GSE19665 and GSE84402 datasets, and ferroptosis-related genes; D: Unpaired expression analysis of CGA intervention targets in HCC patients; F: Paired expression analysis of CGA intervention targets in HCC patients; E and G: Lasso regression analysis of CGA intervention targets; H: Immunohistochemical analysis of CGA intervention targets in the Human Protein Atlas database. Not sig: Not significant; FRG: Ferroptosis-related genes; TPM: Transcripts per million; AKR1C3: Aldo-keto reductase family 1 member C3; AURKA: Aurora kinase A; AR: Androgen receptor.
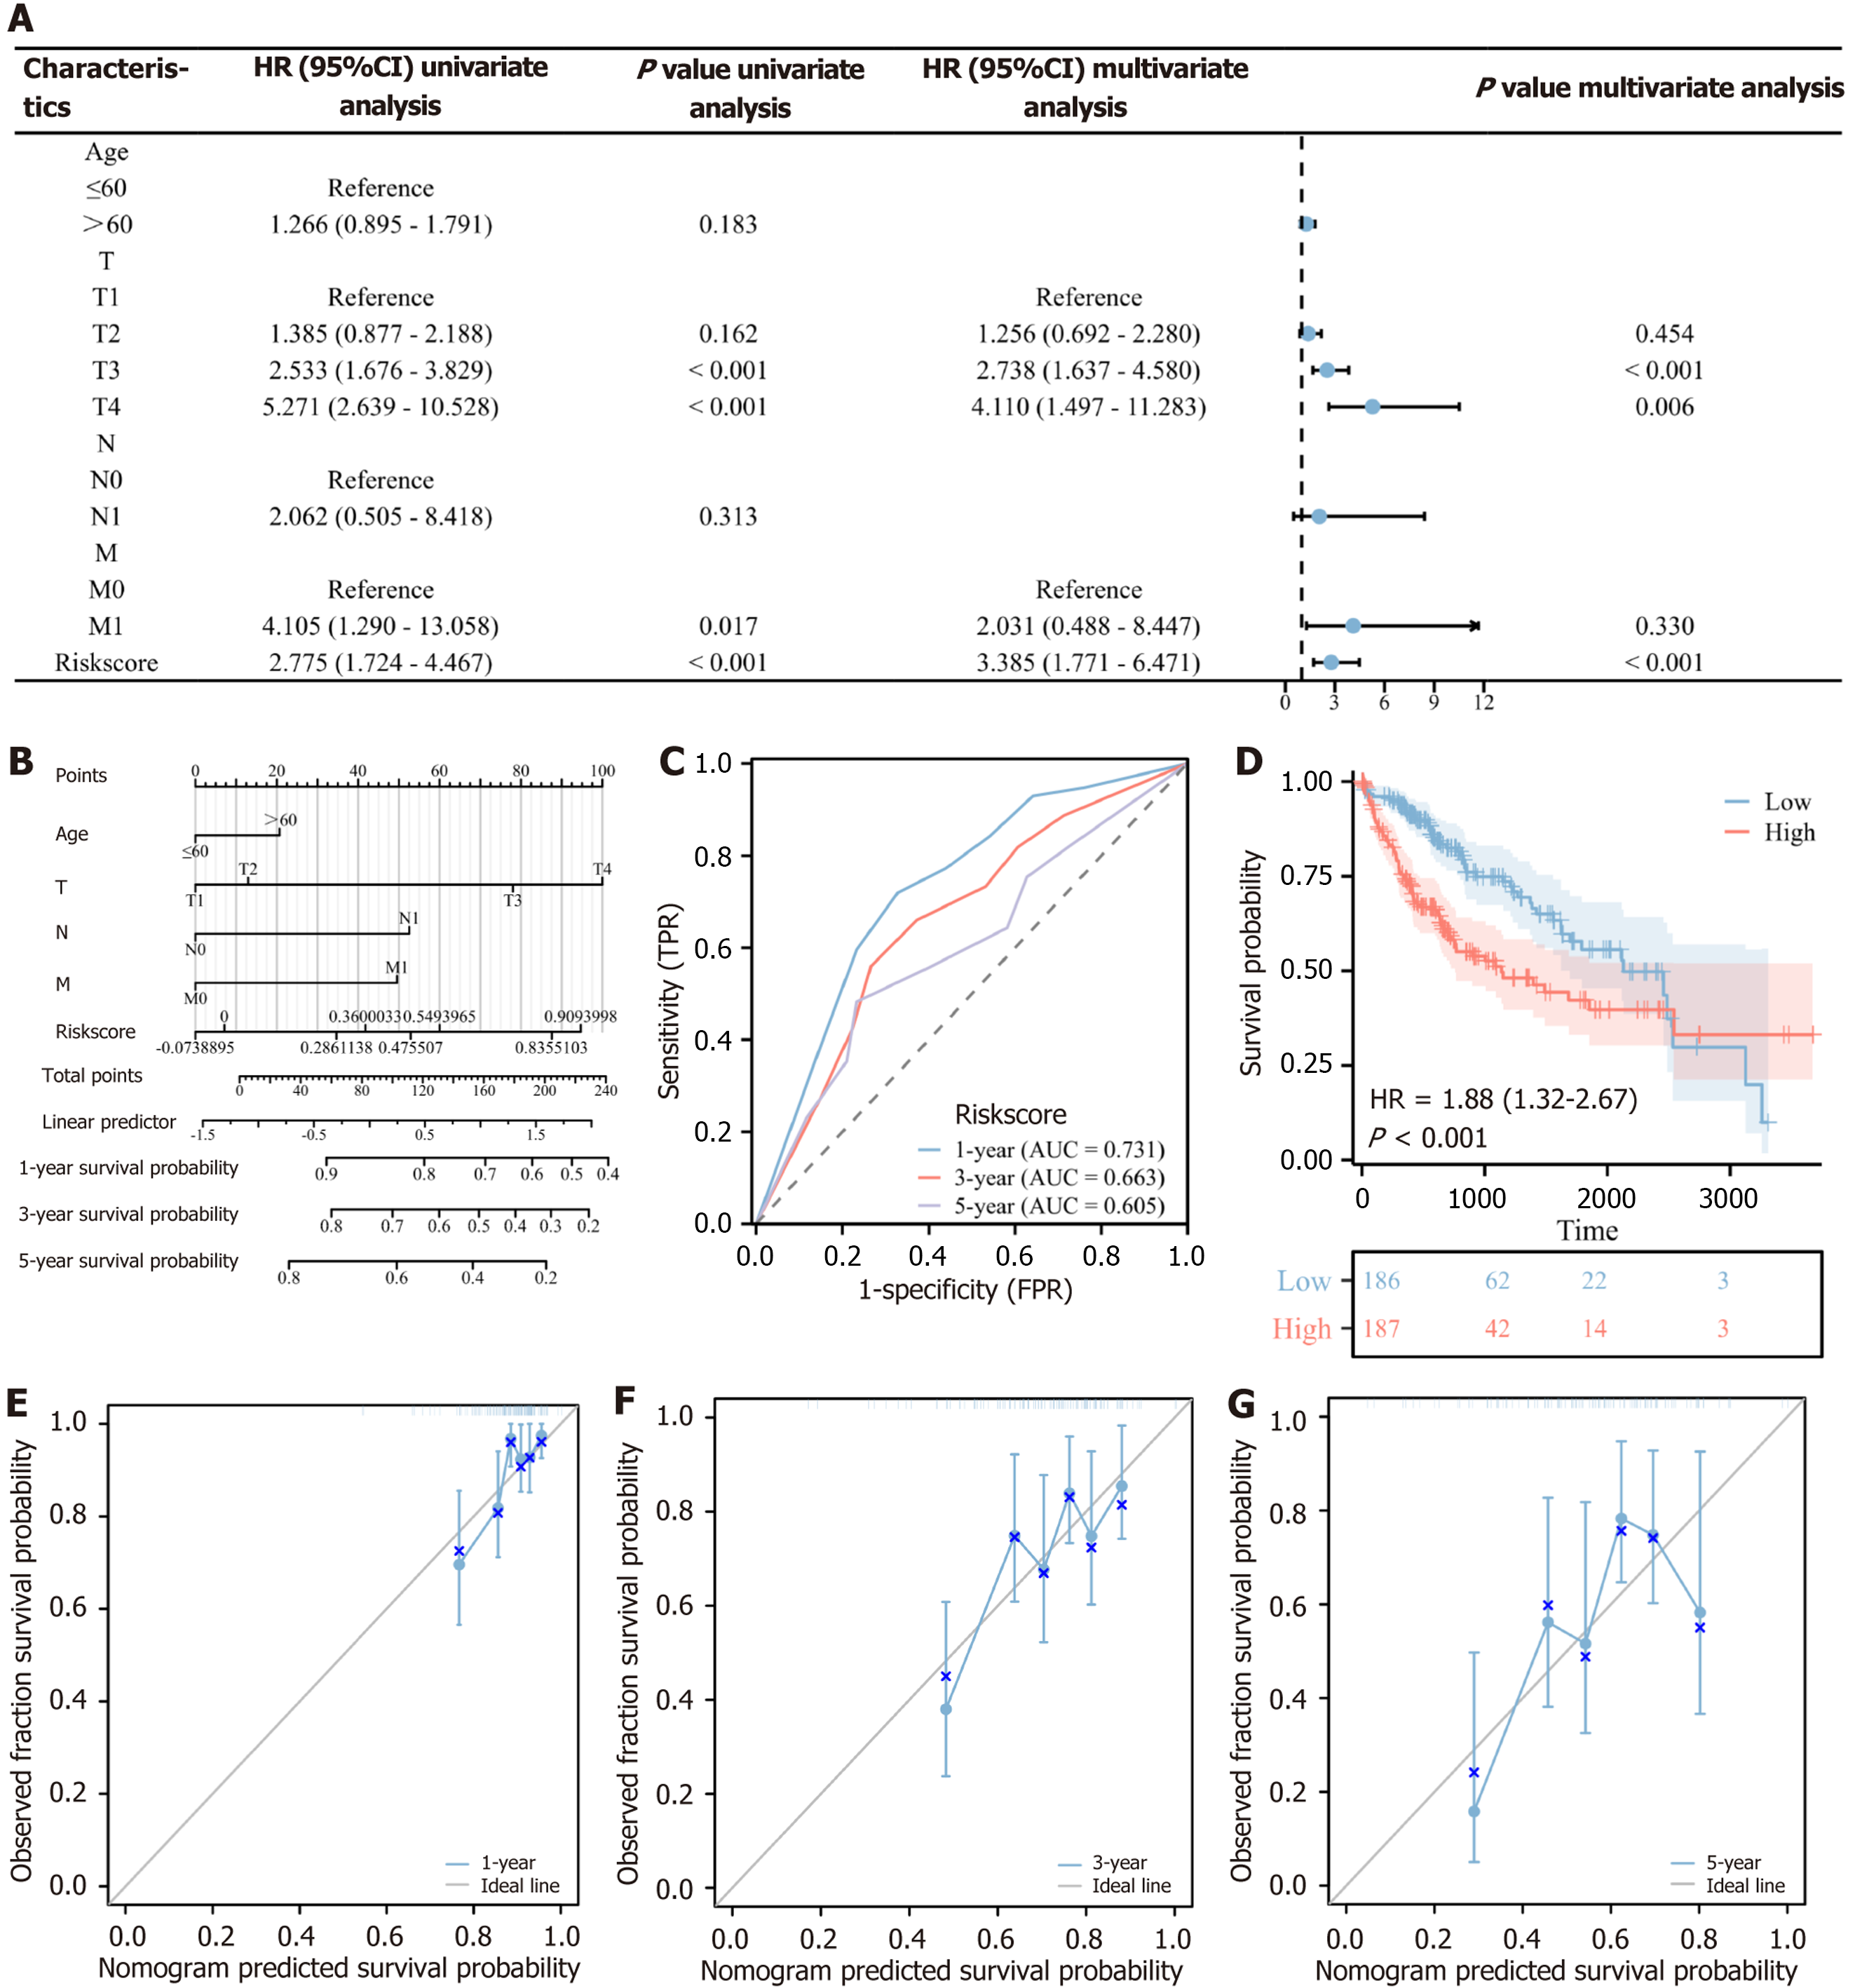
Figure 4 Construction and evaluation of the risk assessment system for chlorogenic acid intervention targets and nomogram.
A: Forest plot of univariate and multivariate Cox regression analysis of chlorogenic acid intervention targets; B: Construction of nomogram integrating risk score and clinical information; C: Time-receiver operating characteristic curve of the risk assessment system; D: Kaplan-Meier curve comparing the survival between high- and low-risk groups; E-G: Calibration plots of the nomogram for 1-year, 3-year, and 5-year survival (mean ± SD, n = 374). HR: Hazard ratios; CI: Confidence intervals; T: Tumor; N: Node; M: Metastasis; TPR: True positive rate.
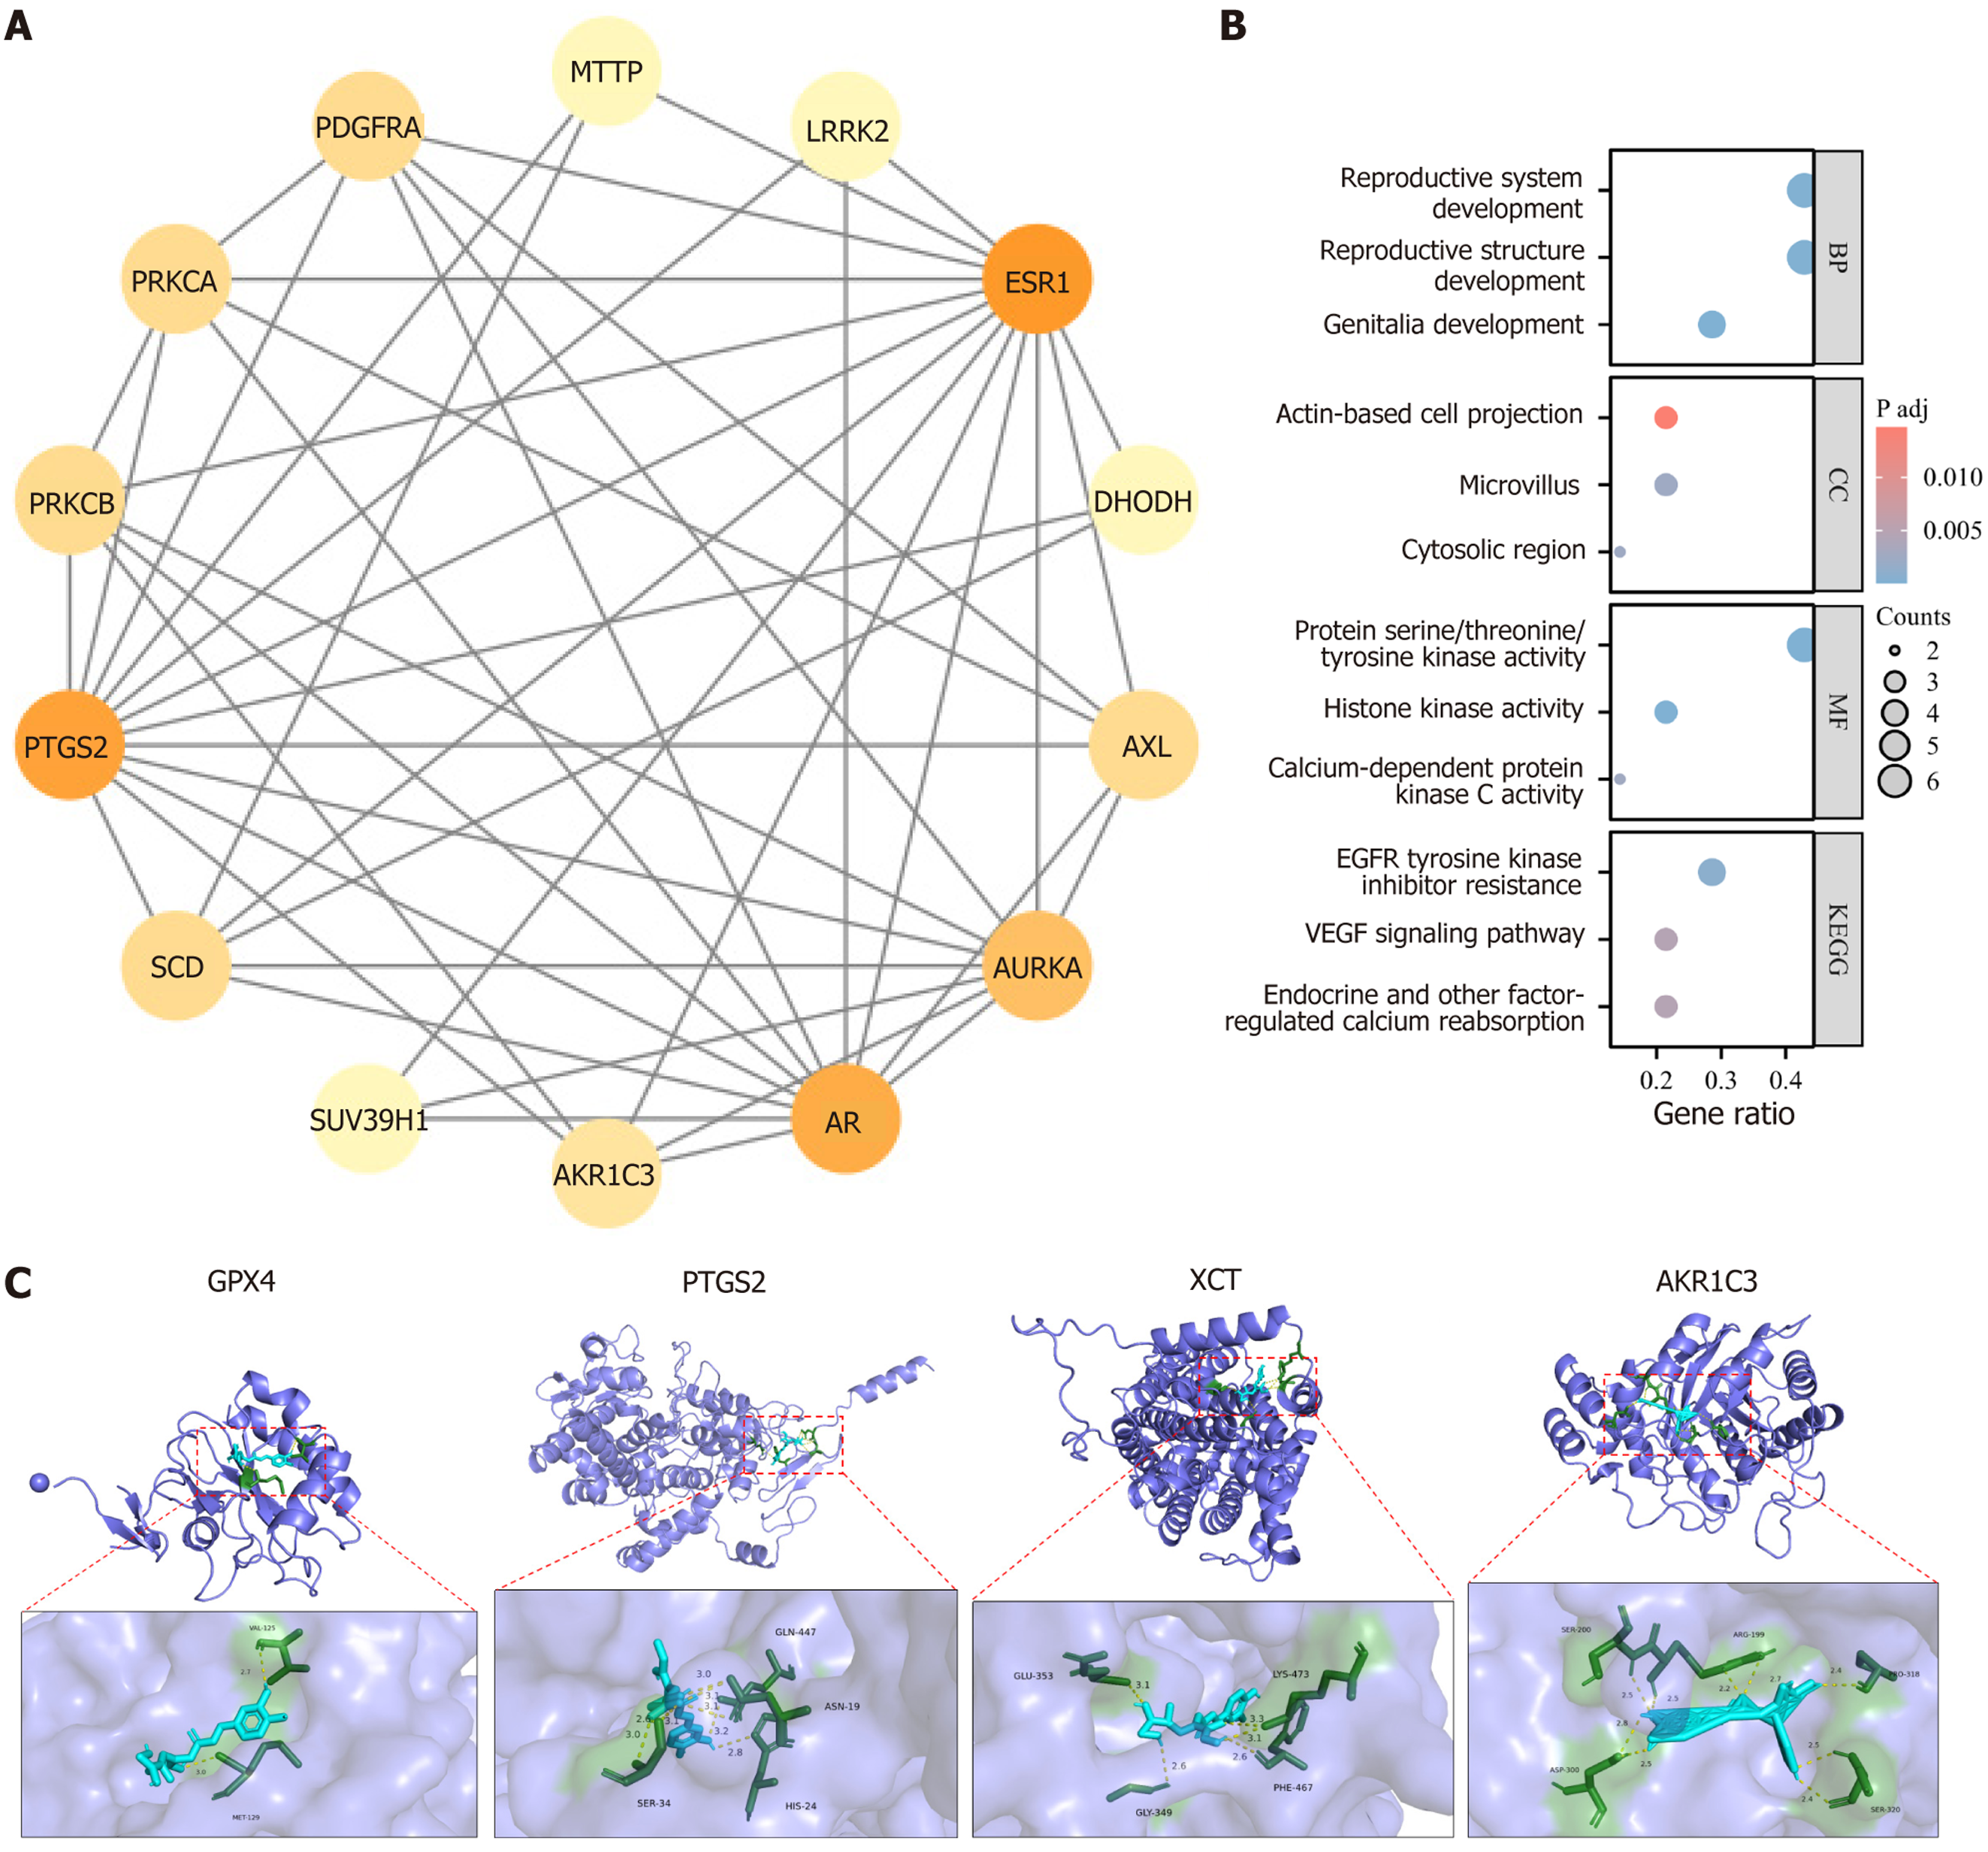
Figure 5 Network pharmacology and molecular docking analysis of chlorogenic acid intervention targets.
A: Protein-protein interaction network of the 14 chlorogenic acid intervention targets; B: Gene ontology and Kyoto Encyclopedia of Genes and Genomes enrichment analysis results; C: Molecular docking results of chlorogenic acid with peroxisome proliferator activated receptor gamma, fatty acid binding protein 4, glutathione peroxidase 4, and cystine glutamate reverse transporter. GPX4: Glutathione peroxidase 4; PTGS2: Prostaglandin endoperoxide synthase 2; xCT: Cystine glutamate reverse transporter; AKR1C3: Aldo-keto reductase family 1 member C3.
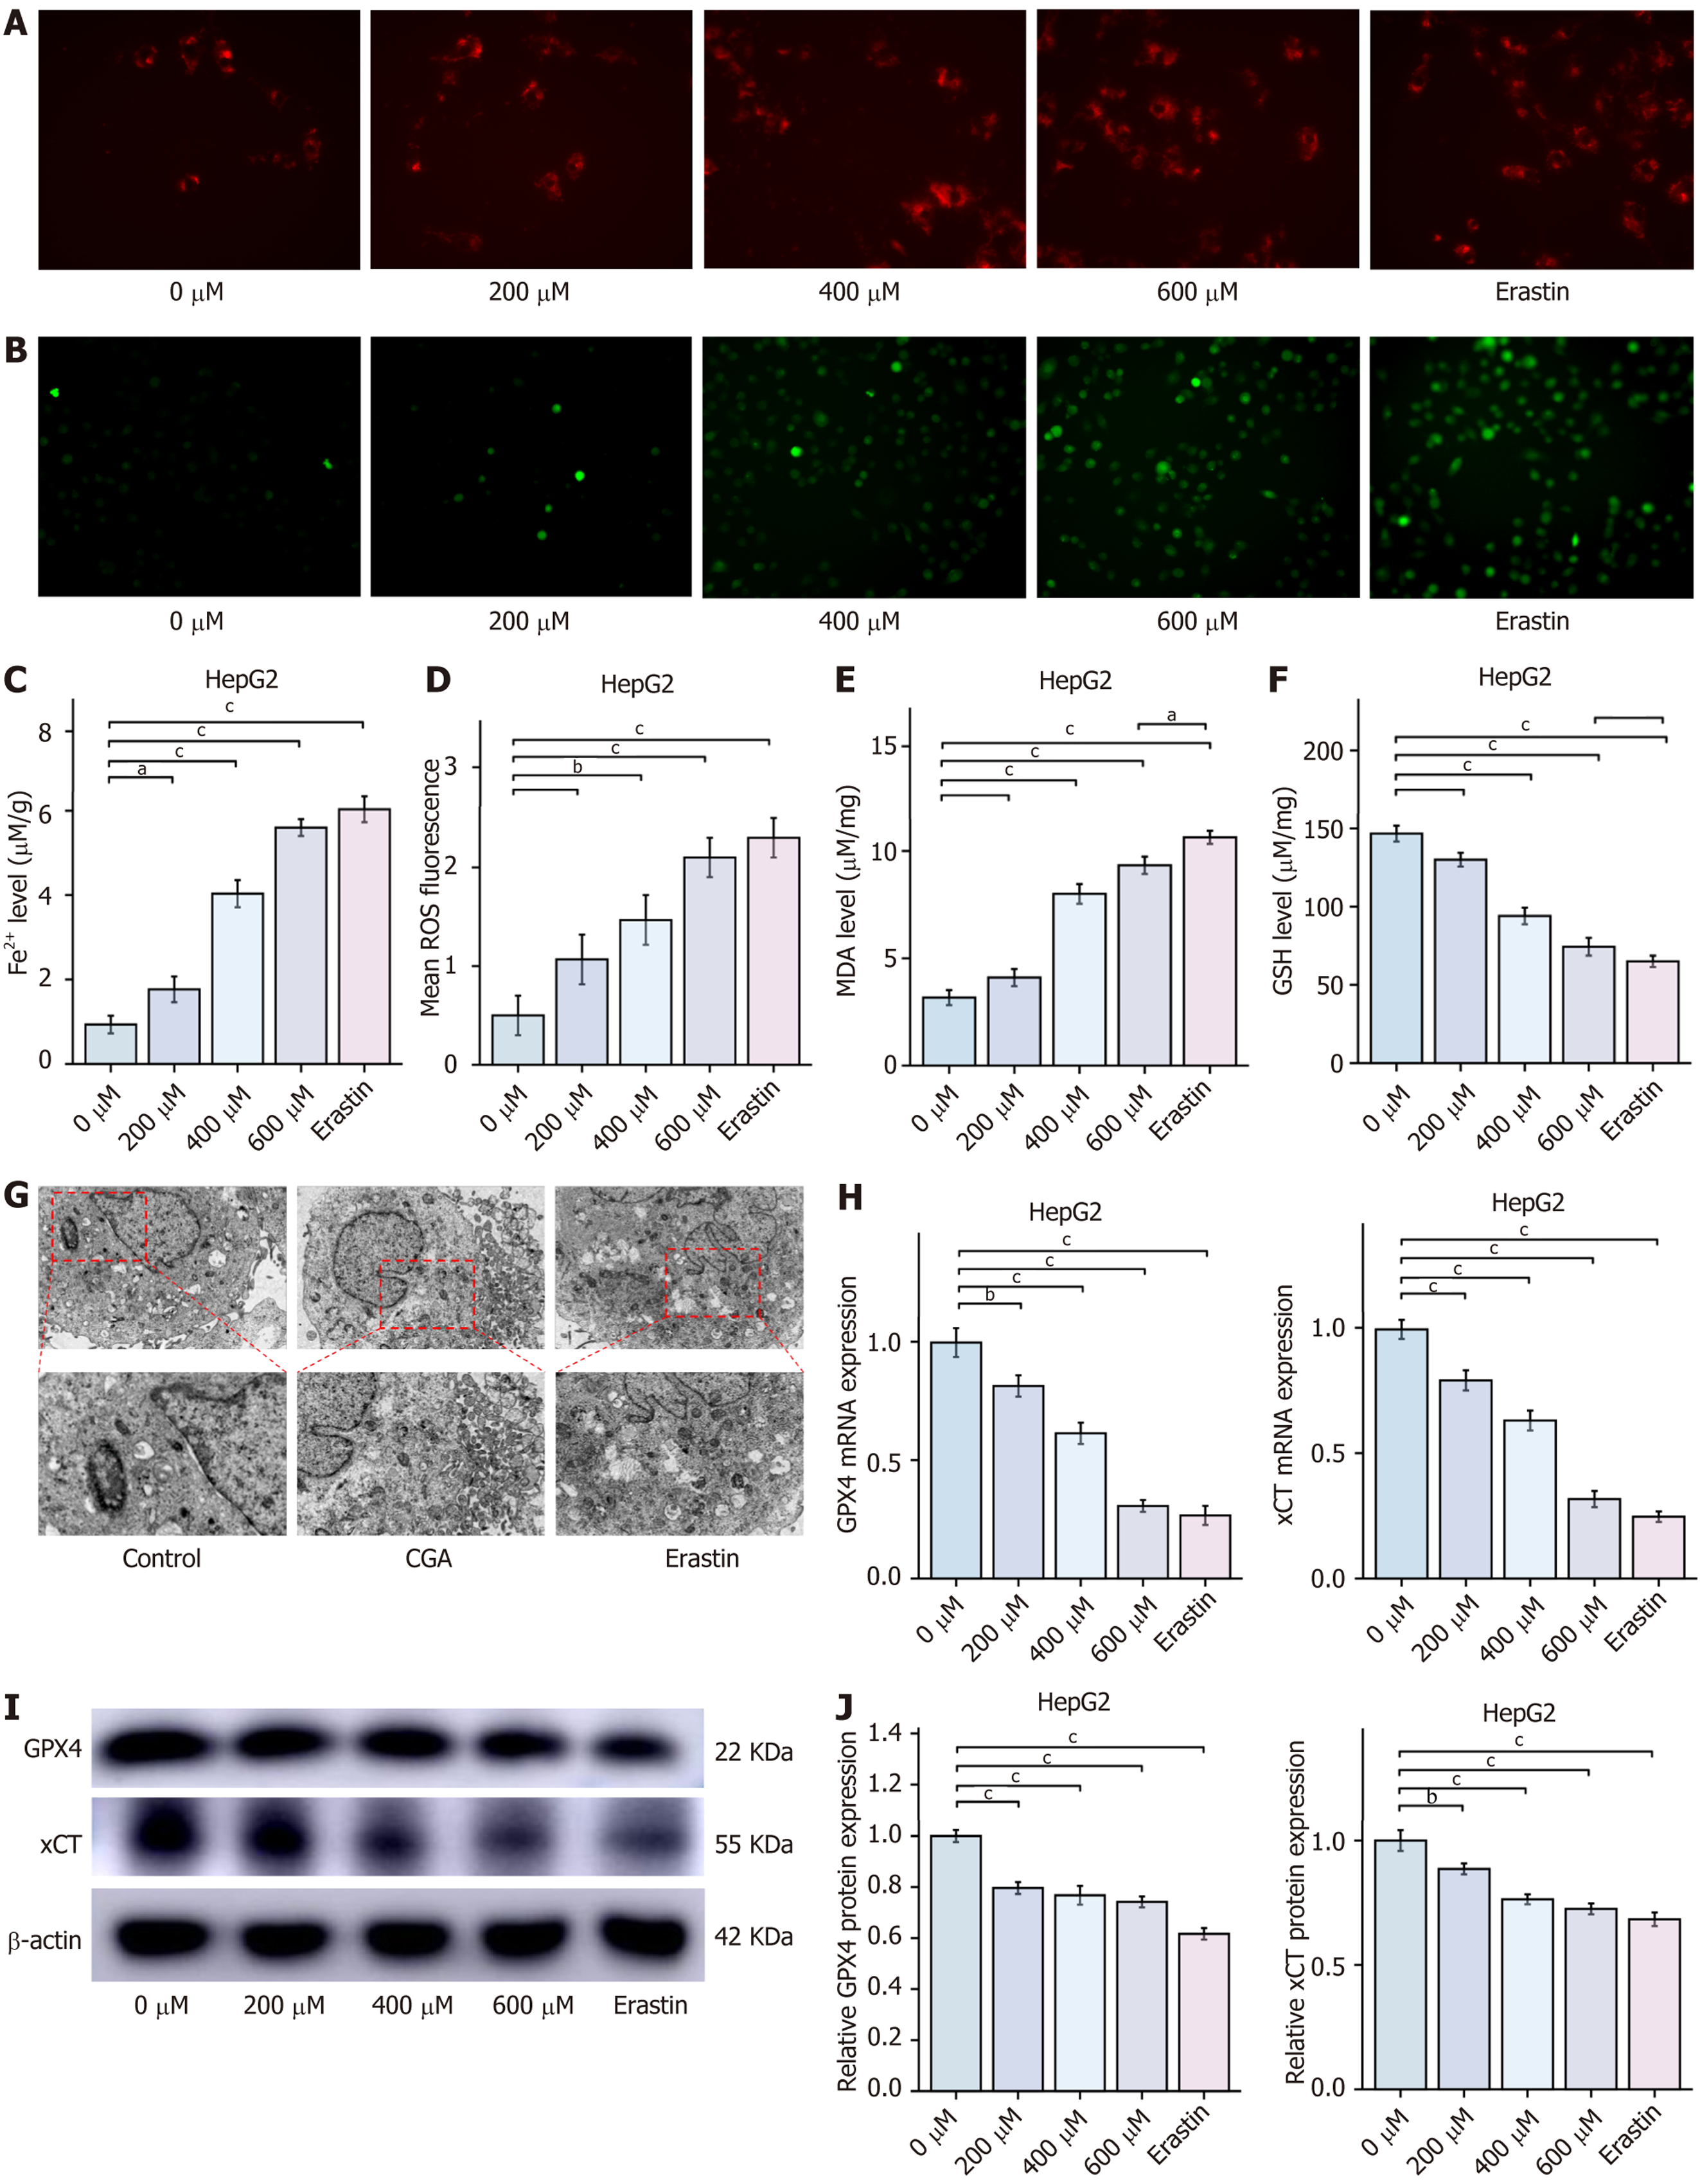
Figure 6 Chlorogenic acid induces ferroptosis in HepG2 cells (mean ± SD, n = 3).
A: Intracellular Fe2+levels; B: Intracellular reactive oxygen species levels detected by BODIPY 581/591 C11 lipid peroxidation probe; C: Statistics of intracellular Fe2+levels; D: Statistics of intracellular reactive oxygen species levels; E: Malondialdehyde levels; F: Glutathione levels; G: TEM images of mitochondrial ultrastructure; H: Quantitative real-time polymerase chain reaction analysis of cystine glutamate reverse transporter and glutathione peroxidase 4 mRNA expression in HepG2 cells; I and J: Western blot analysis of cystine glutamate reverse transporter and glutathione peroxidase 4 protein expression in HepG2 cells. aP < 0.05, bP < 0.01, and cP < 0.001 compared to the 0 μmol chlorogenic acid group. ROS: Reactive oxygen species; MDA: Malondialdehyde; GSH: Glutathione; CGA: Chlorogenic acid; GPX4: Glutathione peroxidase 4; xCT: Cystine glutamate reverse transporter.
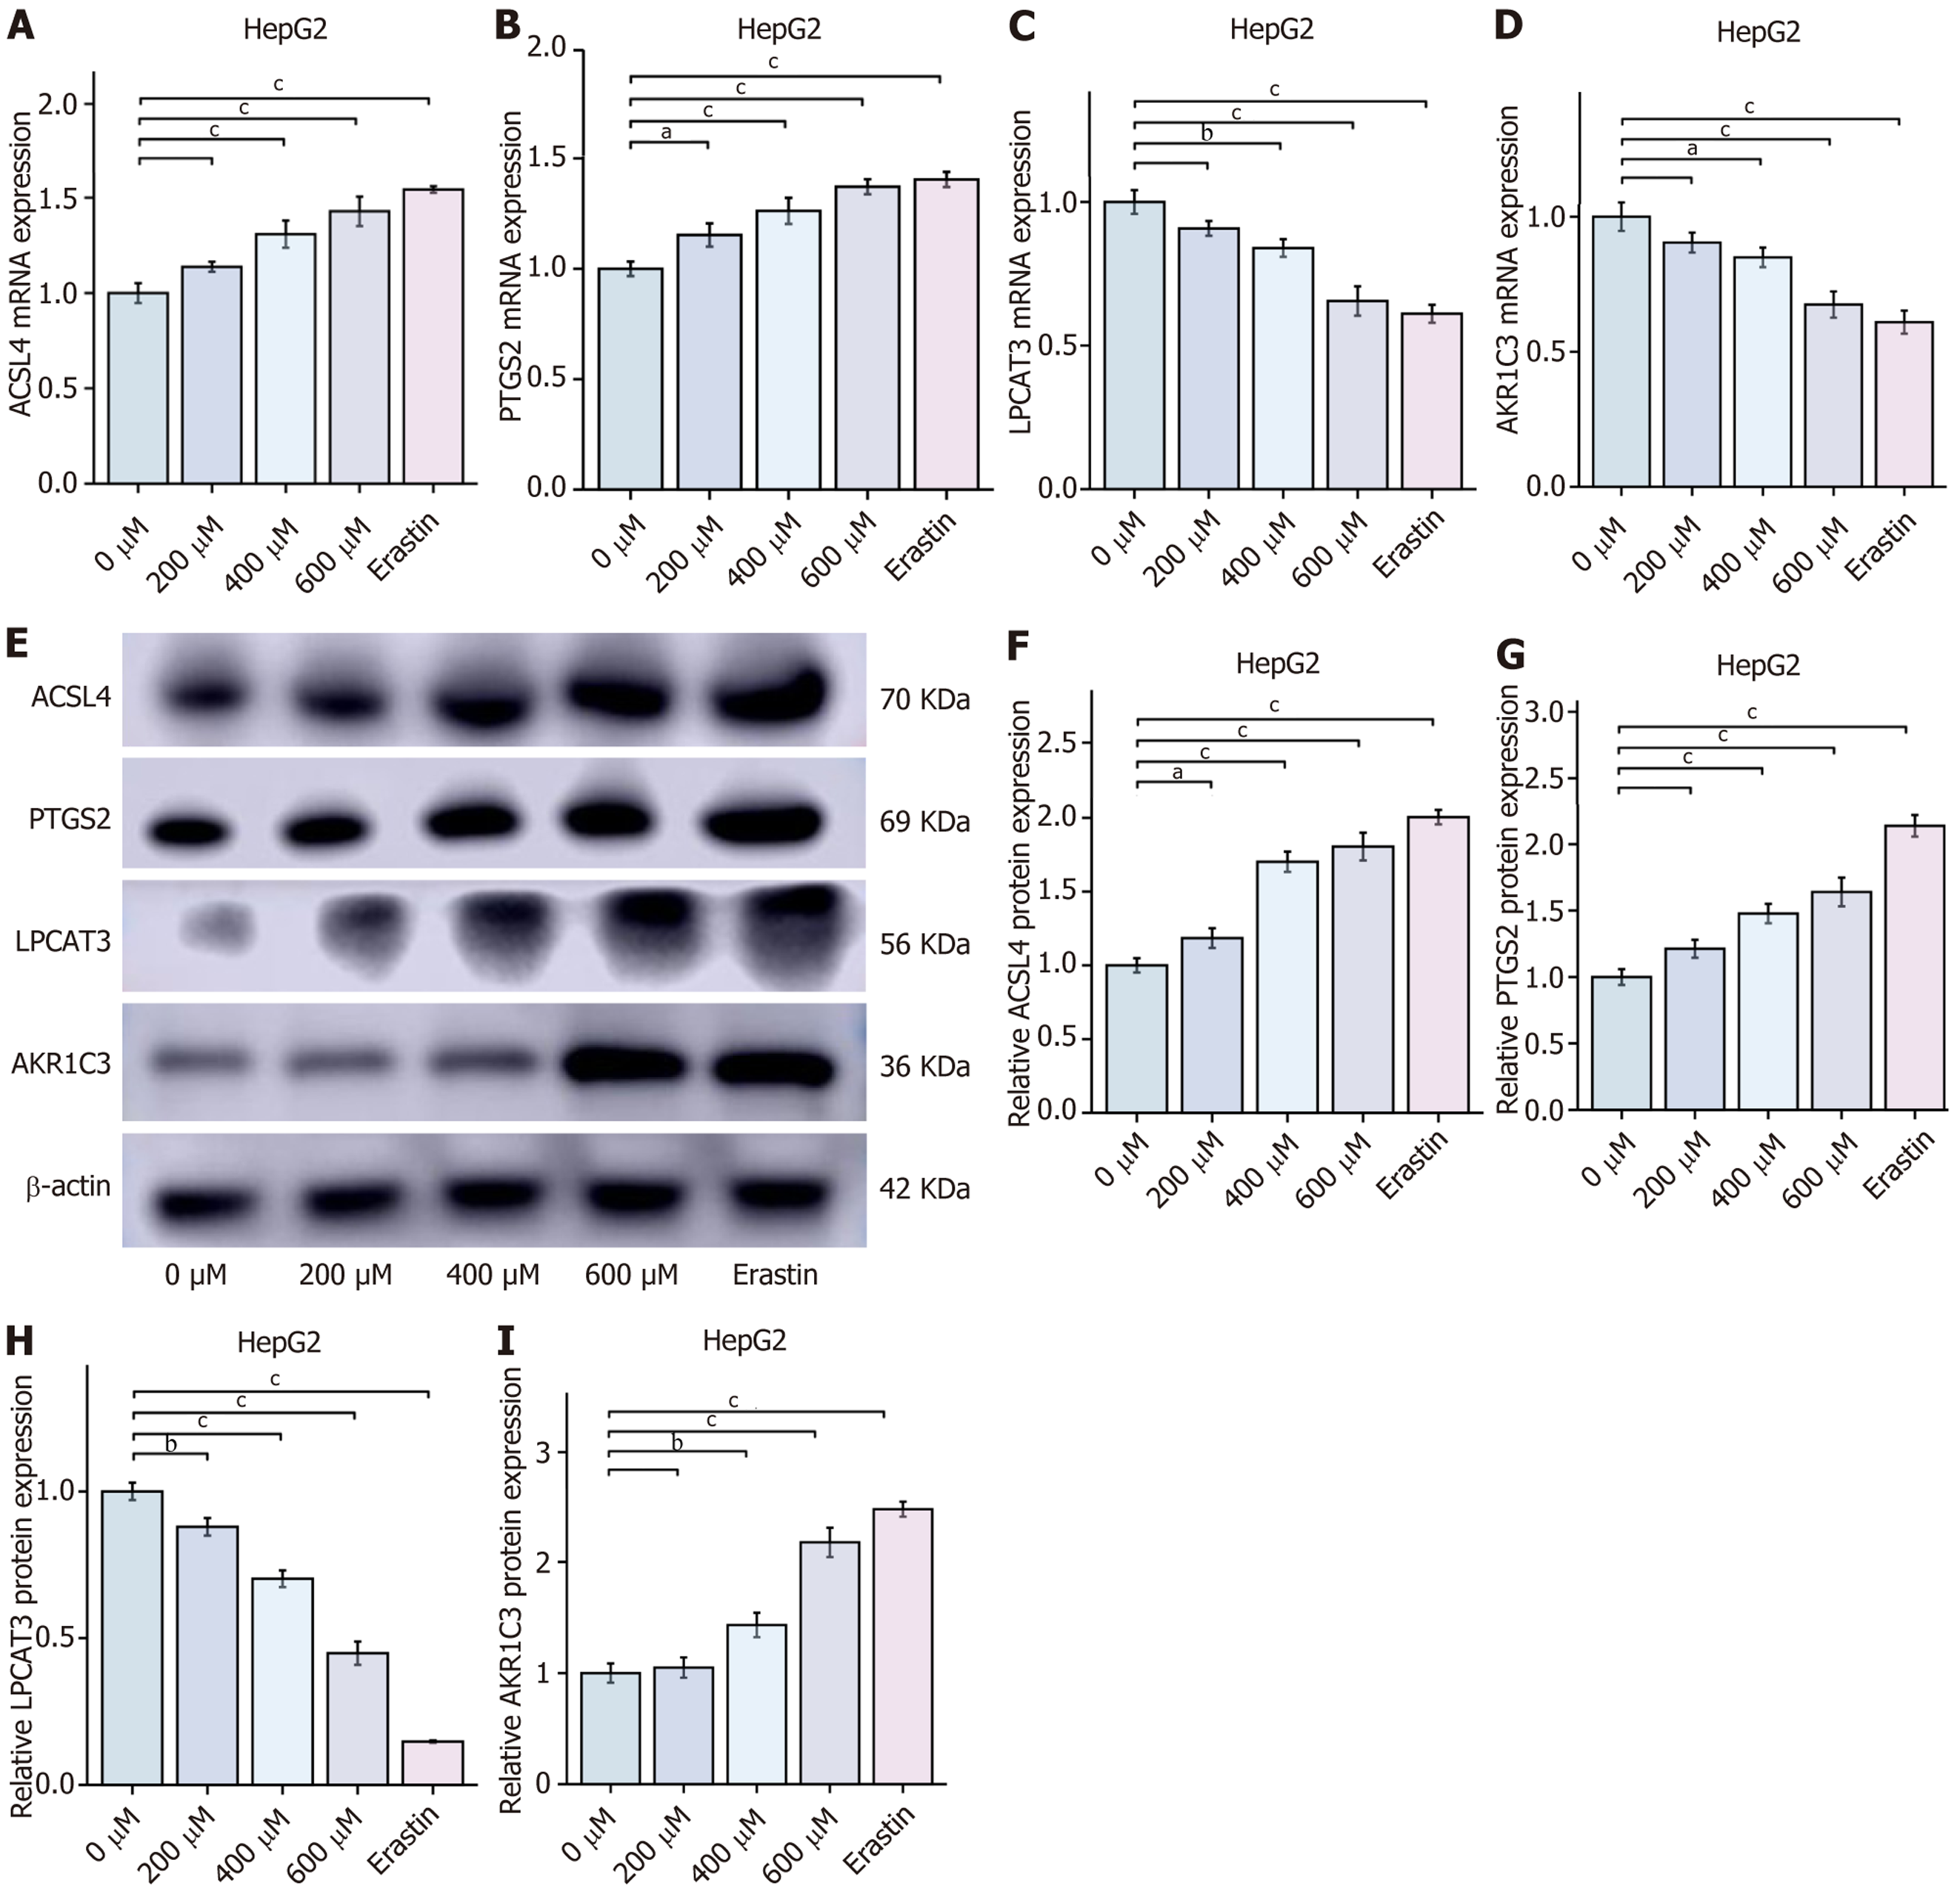
Figure 7 The mRNA and protein expression in chlorogenic acid-mediated reprogramming of arachidonic acid metabolism through prostaglandin endoperoxide synthase 2/aldo-keto reductase family 1 member C3/glutathione peroxidase 4 pathway induces ferroptosis in hepatocellular carcinoma cells (mean ± SD, n = 3).
A-D: Quantitative real-time polymerase chain reaction analysis of aldo-keto reductase family 1 member C3, prostaglandin endoperoxide synthase 2, acyl-coenzyme A synthetase long chain 4, and lysophosphatidylcholine acyltransferase 3 mRNA expression in HCC cells; E-I: Western blot analysis of aldo-keto reductase family 1 member C3, prostaglandin endoperoxide synthase 2, acyl-coenzyme A synthetase long chain 4, and lysophosphatidylcholine acyltransferase 3 protein expression in HepG2 cells. aP < 0.05, bP < 0.01, and cP < 0.001 compared to the 0 μmol chlorogenic acid group. ASCL4: Acyl-coenzyme A synthetase long chain 4; PTGS2: Prostaglandin endoperoxide synthase 2; LPCAT3: Lysophosphatidylcholine acyltransferase 3; AKR1C3: Aldo-keto reductase family 1 member C3.
- Citation: Wu L, Chen HY, Zhang JT, Yang RY, Wang ZB, Xue PS, Peng W, Li KX, Gao WH, Zeng PH. Chlorogenic acid induces hepatocellular carcinoma cell ferroptosis via PTGS2/AKR1C3/GPX4 axis-mediated reprogramming of arachidonic acid metabolism. World J Gastrointest Oncol 2025; 17(3): 98844
- URL: https://www.wjgnet.com/1948-5204/full/v17/i3/98844.htm
- DOI: https://dx.doi.org/10.4251/wjgo.v17.i3.98844


