Copyright
©The Author(s) 2025.
World J Gastrointest Oncol. Mar 15, 2025; 17(3): 103450
Published online Mar 15, 2025. doi: 10.4251/wjgo.v17.i3.103450
Published online Mar 15, 2025. doi: 10.4251/wjgo.v17.i3.103450
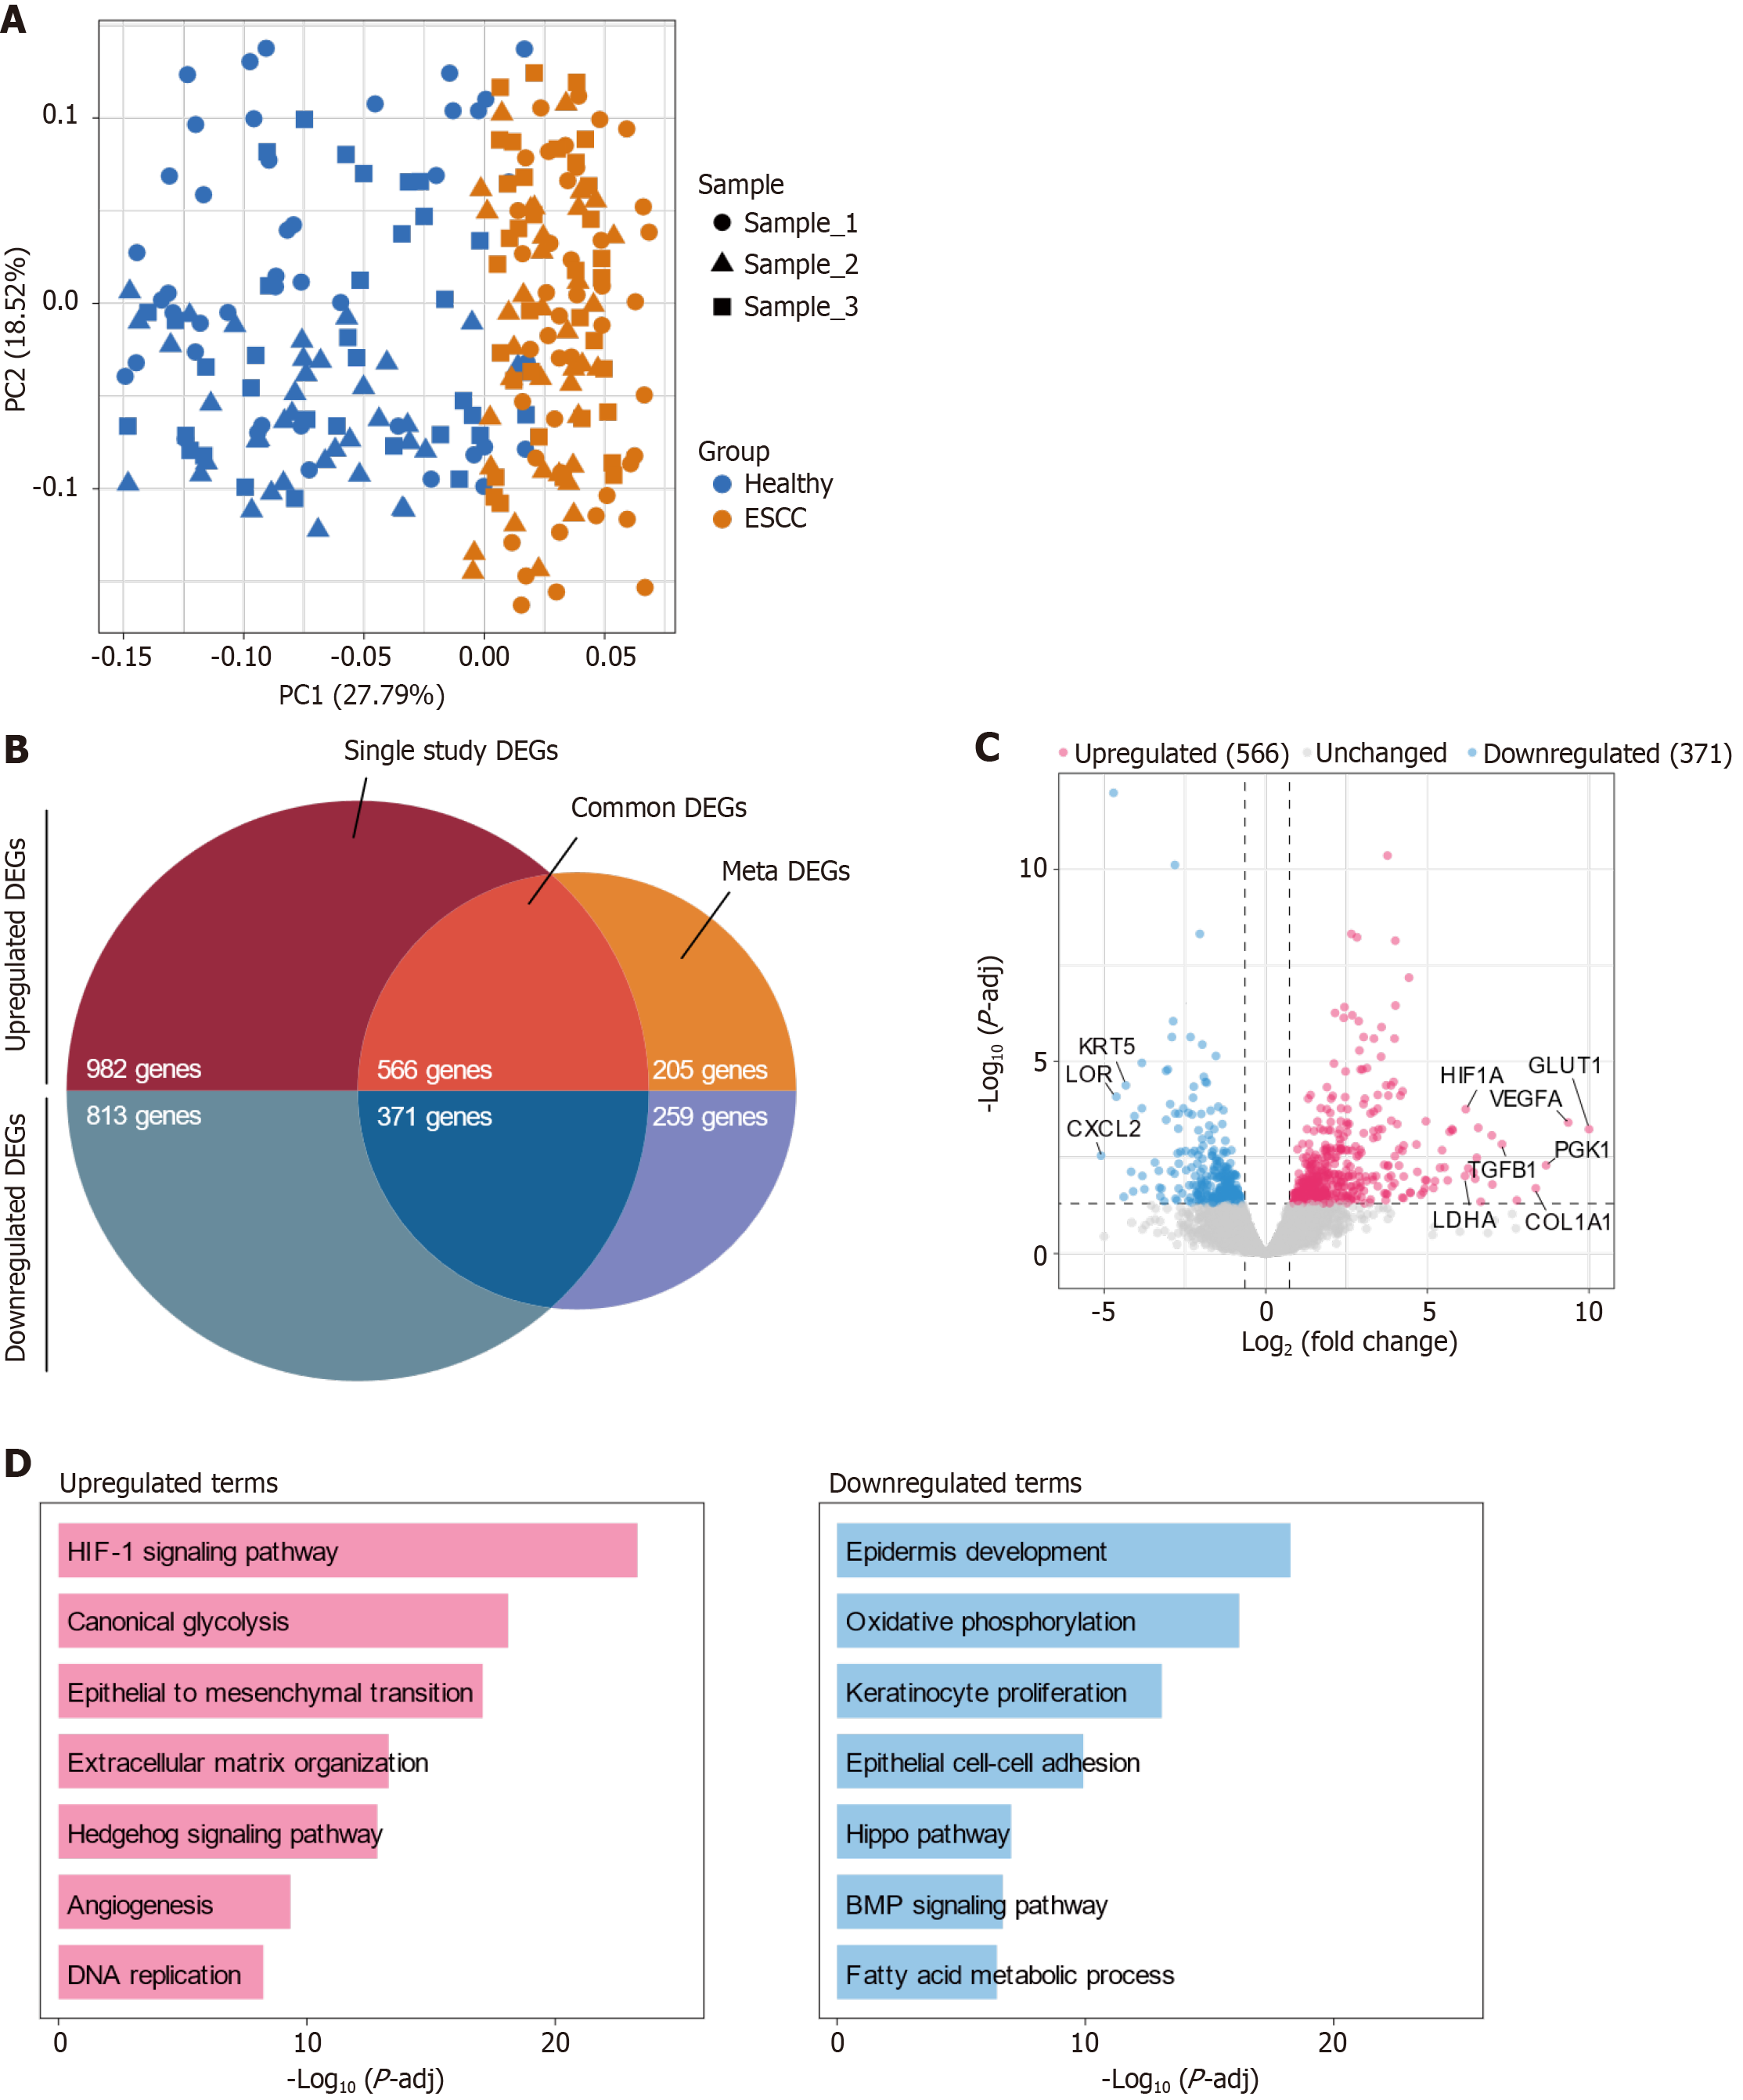
Figure 1 Transcriptomic analysis of esophageal squamous-cell carcinoma reveals significant gene and pathway modulation.
A: Principal component analysis of 115 healthy (blue) and 115 esophageal squamous-cell carcinoma (ESCC) (orange) tissue samples sourced from multiple public databases. Each symbol represents an individual sample, with different shapes (circles, triangles, squares) corresponding to three distinct datasets (Sample_1, Sample_2, Sample_3). The first two principal components (PC1 and PC2) explain 27.79% and 18.52% of the variance, respectively, illustrating a clear separation between healthy and ESCC groups with minimal batch effects; B: Venn diagram of differentially expressed genes (DEGs) shows the overlap of DEGs identified in single-study analyses (red) and meta-analyses (blue), with 566 genes consistently upregulated and 371 genes consistently downregulated across analyses, indicating their potential roles in ESCC pathogenesis; C: Volcano plot of DEGs displaying upregulated (red dots), unchanged (gray dots), and downregulated (blue dots) genes based on log2(fold change) and -log10(p-adjusted value). Significant genes such as GLUT1, PGK1, VEGFA, COL1A1, and TGFB1 are marked for their substantial upregulation, while notable downregulated genes include KRT5, LOR, and CXCL2, highlighting shifts in cellular function relevant to cancer progression; D: Bar graphs depicting enriched biological pathways based on gene ontology analysis. Upregulated pathways (pink bars) include HIF-1 signaling, glycolysis, and epithelial to mesenchymal transition, indicating adaptations in cellular energy metabolism and invasiveness. Downregulated pathways (blue bars) such as epidermis development and oxidative phosphorylation suggest significant deviations from normal epithelial functions and metabolic processes. DEG: Differentially expressed gene.
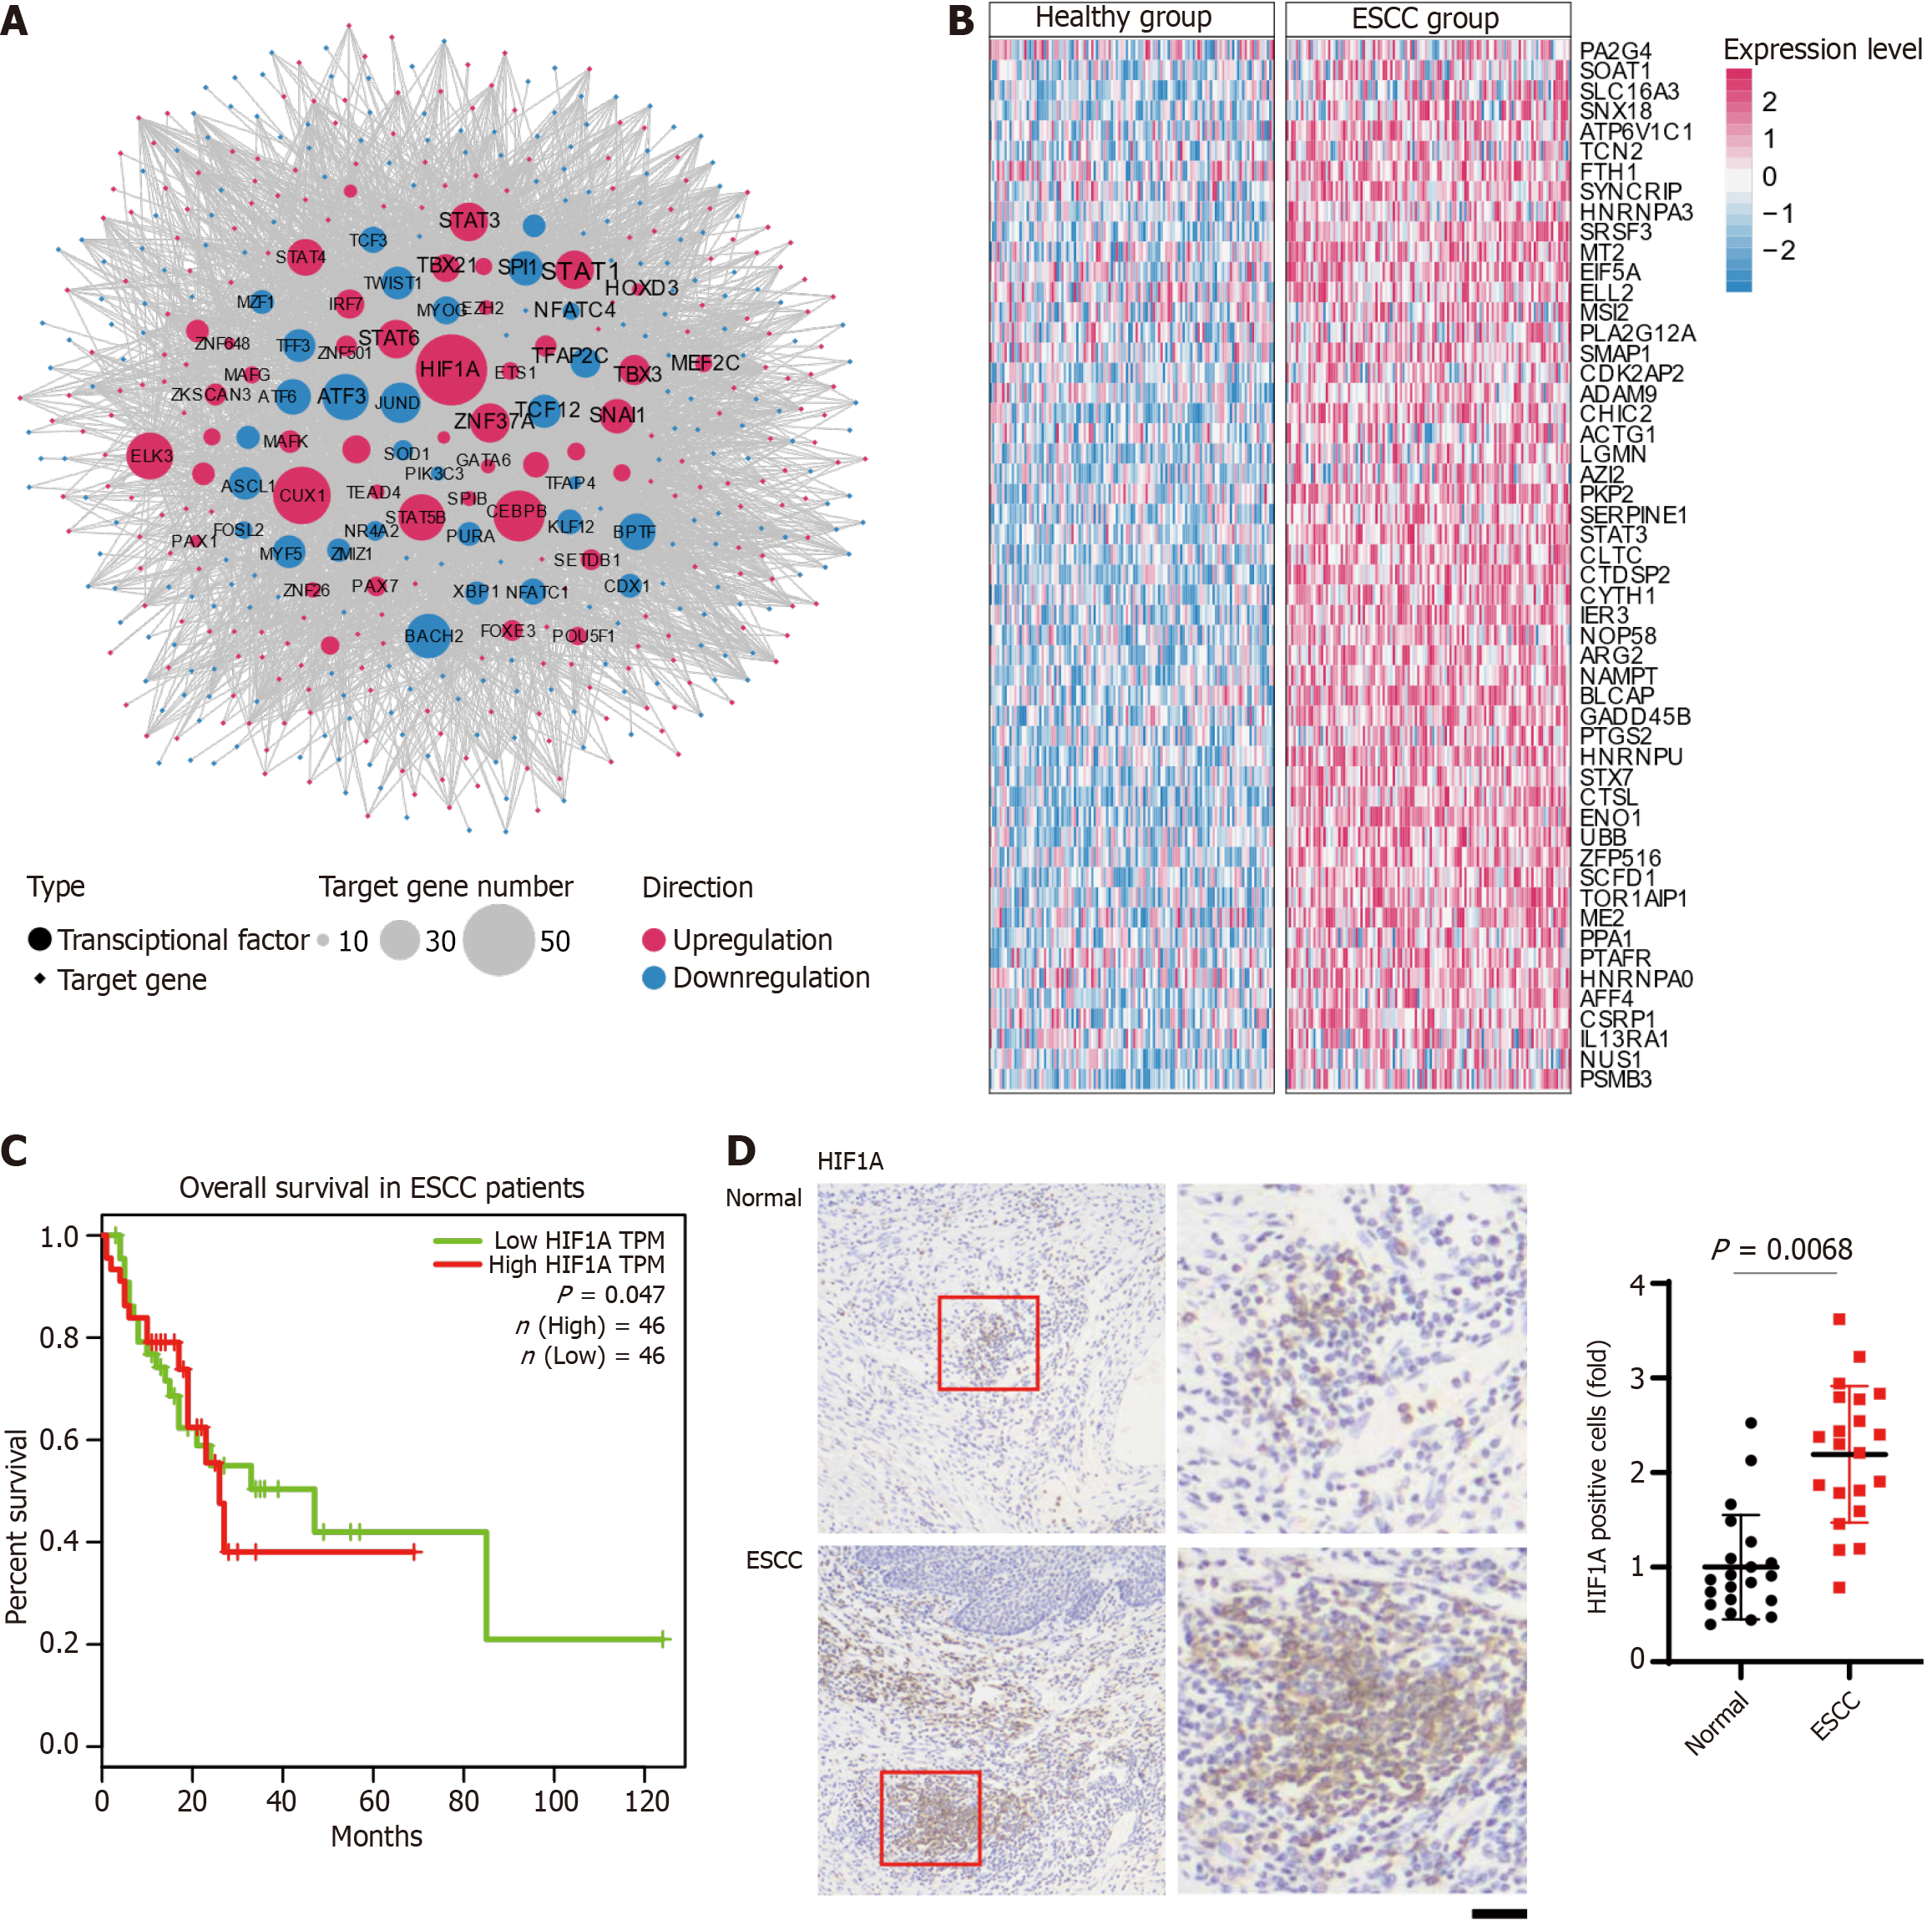
Figure 2 Analysis of transcription factor regulatory networks and gene expression patterns in esophageal squamous-cell carcinoma.
A: Network diagram illustrating the transcription factor (TFs) regulatory landscape in esophageal squamous-cell carcinoma (ESCC). Circular nodes represent TFs, while diamond-shaped nodes represent their target genes. The network includes 31 upregulated TFs (red circular nodes) and 43 downregulated TFs (blue circular nodes). The size of each circular node reflects the number of target genes regulated, with larger nodes indicating a greater number of downstream targets. Similarly, target genes (diamond-shaped nodes) are color-coded to indicate expression changes, with red representing upregulation and blue representing downregulation. Edges indicate regulatory interactions between TFs and their target genes, emphasizing the extensive and interconnected regulatory network involved in ESCC progression; B: Heatmap illustrating the expression levels of downstream target genes regulated by hypoxia-inducible factor 1-alpha (HIF1A) in healthy (left panel) and ESCC (right panel) tissue samples. Each row corresponds to an individual target gene, while each column represents a sample. Gene expression levels are normalized and presented as z-scores, with red representing high expression and blue representing low expression. The heatmap demonstrates distinct differences in the expression profiles of HIF1A target genes between the healthy and ESCC groups, underscoring the pivotal role of HIF1A in modulating gene expression during ESCC progression; C: Kaplan-Meier survival curves illustrating the impact of HIF1A expression on overall survival in patients with ESCC. Patients are grouped into high HIF1A transcript per million (TPM) (red line) and low HIF1A TPM (green line). The survival probability is plotted over a period of 120 months; D: Immunohistochemical analysis of HIF1A protein expression in 21 paired ESCC patient tissues. Scale bar = 25um. ESCC: Esophageal squamous-cell carcinoma; HIF1A: Hypoxia-inducible factor 1-alpha.
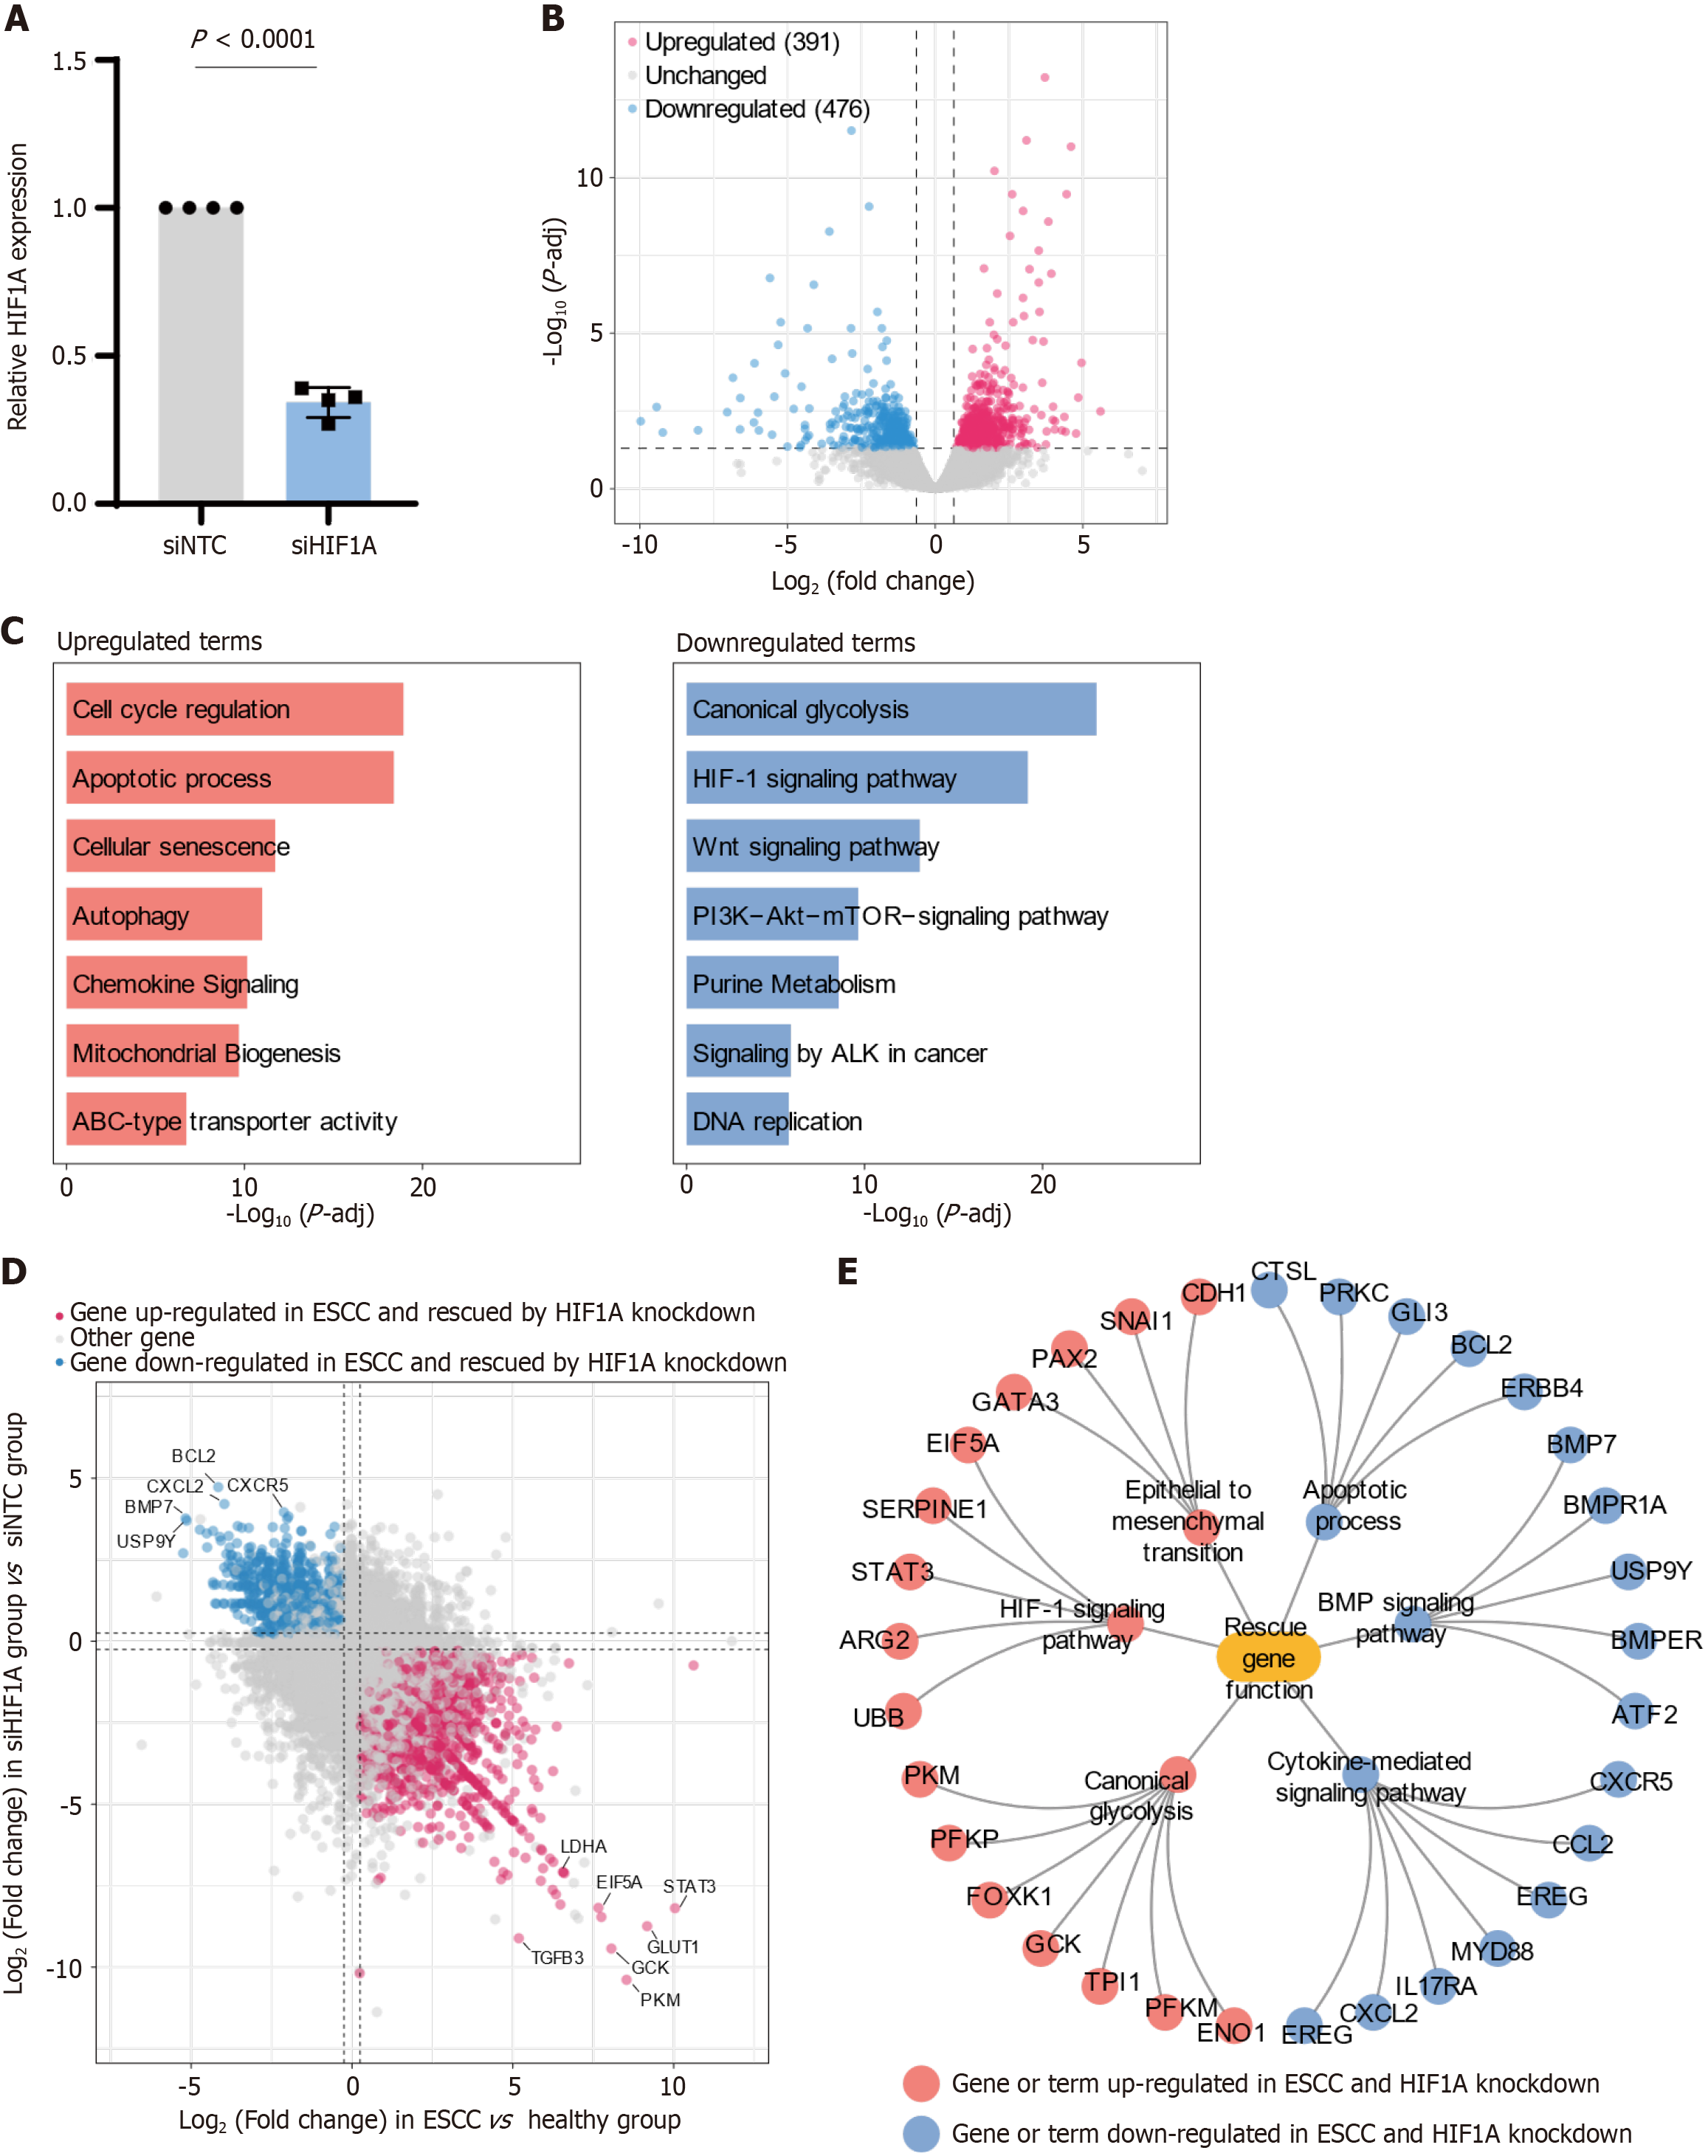
Figure 3 Analysis of hypoxia-inducible factor 1-alpha knockdown effects on gene expression and pathway modulation in esophageal squamous-cell carcinoma.
A: The relative mRNA expression levels of hypoxia-inducible factor 1-alpha (HIF1A) in esophageal squamous-cell carcinoma (ESCC) cells treated with non-targeting control siRNA (siNTC) and HIF1A-targeting siRNA (siHIF1A); B: Volcano plot illustrating differential gene expression in ESCC cells following HIF1A knockdown. The plot identifies 391 upregulated genes (red dots) and 476 downregulated genes (blue dots), while unchanged genes are shown in gray. The plot highlights the extensive impact of HIF1A knockdown on the cellular transcriptome; C: Bar graphs showing enriched biological pathways among genes differentially expressed after HIF1A knockdown. The top upregulated pathways include cell cycle regulation, apoptotic processes, and cellular senescence, suggesting a shift towards reduced proliferation and enhanced cell death. Conversely, the most significant downregulated pathways are canonical glycolysis, HIF-1 signaling, and Wnt signaling, indicating a decrease in metabolic adaptation and signaling processes critical for tumor progression; D: Scatter plot comparing gene expression changes in ESCC vs healthy tissues (x-axis) with those in siHIF1A vs siNTC cells (y-axis). Genes upregulated in ESCC and downregulated after HIF1A knockdown (red) and genes downregulated in ESCC and upregulated after knockdown (blue) are highlighted, indicating "rescue" of these genes by HIF1A inhibition; E: Network diagram representing the functional implications of genes rescued by HIF1A knockdown. The diagram includes key pathways and processes such as epithelial to mesenchymal transition, apoptotic processes, and Bone Morphogenetic Protein signaling, with connections indicating how the suppression of HIF1A influences these pathways, potentially reversing key aspects of tumor metastasis and progression. Nodes represent genes or terms that were upregulated (red) or downregulated (blue) in ESCC and reversed by HIF1A knockdown.
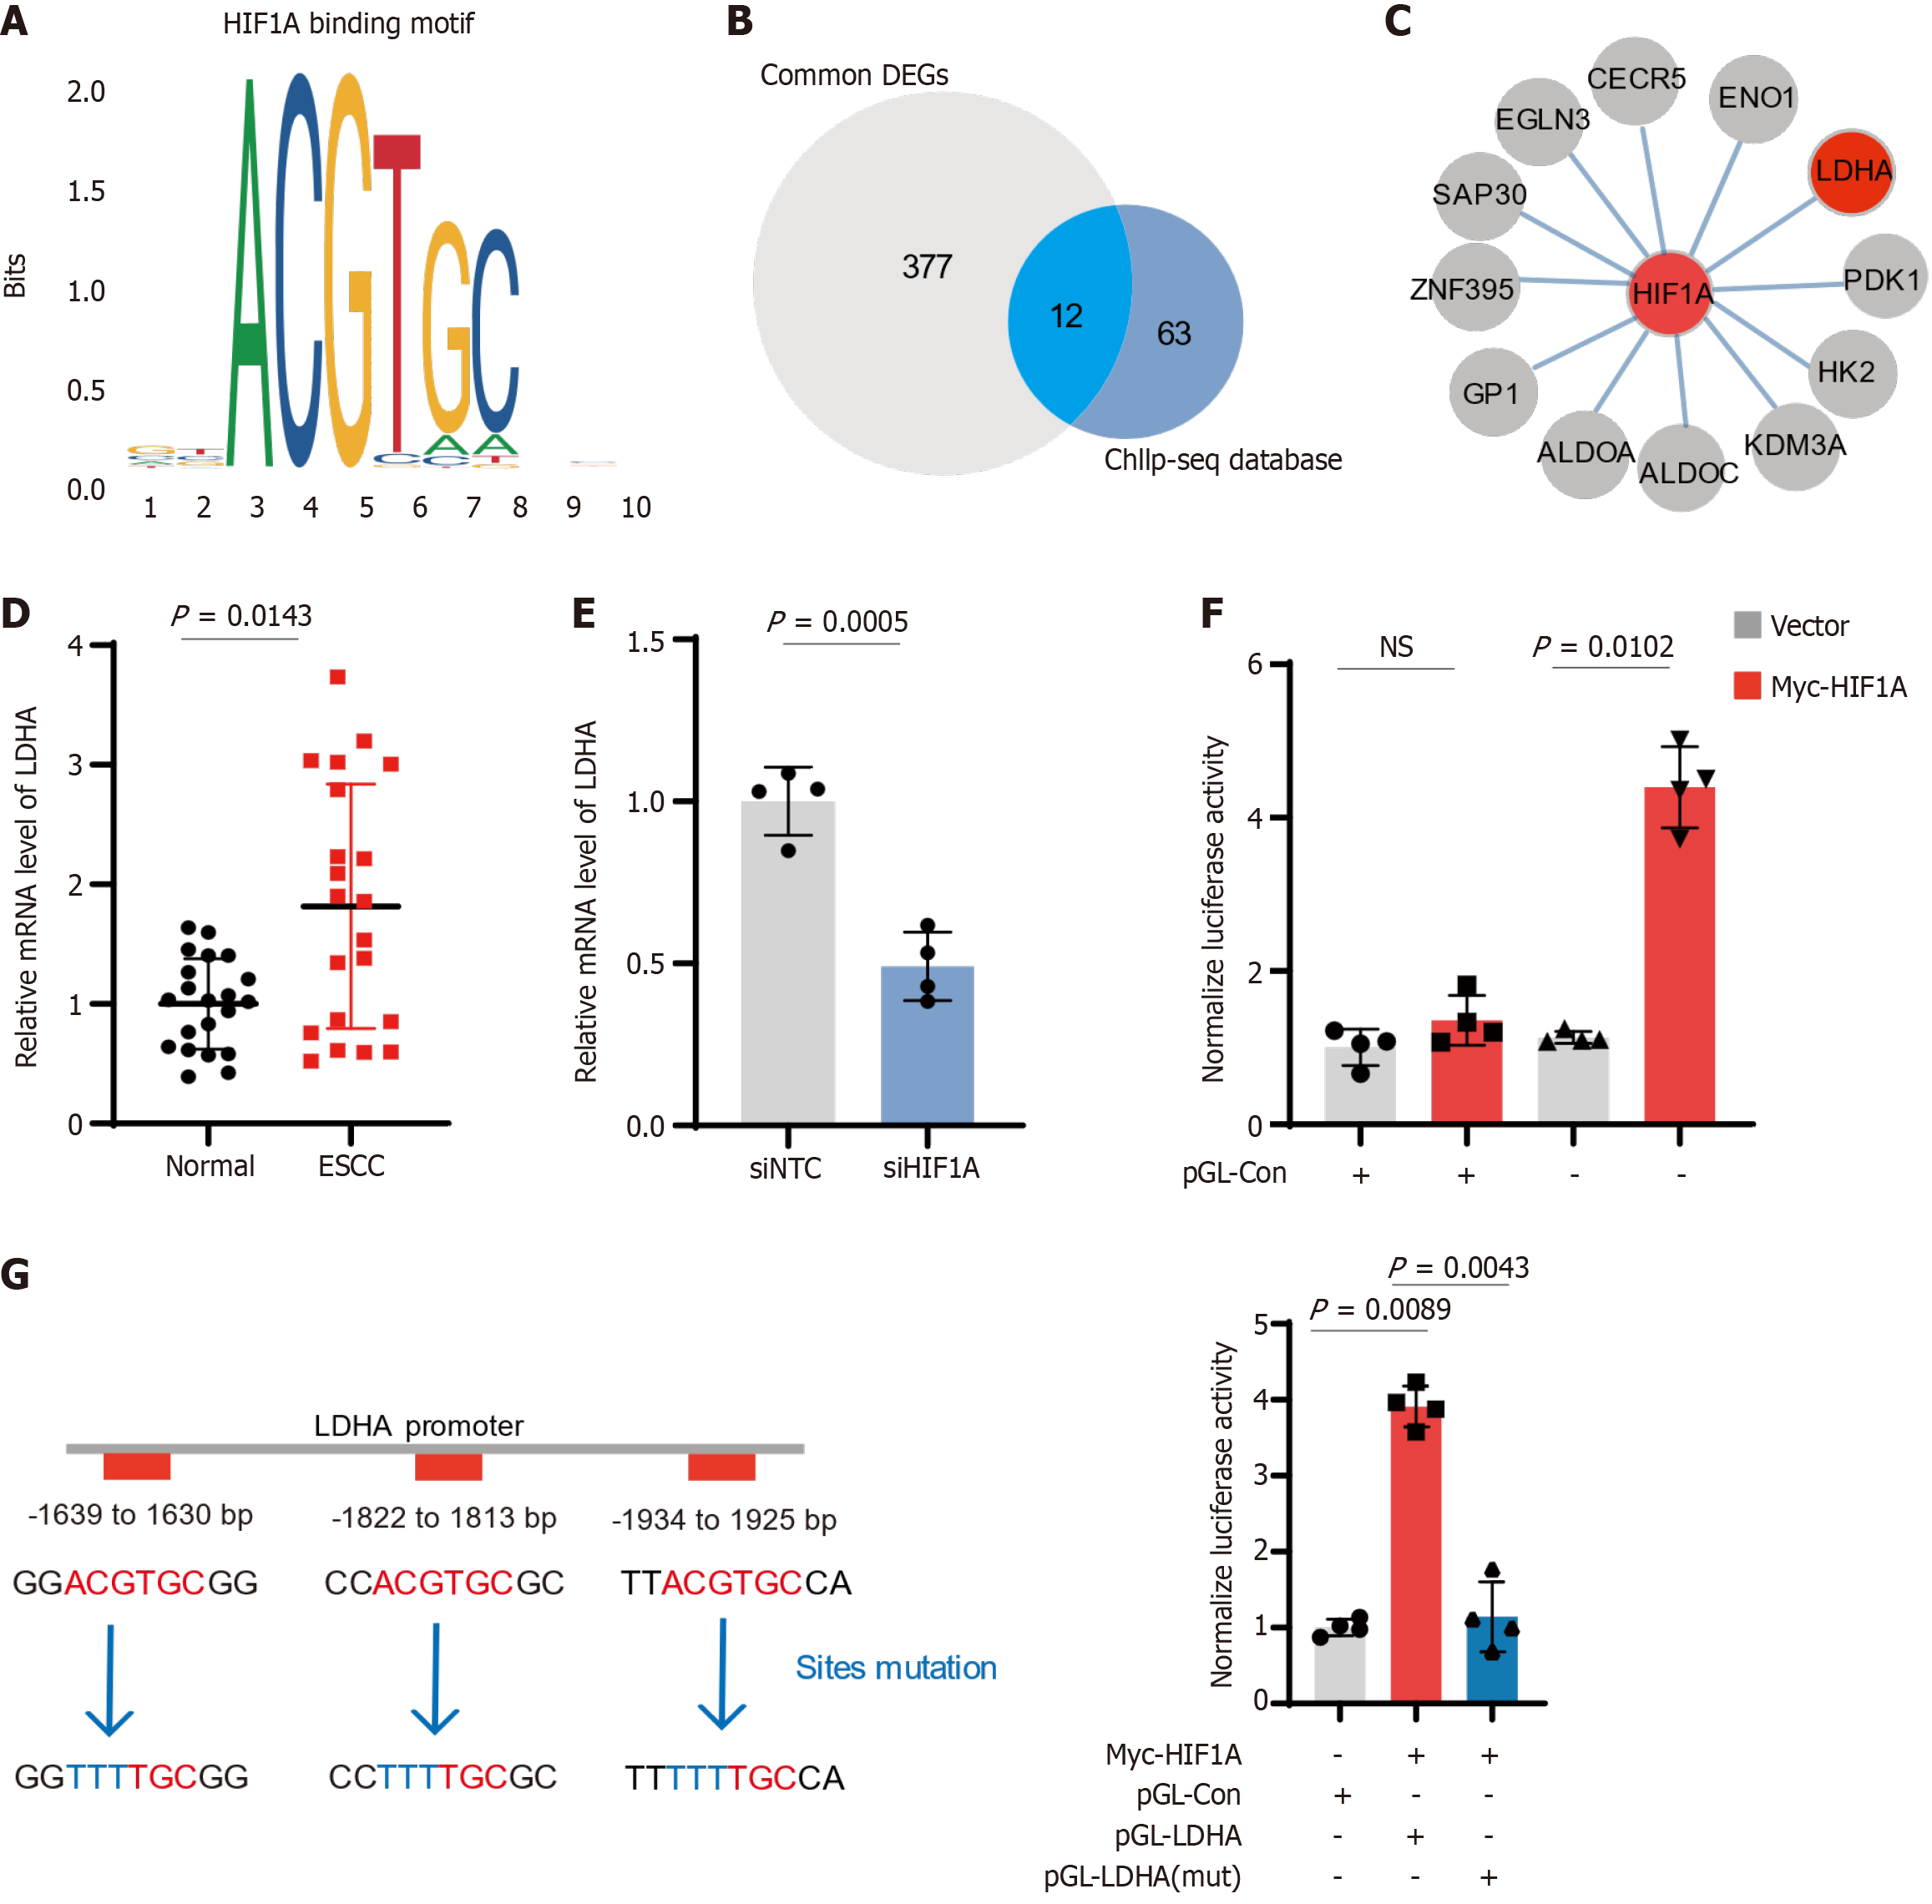
Figure 4 Hypoxia-inducible factor 1-alpha-mediated regulation of lactate dehydrogenase A expression in esophageal squamous-cell carcinoma.
A: Representation predicted binding motif of hypoxia-inducible factor 1-alpha (HIF1A); B: Venn diagram showing overlap between differentially expressed genes (DEGs) in esophageal squamous-cell carcinoma (ESCC) and genes identified in the ChIP-seq database for HIF1A binding sites. A total of 12 common genes are highlighted; C: Interaction network of HIF1A with common DEGs and key metabolic enzymes in ESCC; D: Relative mRNA levels of lactate dehydrogenase A (LDHA) in 21 paired ESCC patient tissues; E: LDHA mRNA levels decrease significantly upon HIF1A knockdown in ESCC cells; F: Luciferase assay demonstrating the transcriptional activity of LDHA promoter; G: Analysis of LDHA promoter mutations affecting HIF1A binding. ESCC: Esophageal squamous-cell carcinoma; LDHA: Lactate dehydrogenase A; HIF1A: Hypoxia-inducible factor 1-alpha; siNTC: Non-targeting control siRNA; siHIF1A: HIF1A-targeting siRNA.
- Citation: Chen X, Liu HY, Zhou WB, Zhang LL, Huang J, Bao DW. Hypoxia-inducible factor 1-alpha and lactate dehydrogenase-A axis in metabolic changes and aggression in esophageal squamous-cell carcinoma. World J Gastrointest Oncol 2025; 17(3): 103450
- URL: https://www.wjgnet.com/1948-5204/full/v17/i3/103450.htm
- DOI: https://dx.doi.org/10.4251/wjgo.v17.i3.103450


