Copyright
©The Author(s) 2025.
World J Gastrointest Oncol. Mar 15, 2025; 17(3): 102187
Published online Mar 15, 2025. doi: 10.4251/wjgo.v17.i3.102187
Published online Mar 15, 2025. doi: 10.4251/wjgo.v17.i3.102187
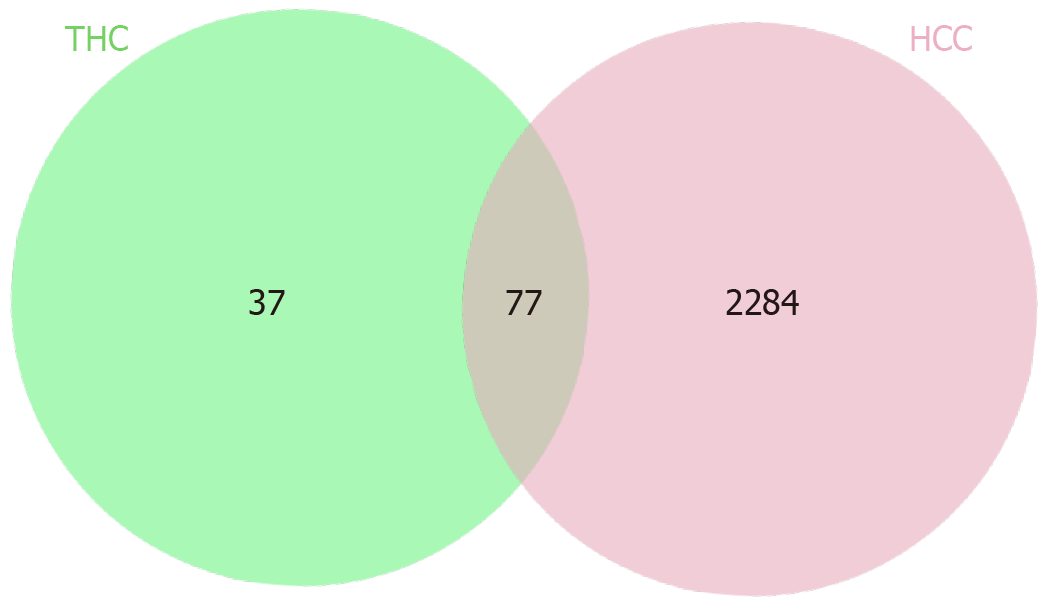
Figure 1 Venn diagram of the drug and disease targets.
THC: Tetrahydrocurcumin; HCC: Hepatocellular carcinoma.
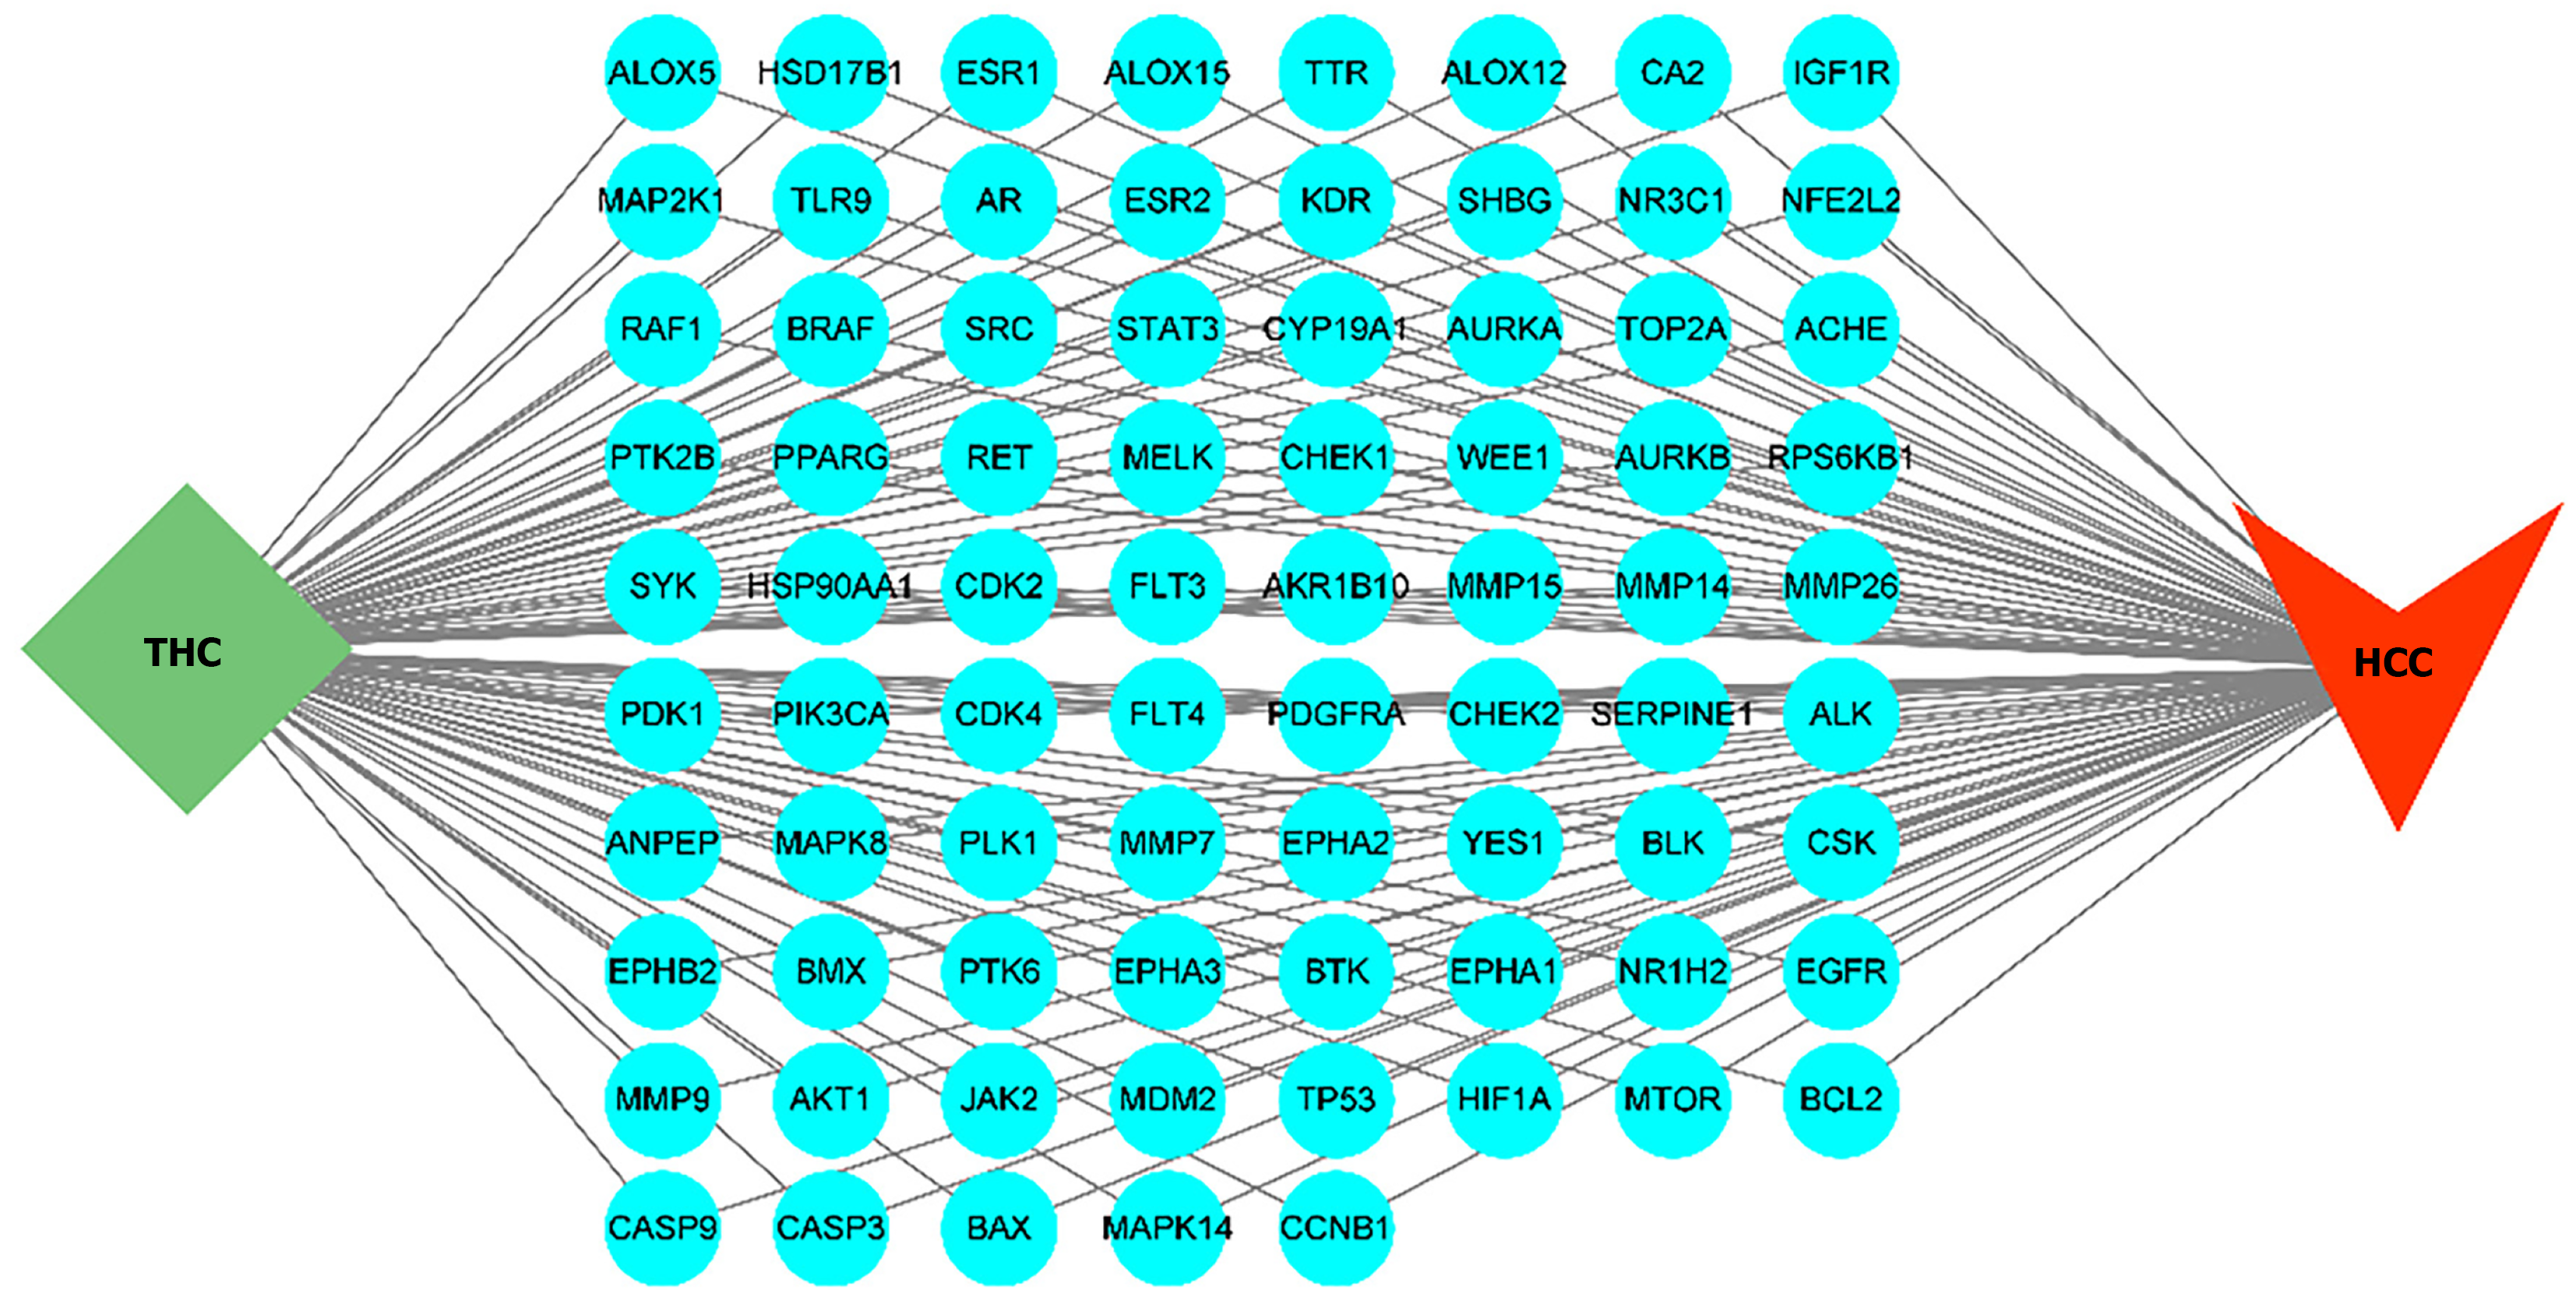
Figure 2 Network relationship diagram of tetrahydrocurcumin targets in hepatocellular carcinoma.
THC: Tetrahydrocurcumin; HCC: Hepatocellular carcinoma.
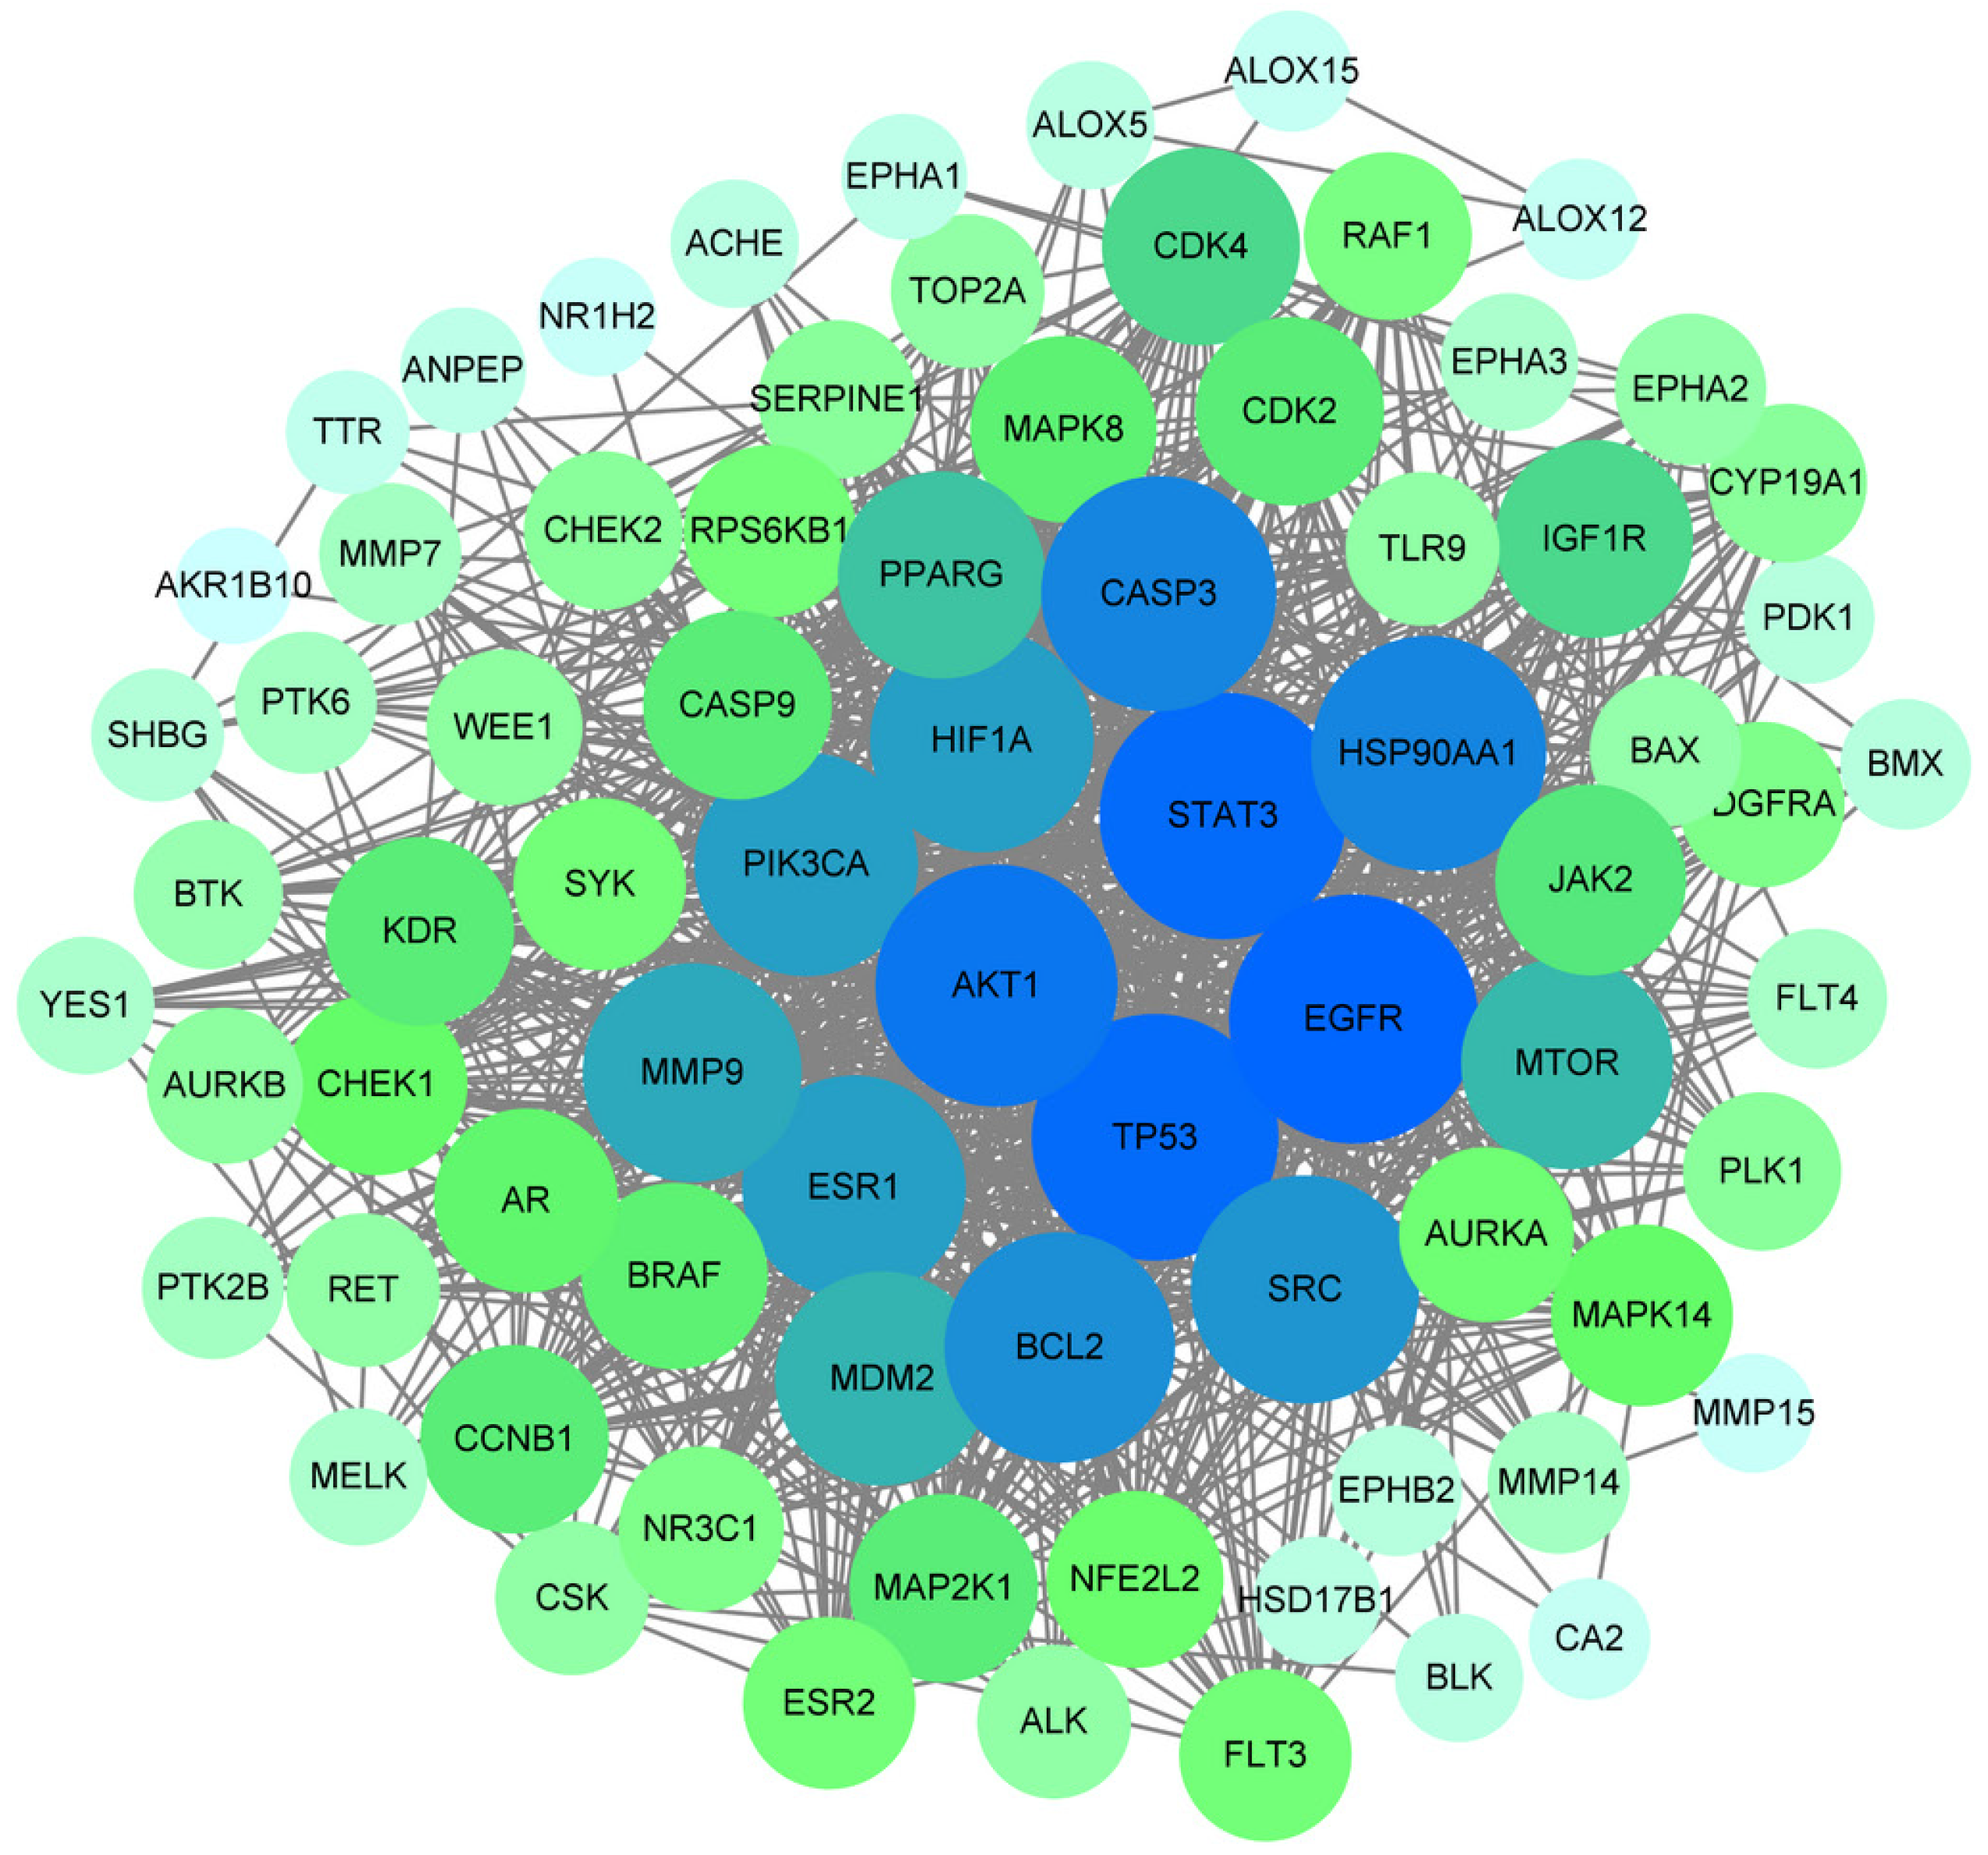
Figure 3
Protein-protein interaction network.
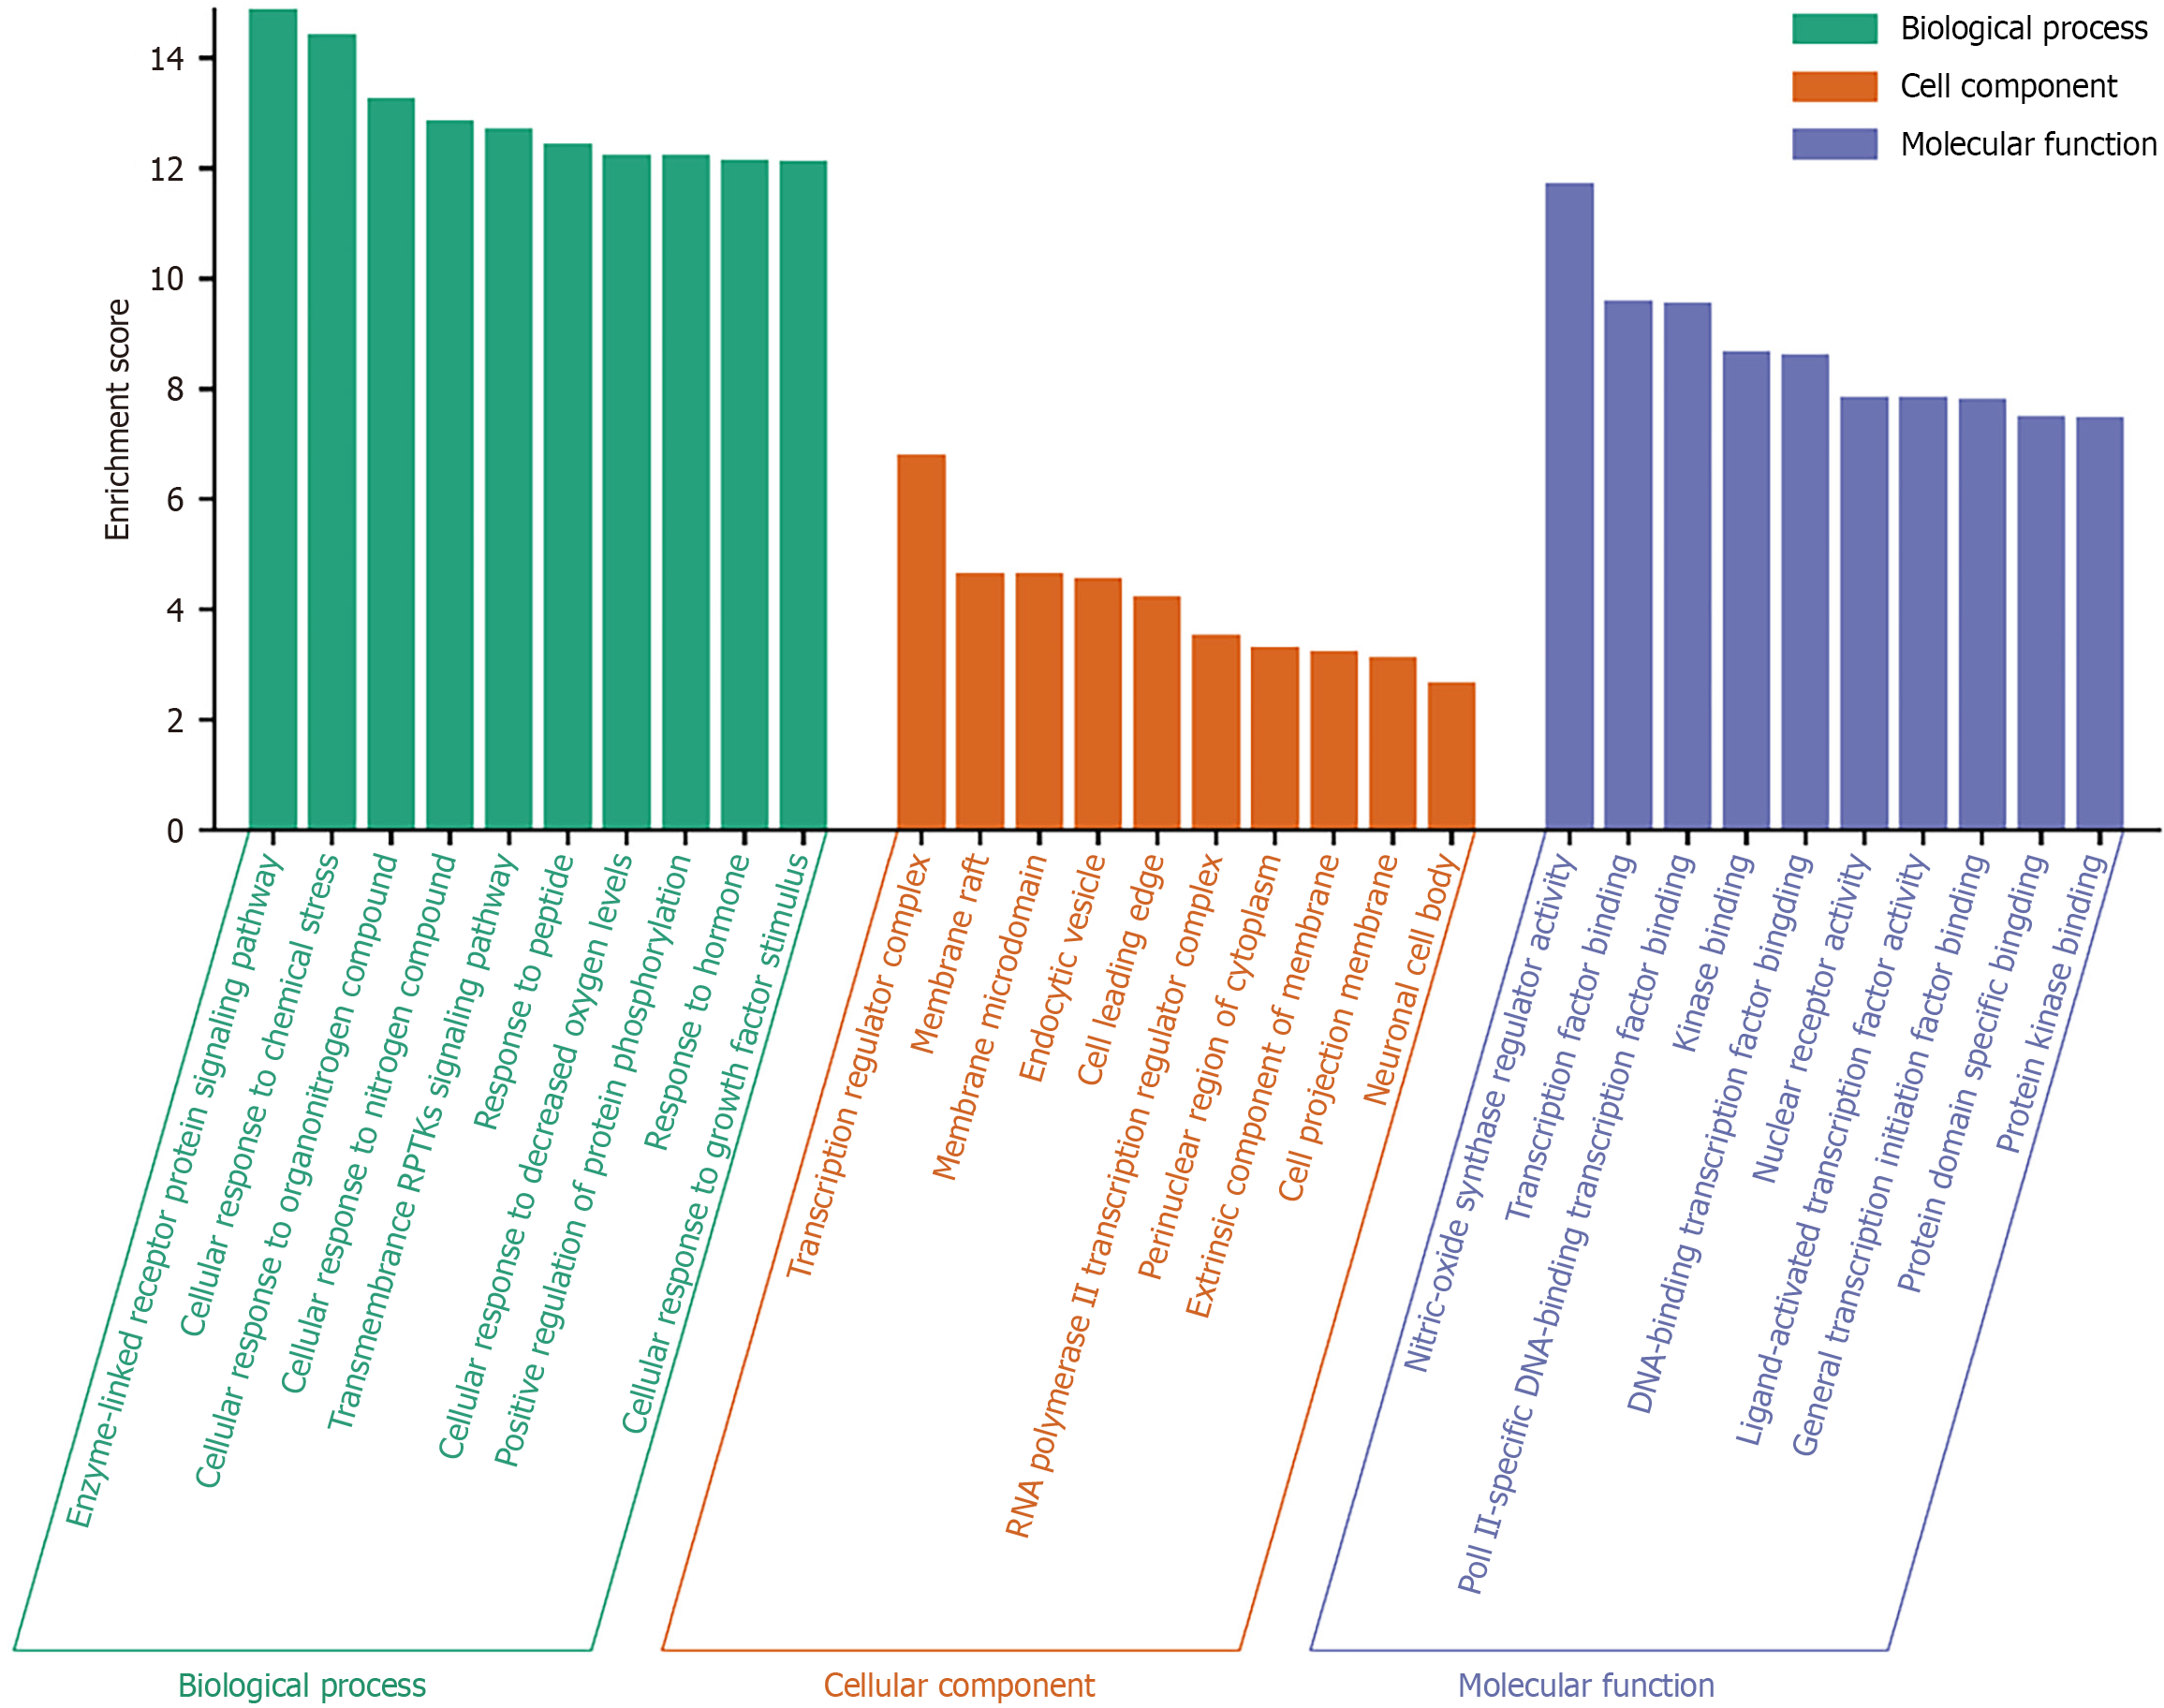
Figure 4
Bar of gene ontology.
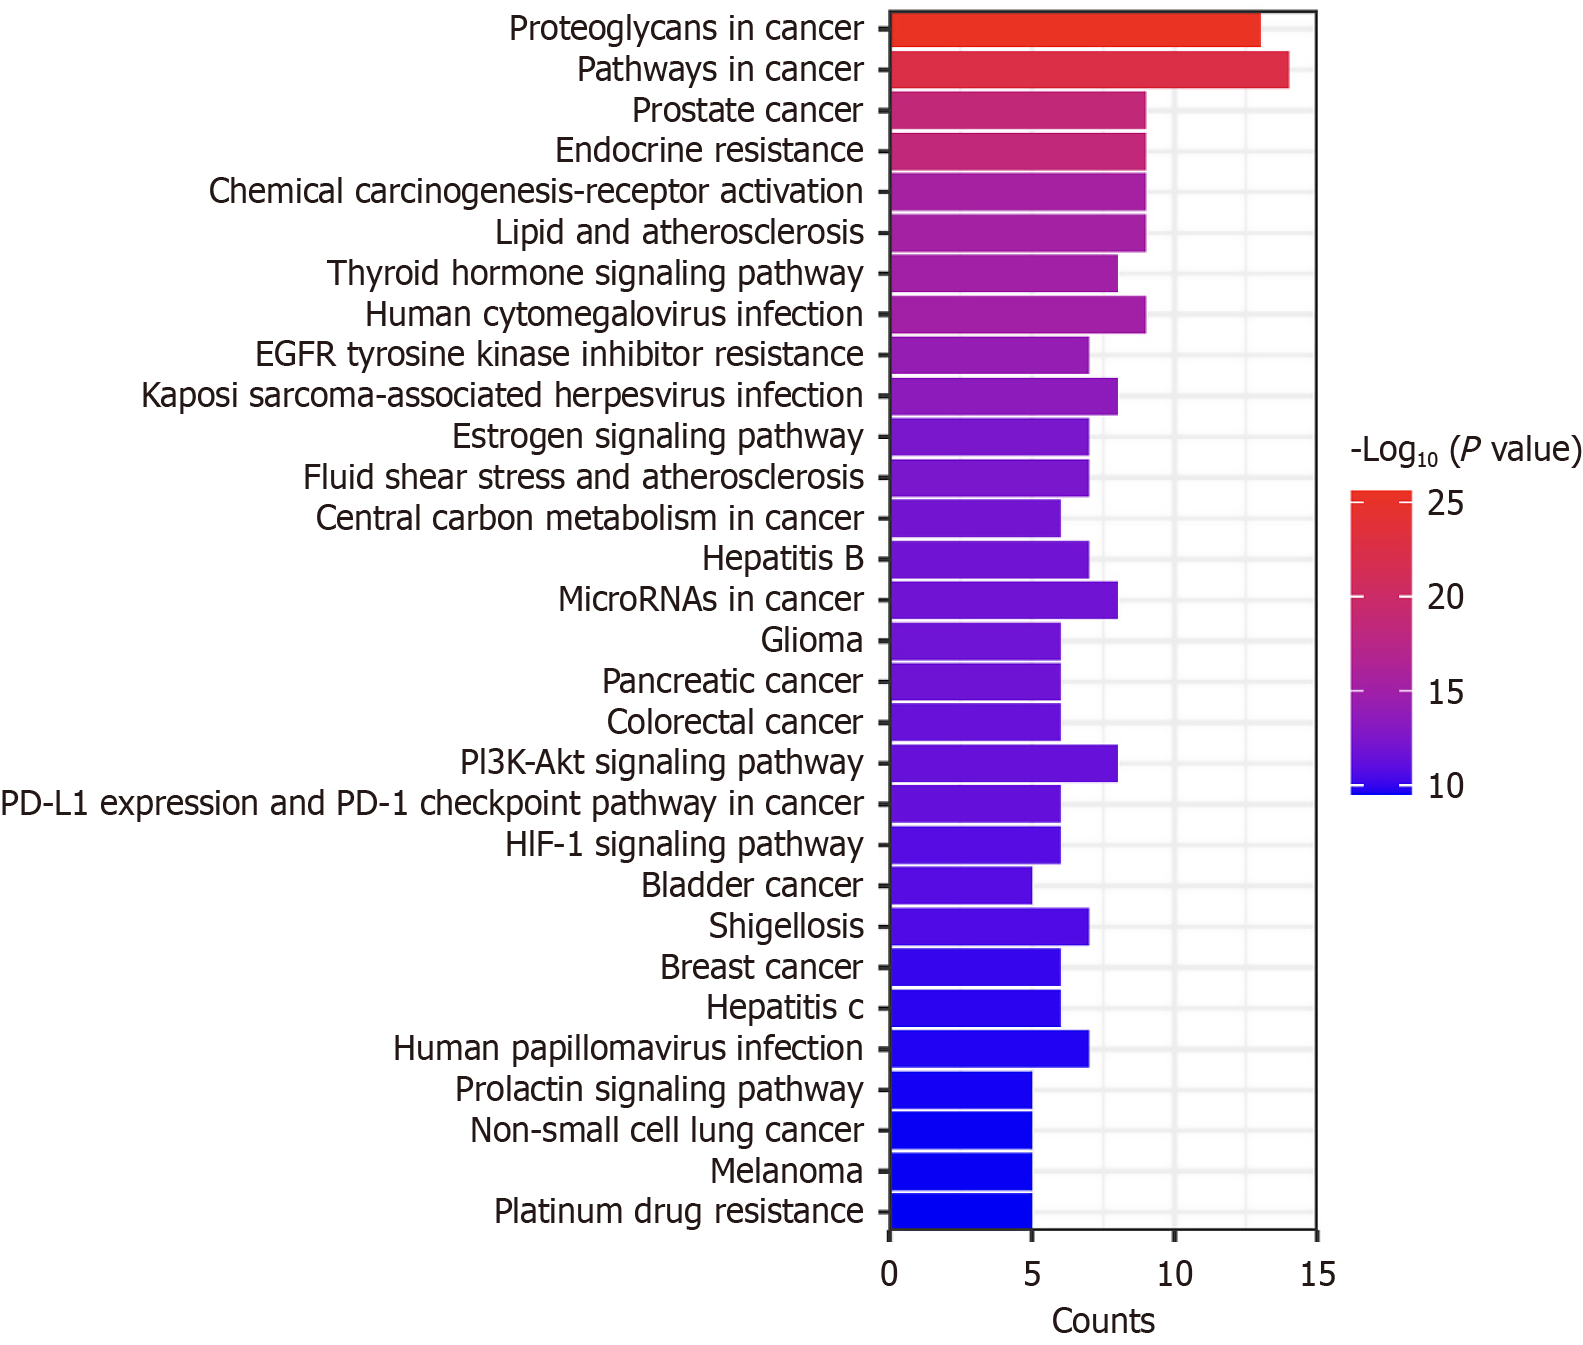
Figure 5
Bar chart of Kyoto Encyclopedia of genes and genomes enrichment analysis.
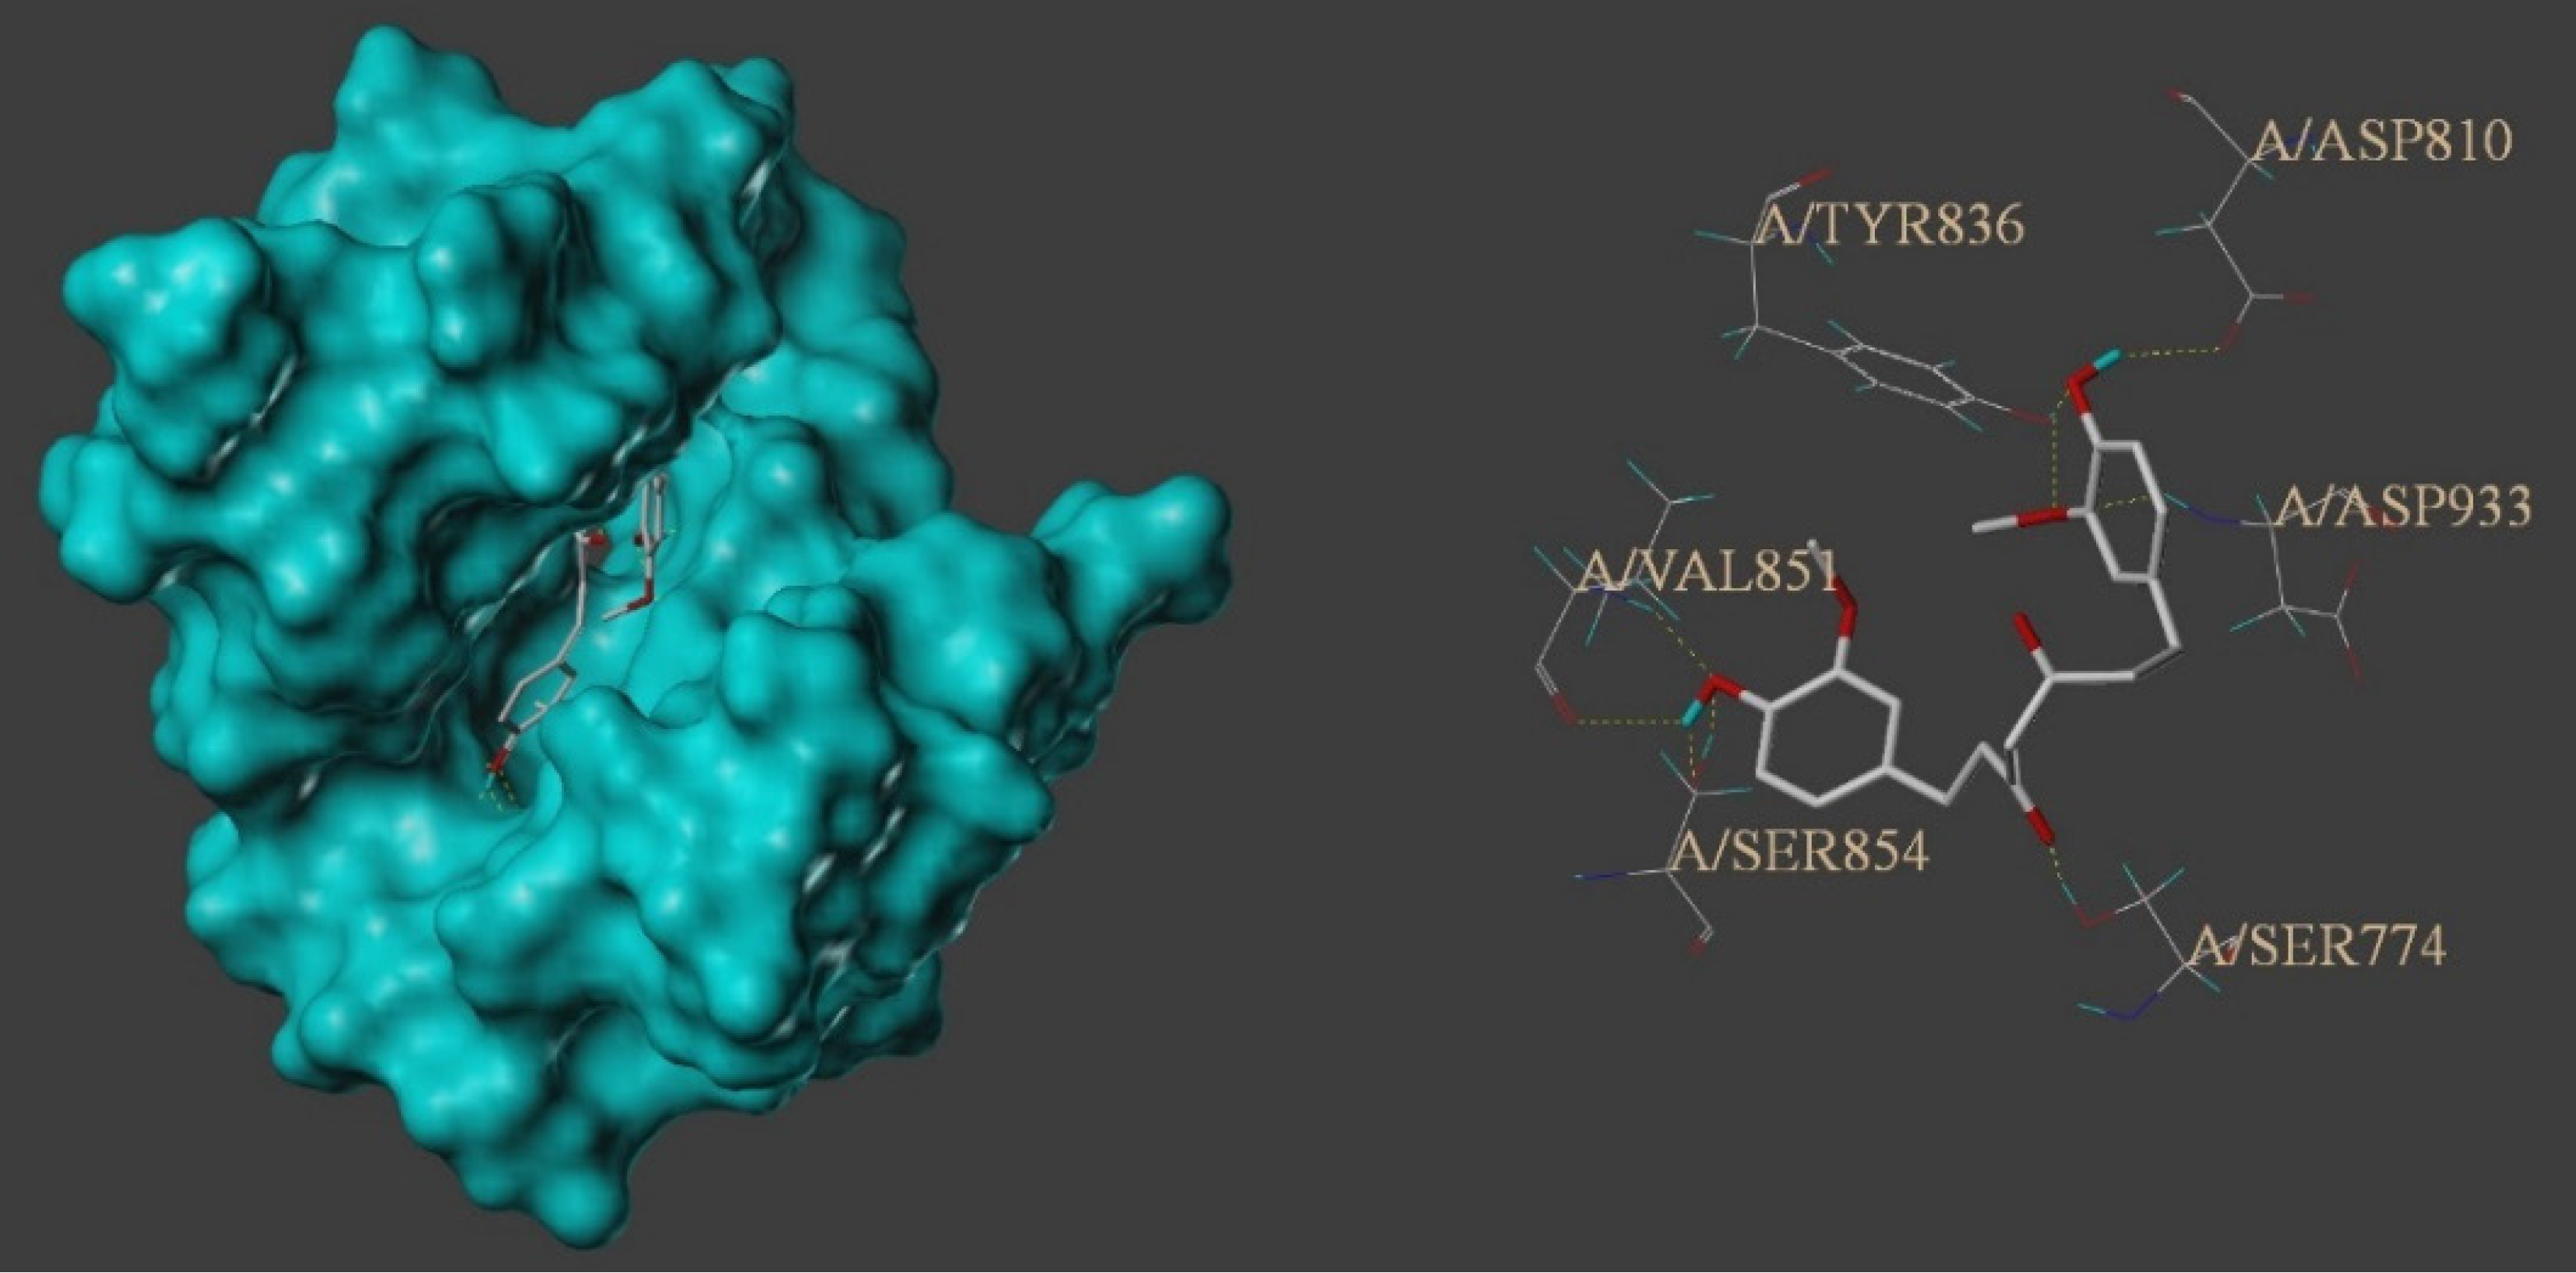
Figure 6 Schematic of the interaction between tetrahydrocurcumin and phosphatidylinositol-4,5-bisphosphate 3-kinase catalytic subunit alpha.
Tetrahydrocurcumin has strong binding activity, forming nine hydrogen bonds in the hydrophobic pocket formed by TYR836, VAL851, SER854, ASP810, ASP933, and SER774 amino acid residues of phosphatidylinositol-4,5-bisphosphate 3-kinase catalytic subunit alpha.
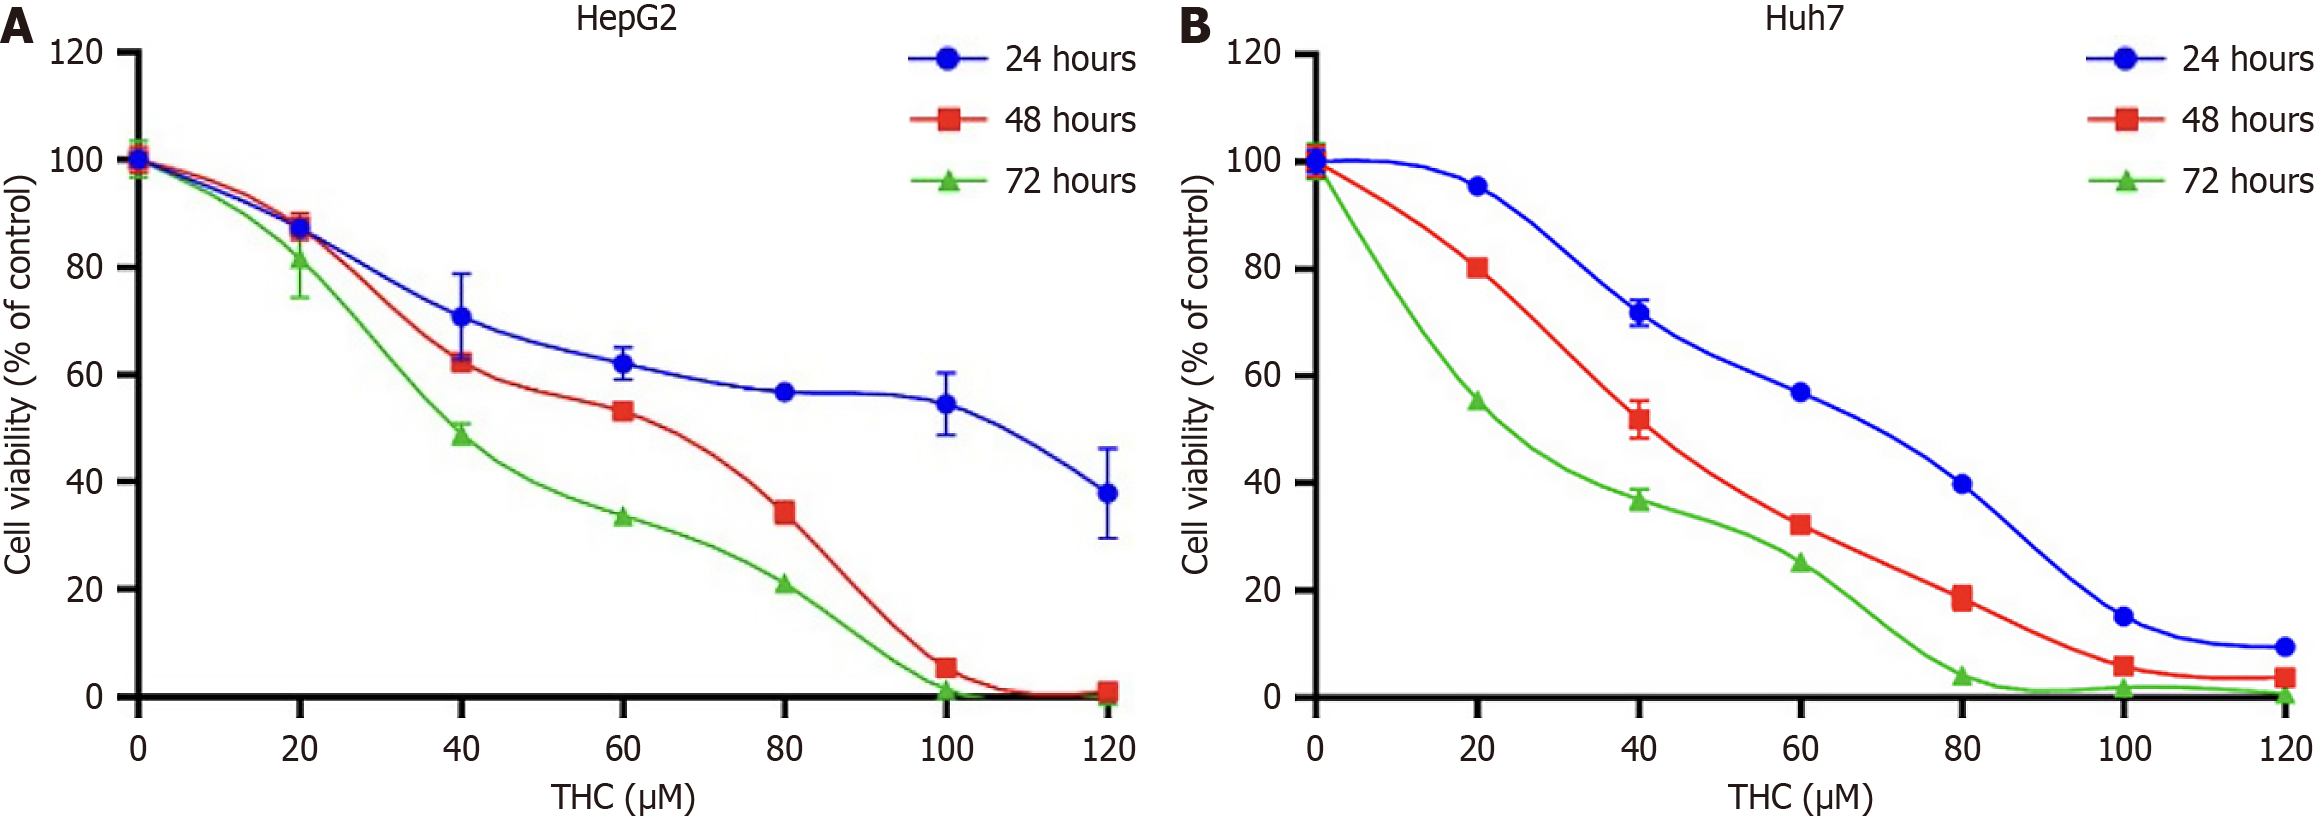
Figure 7 HepG2 and Huh7 cell viability assay.
A: Effects of tetrahydrocurcumin (THC) on HepG2 cell viability at 24, 48, and 72 hours; B: Effects of THC on the viability of Huh7 cells. Seven experimental groups were included: Control group (0 μmol/L THC), THC (20, 40, 60, 80, 100, and 120 μmol/L). Data are presented as mean ± SD, n = 3. P < 0.05 vs the control group. THC: Tetrahydrocurcumin.
Figure 8 Clonogenic assays of HepG2 and Huh7 cells treated with different concentrations of tetrahydrocurcumin.
A: Representative images of colony formation under different treatment concentration (25, 50, and 100 μmol/L); B: Quantification of colony formation under all conditions for the two cell lines. All data are presented as mean ± SD, n = 3. aP < 0.05 vs the control group. THC: Tetrahydrocurcumin.
Figure 9 The effect of tetrahydrocurcumin on the migration and invasion of HepG2 and Huh7 cells.
A: Wound-healing assay reflecting the cell migration ability of HepG2 and Huh7 cells after tetrahydrocurcumin (THC, 25, 50, and 100 μmol/L) treatment for 48 hours and graph showing the wound healing rate of HepG2 and Huh7 cells after THC (25, 50, and 100 μmol/L) treatment for 48 hours; B: Transwell assays validated the effect of THC (25, 50, and 100 μmol/L) on the migration ability of HepG2 cells. The number of cells passing through the cell chamber was counted for statistical analysis after 48 hours of drug treatment, and the effect of the drug on cell invasion ability was also verified using matrigel. The number of cells passing through the cell chamber was counted for statistical analysis after 48 hours of drug treatment; C: Transwell experiment assessing the effect of THC (25, 50, and 100 μmol/L) on the migration ability of Huh7 cells. The number of cells passing through the cell chamber was statistically analyzed after 48 hours of drug treatment. The effect of the drug on cell invasion was also verified using matrigel. The number of cells passing through the cell chamber was analyzed after 48 hours of drug treatment. Scale bars: 200 μm. All data are expressed as mean ± SD, n = 3. bP < 0.01 vs the control group. THC: Tetrahydrocurcumin.
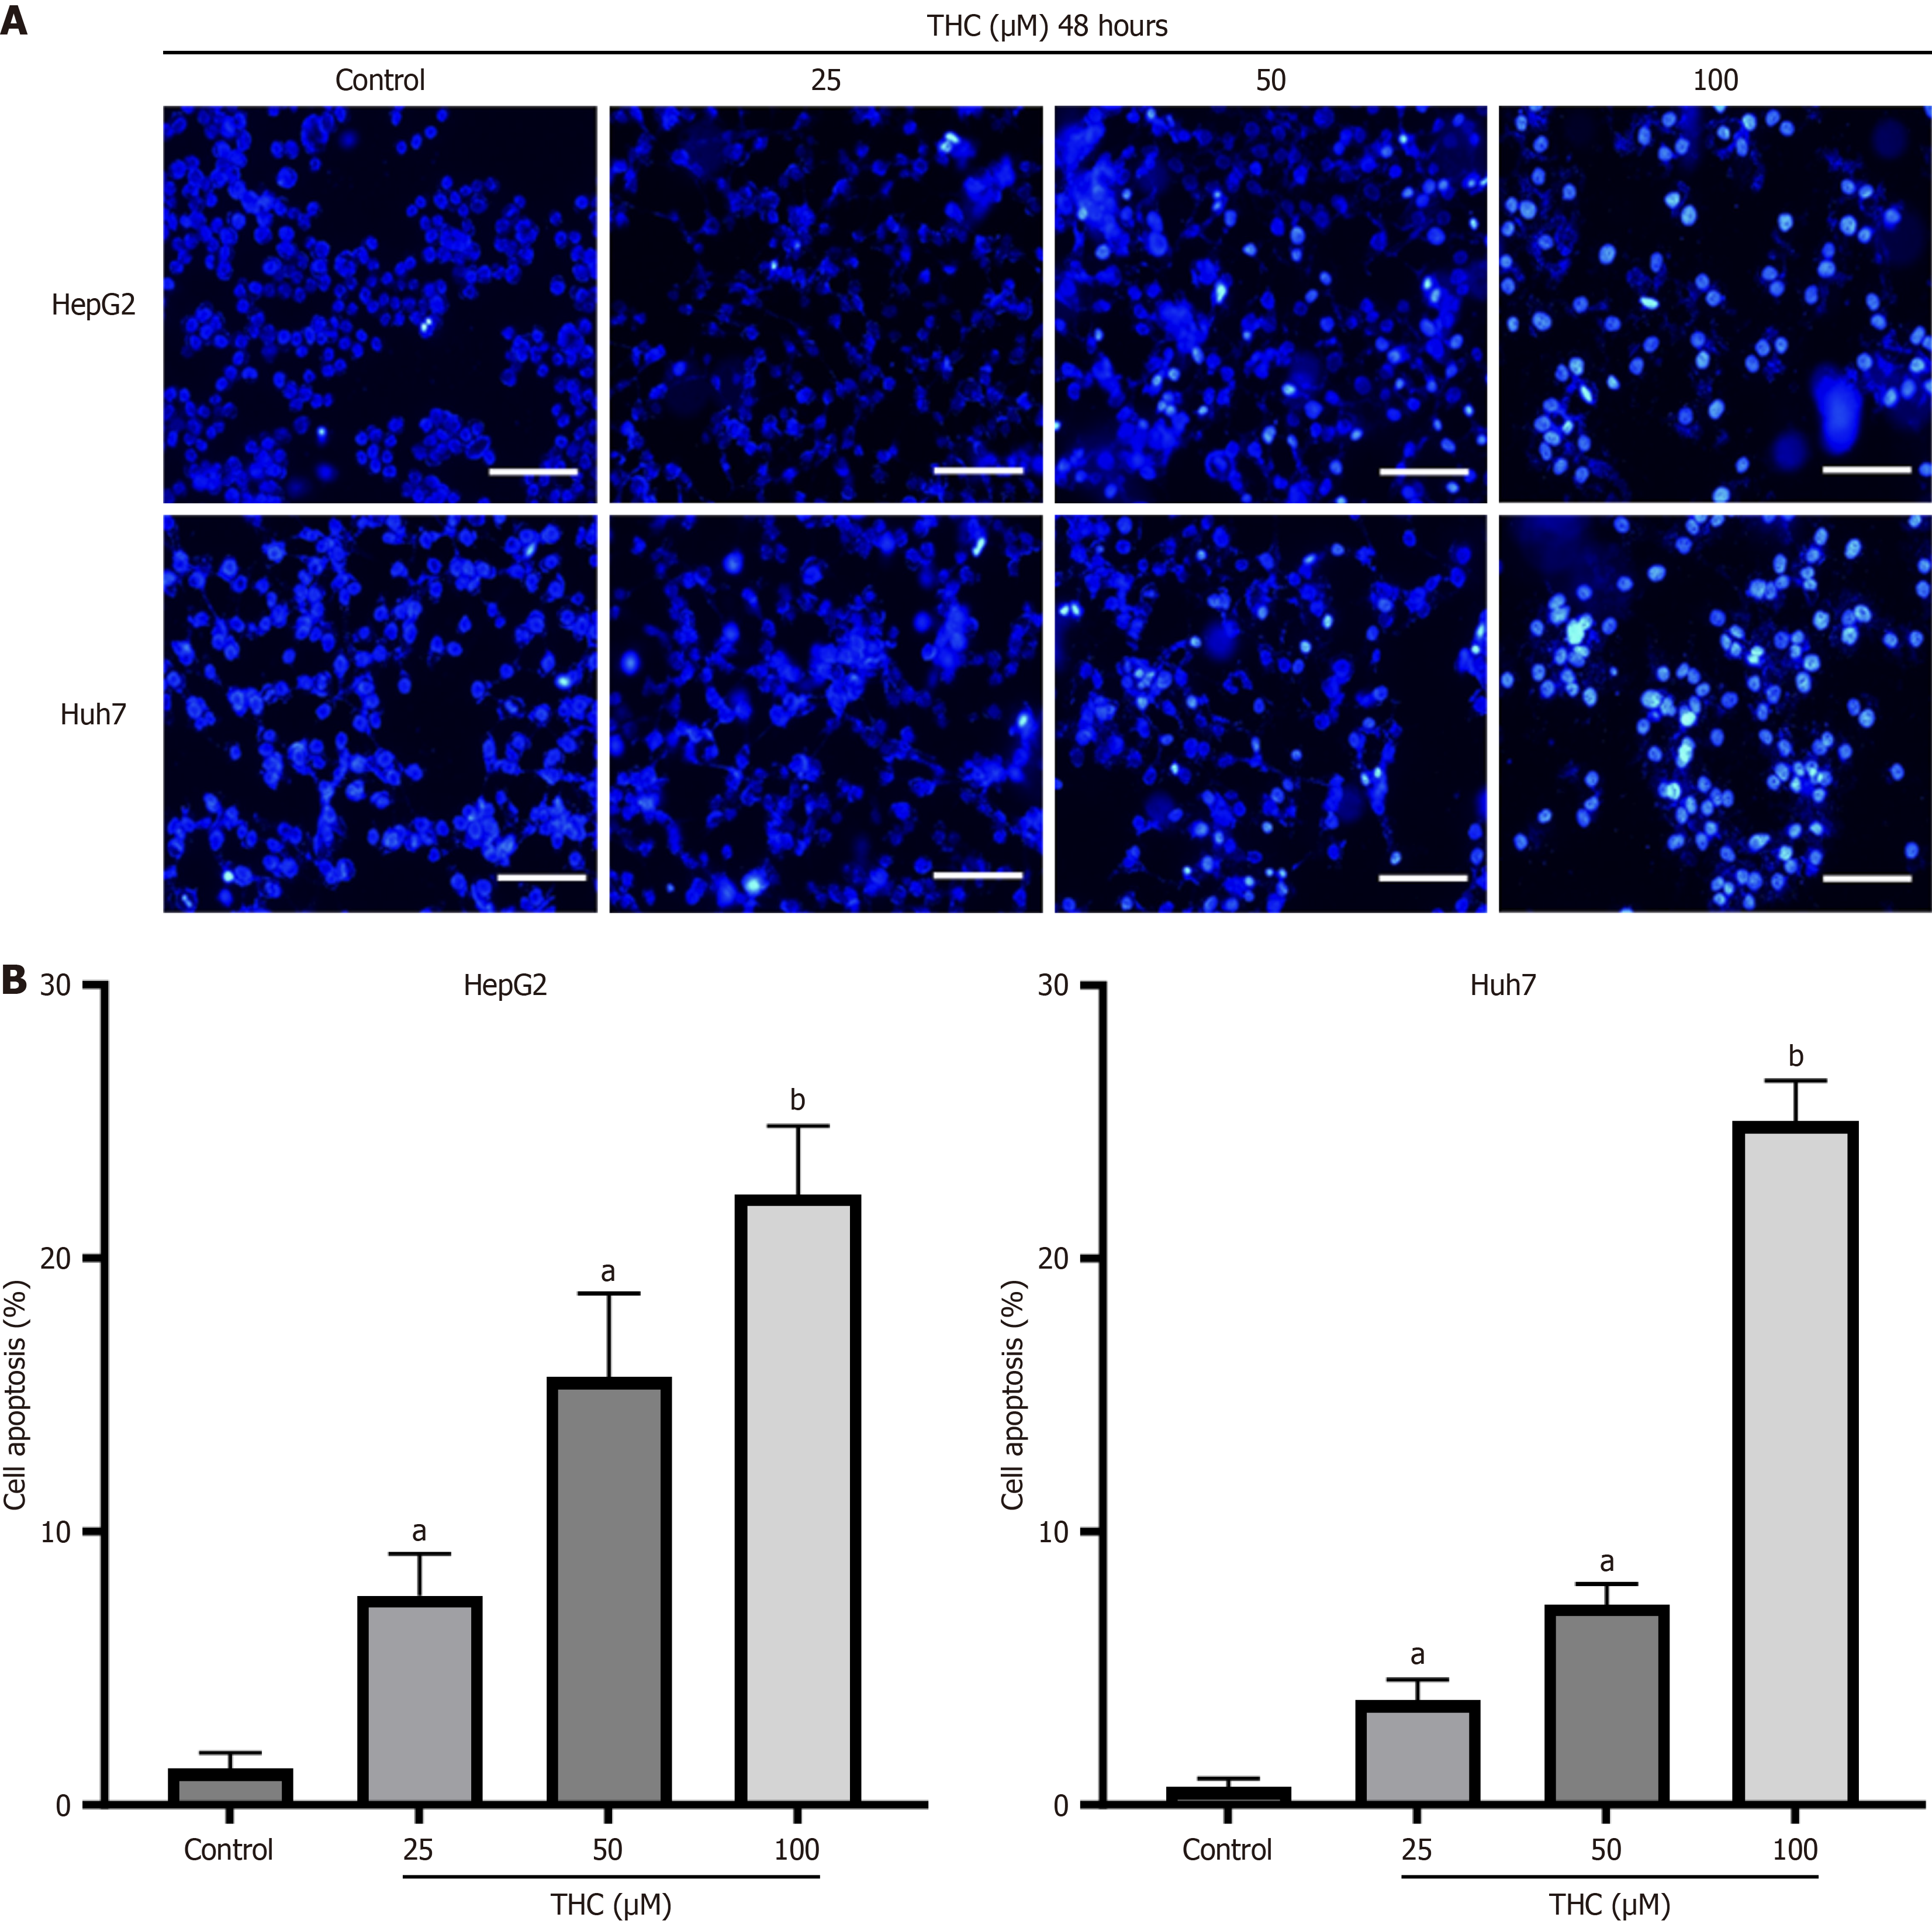
Figure 10 The effect of tetrahydrocurcumin on HepG2 and Huh7 cell apoptosis.
A: Hoechst 33342 staining for the detection of apoptosis in HepG2 and Huh7 cells after THC (25, 50, and 100 μmol/L) treatment for 48 hours (Scale bar: 20 μm); B: Quantification of cell apoptosis. Data are presented as the mean ± SD, n = 3. aP < 0.05 vs the control group, bP < 0.01 vs the control group. THC: Tetrahydrocurcumin.
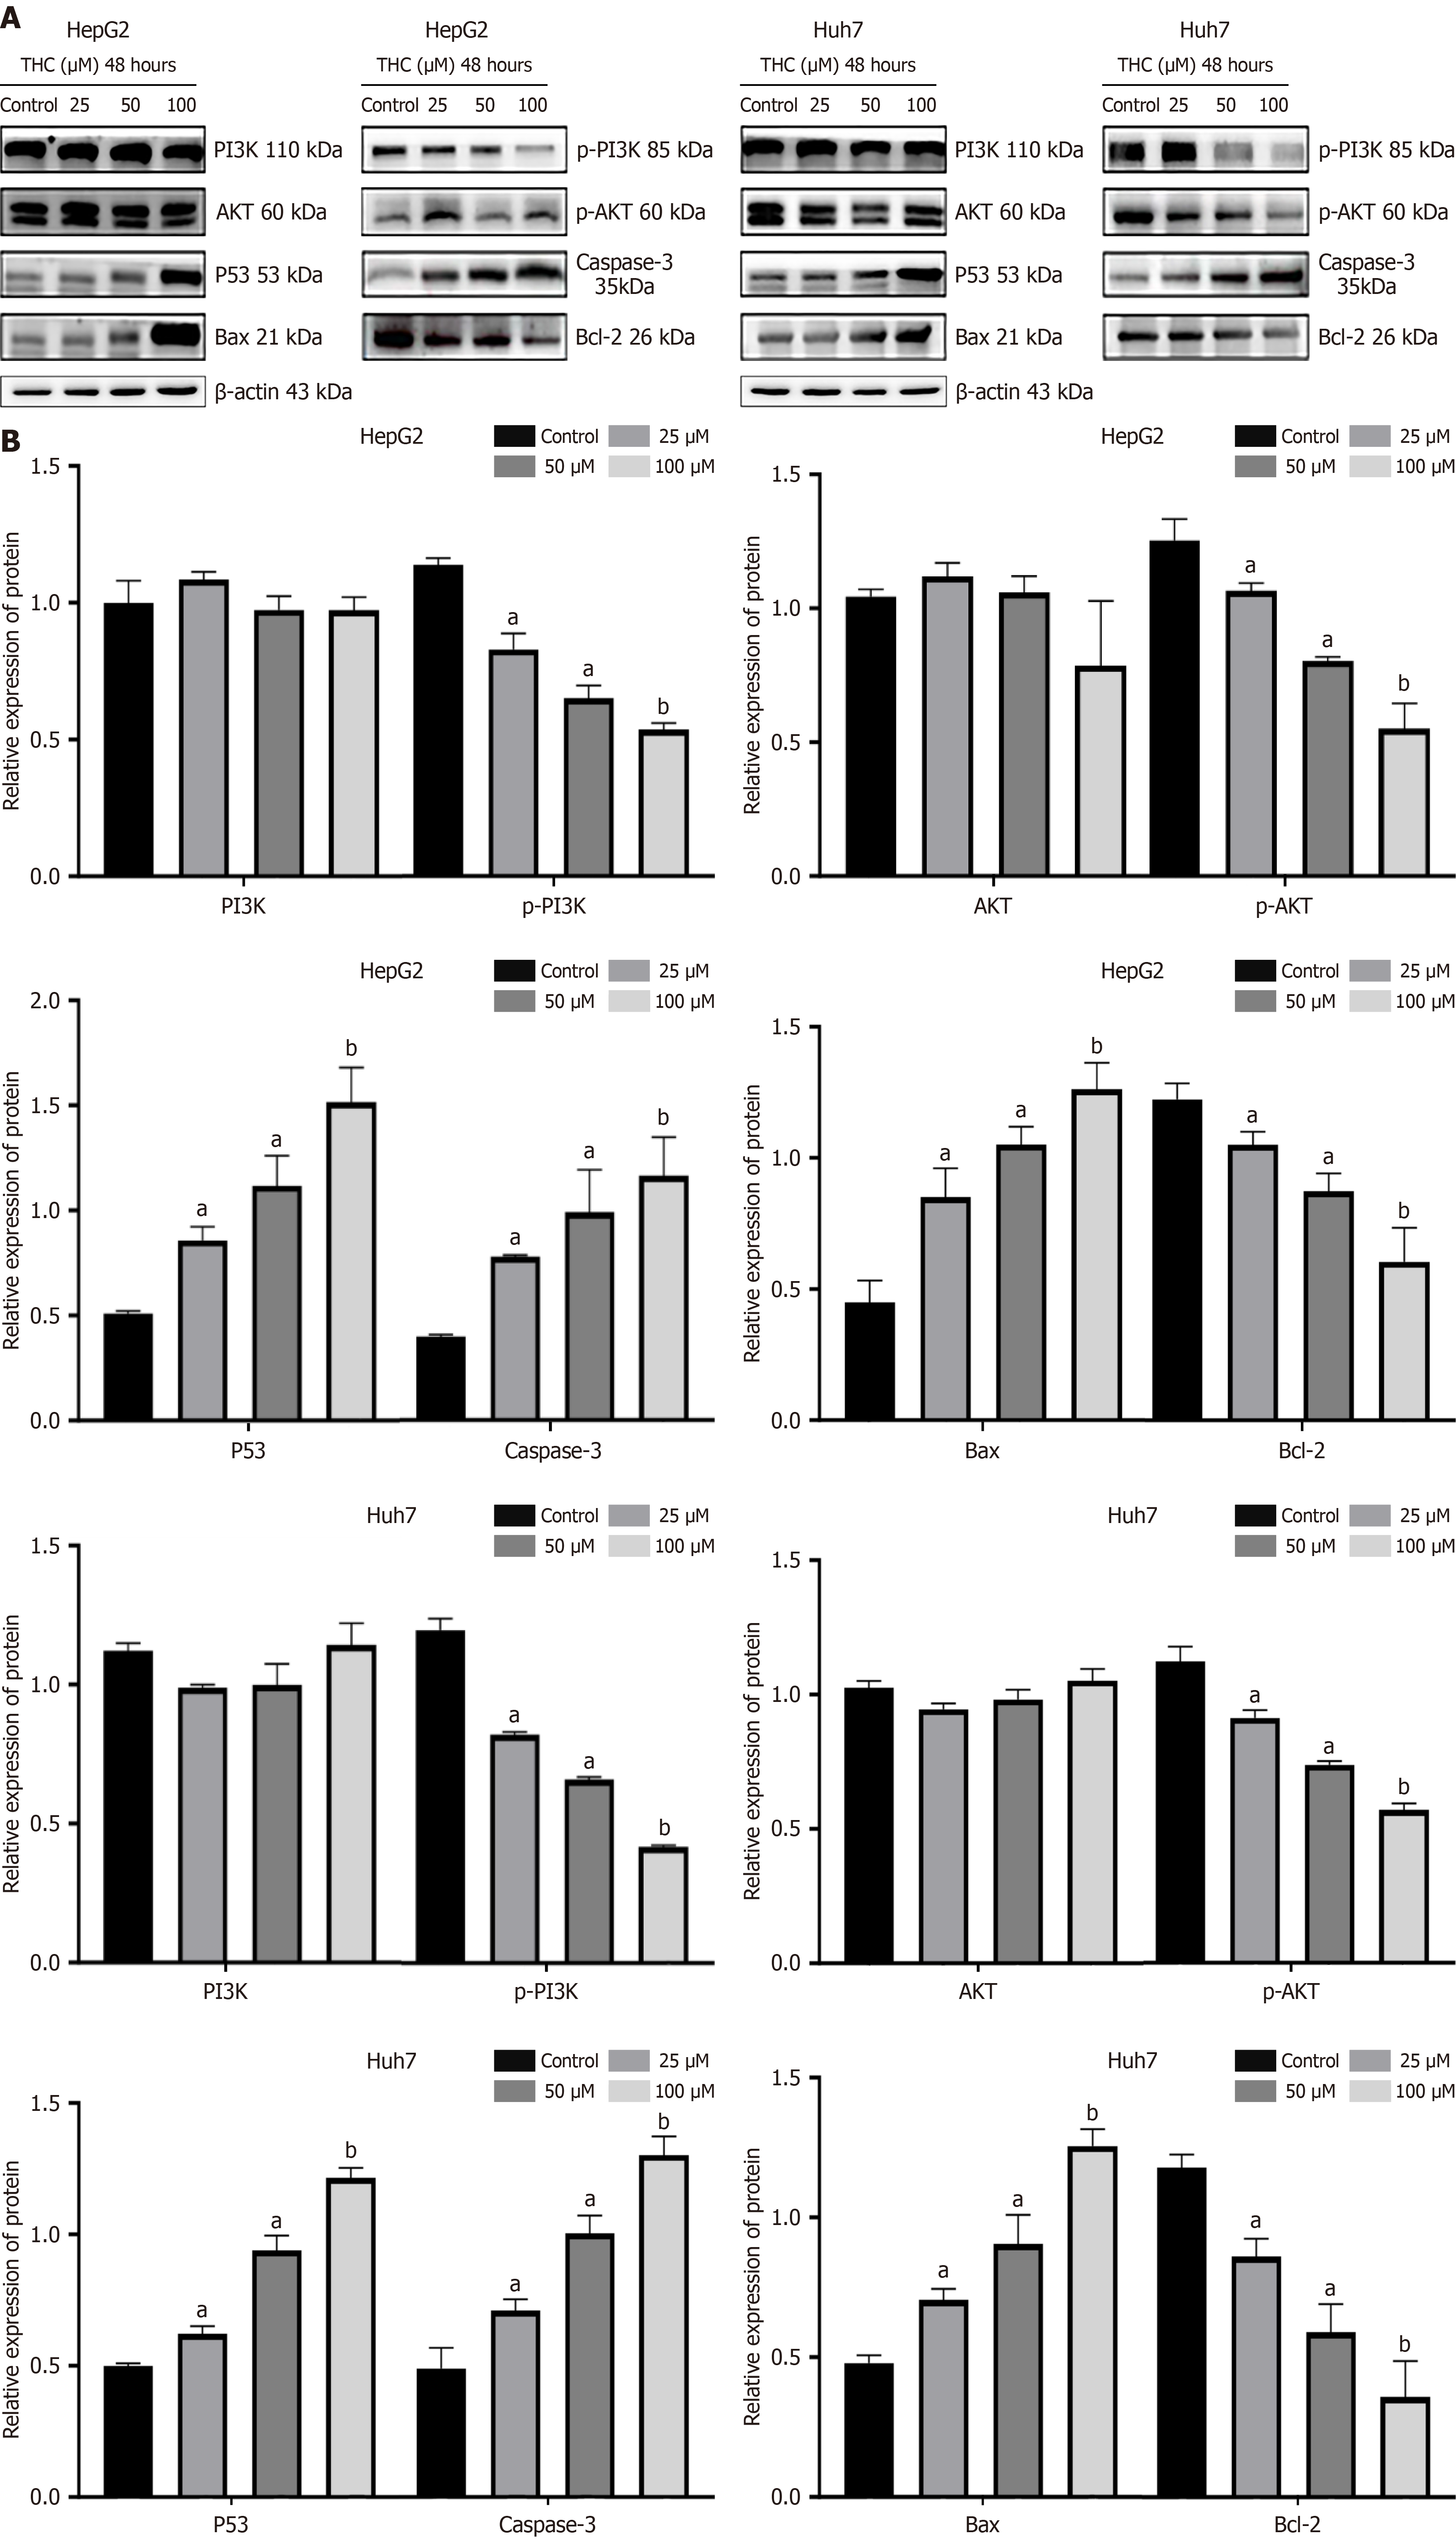
Figure 11 Effects of tetrahydrocurcumin on the expression of phosphoinositide 3-kinases-AKT signaling pathway-related proteins in HepG2 and Huh7 cells.
A: Western blot detection of core proteins related to phosphoinositide 3-kinases (PI3K)/AKT signaling. HepG2 and Huh7 cells were treated with THC (25, 50, and 100 μM) for 48 hours. Representative bands of PI3K, p-PI3K, AKT, p-AKT, p53, caspase-3, B cell leukemia/lymphoma 2 associated X, and B cell leukemia/lymphoma 2 protein expression analyzed by Western blotting; B: Western blot analysis of the expression levels of core PI3K/AKT proteins in HepG2 and Huh7 cells after drug treatment. All data are presented as mean ± SD, n = 3. Compared to the control group, ns indicates no significance, aP < 0.05 vs the control group, bP < 0.01 vs the control group. PI3K: Phosphoinositide 3-kinases; Bax: B cell leukemia/lymphoma 2 associated X; Bcl-2: B cell leukemia/lymphoma 2.
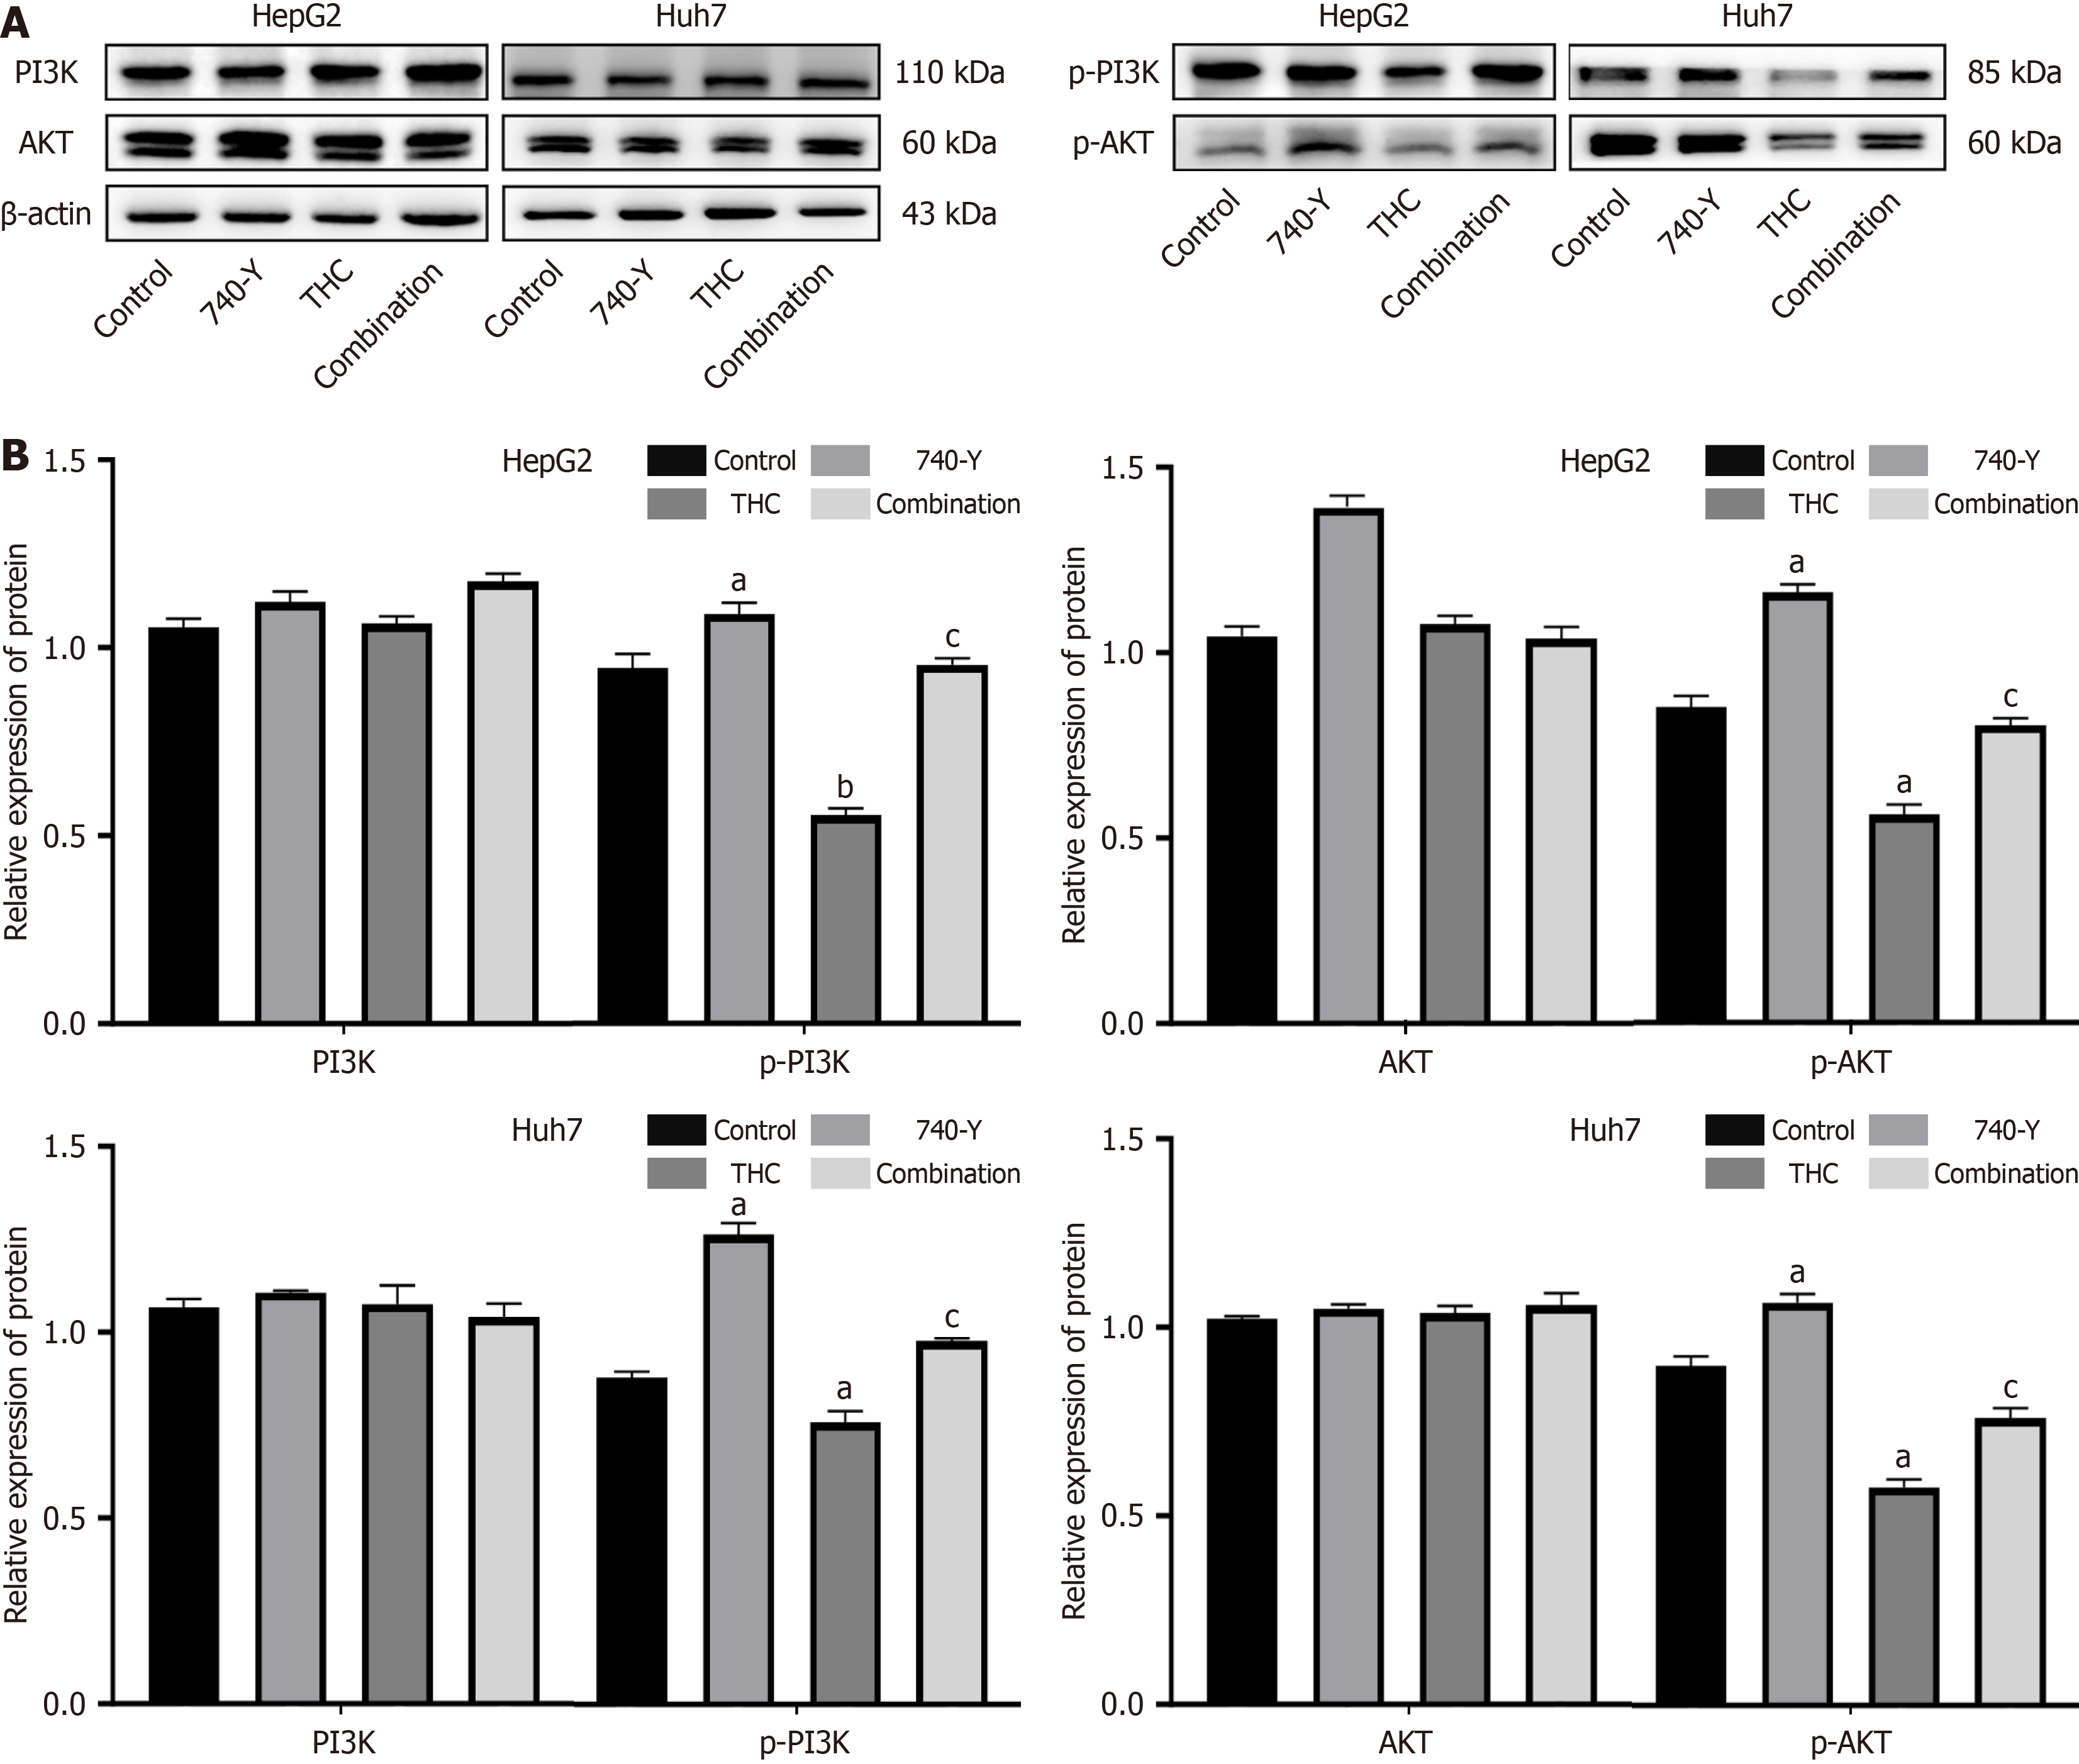
Figure 12 Signaling pathway agonist treatment to validate the effects of curcumin on phosphoinositide 3-kinases/AKT core protein levels.
A: Tetrahydrocurcumin (THC) inhibits the phosphoinositide 3-kinases (PI3K)/AKT pathway in HepG2 and Huh7 liver cancer cells. HepG2 and Huh7 cells were treated with 0 μM THC, PI3K activator 740 Y-P, THC (50 μM), or a combination of THC (50 μM) and 740 Y-P for 48 hours. The protein expression of PI3K, p-PI3K, AKT, and p-AKT was analyzed using western blot analysis. Representative bands of PI3K, p-PI3K, AKT, and p-AKT protein expression in HepG2 and Huh7 cells after different treatments are shown in graph; B: The protein expression levels of PI3K, p-PI3K, AKT, and p-AKT in HepG2 and Huh7 cells after different treatments are illustrated in the bar graph. All data are presented as mean ± SD, n = 3. aP < 0.05 vs the control group, bP < 0.01 vs the control group, cP < 0.01 vs THC (50 μM). PI3K: Phosphoinositide 3-kinases; THC: Tetrahydrocurcumin.
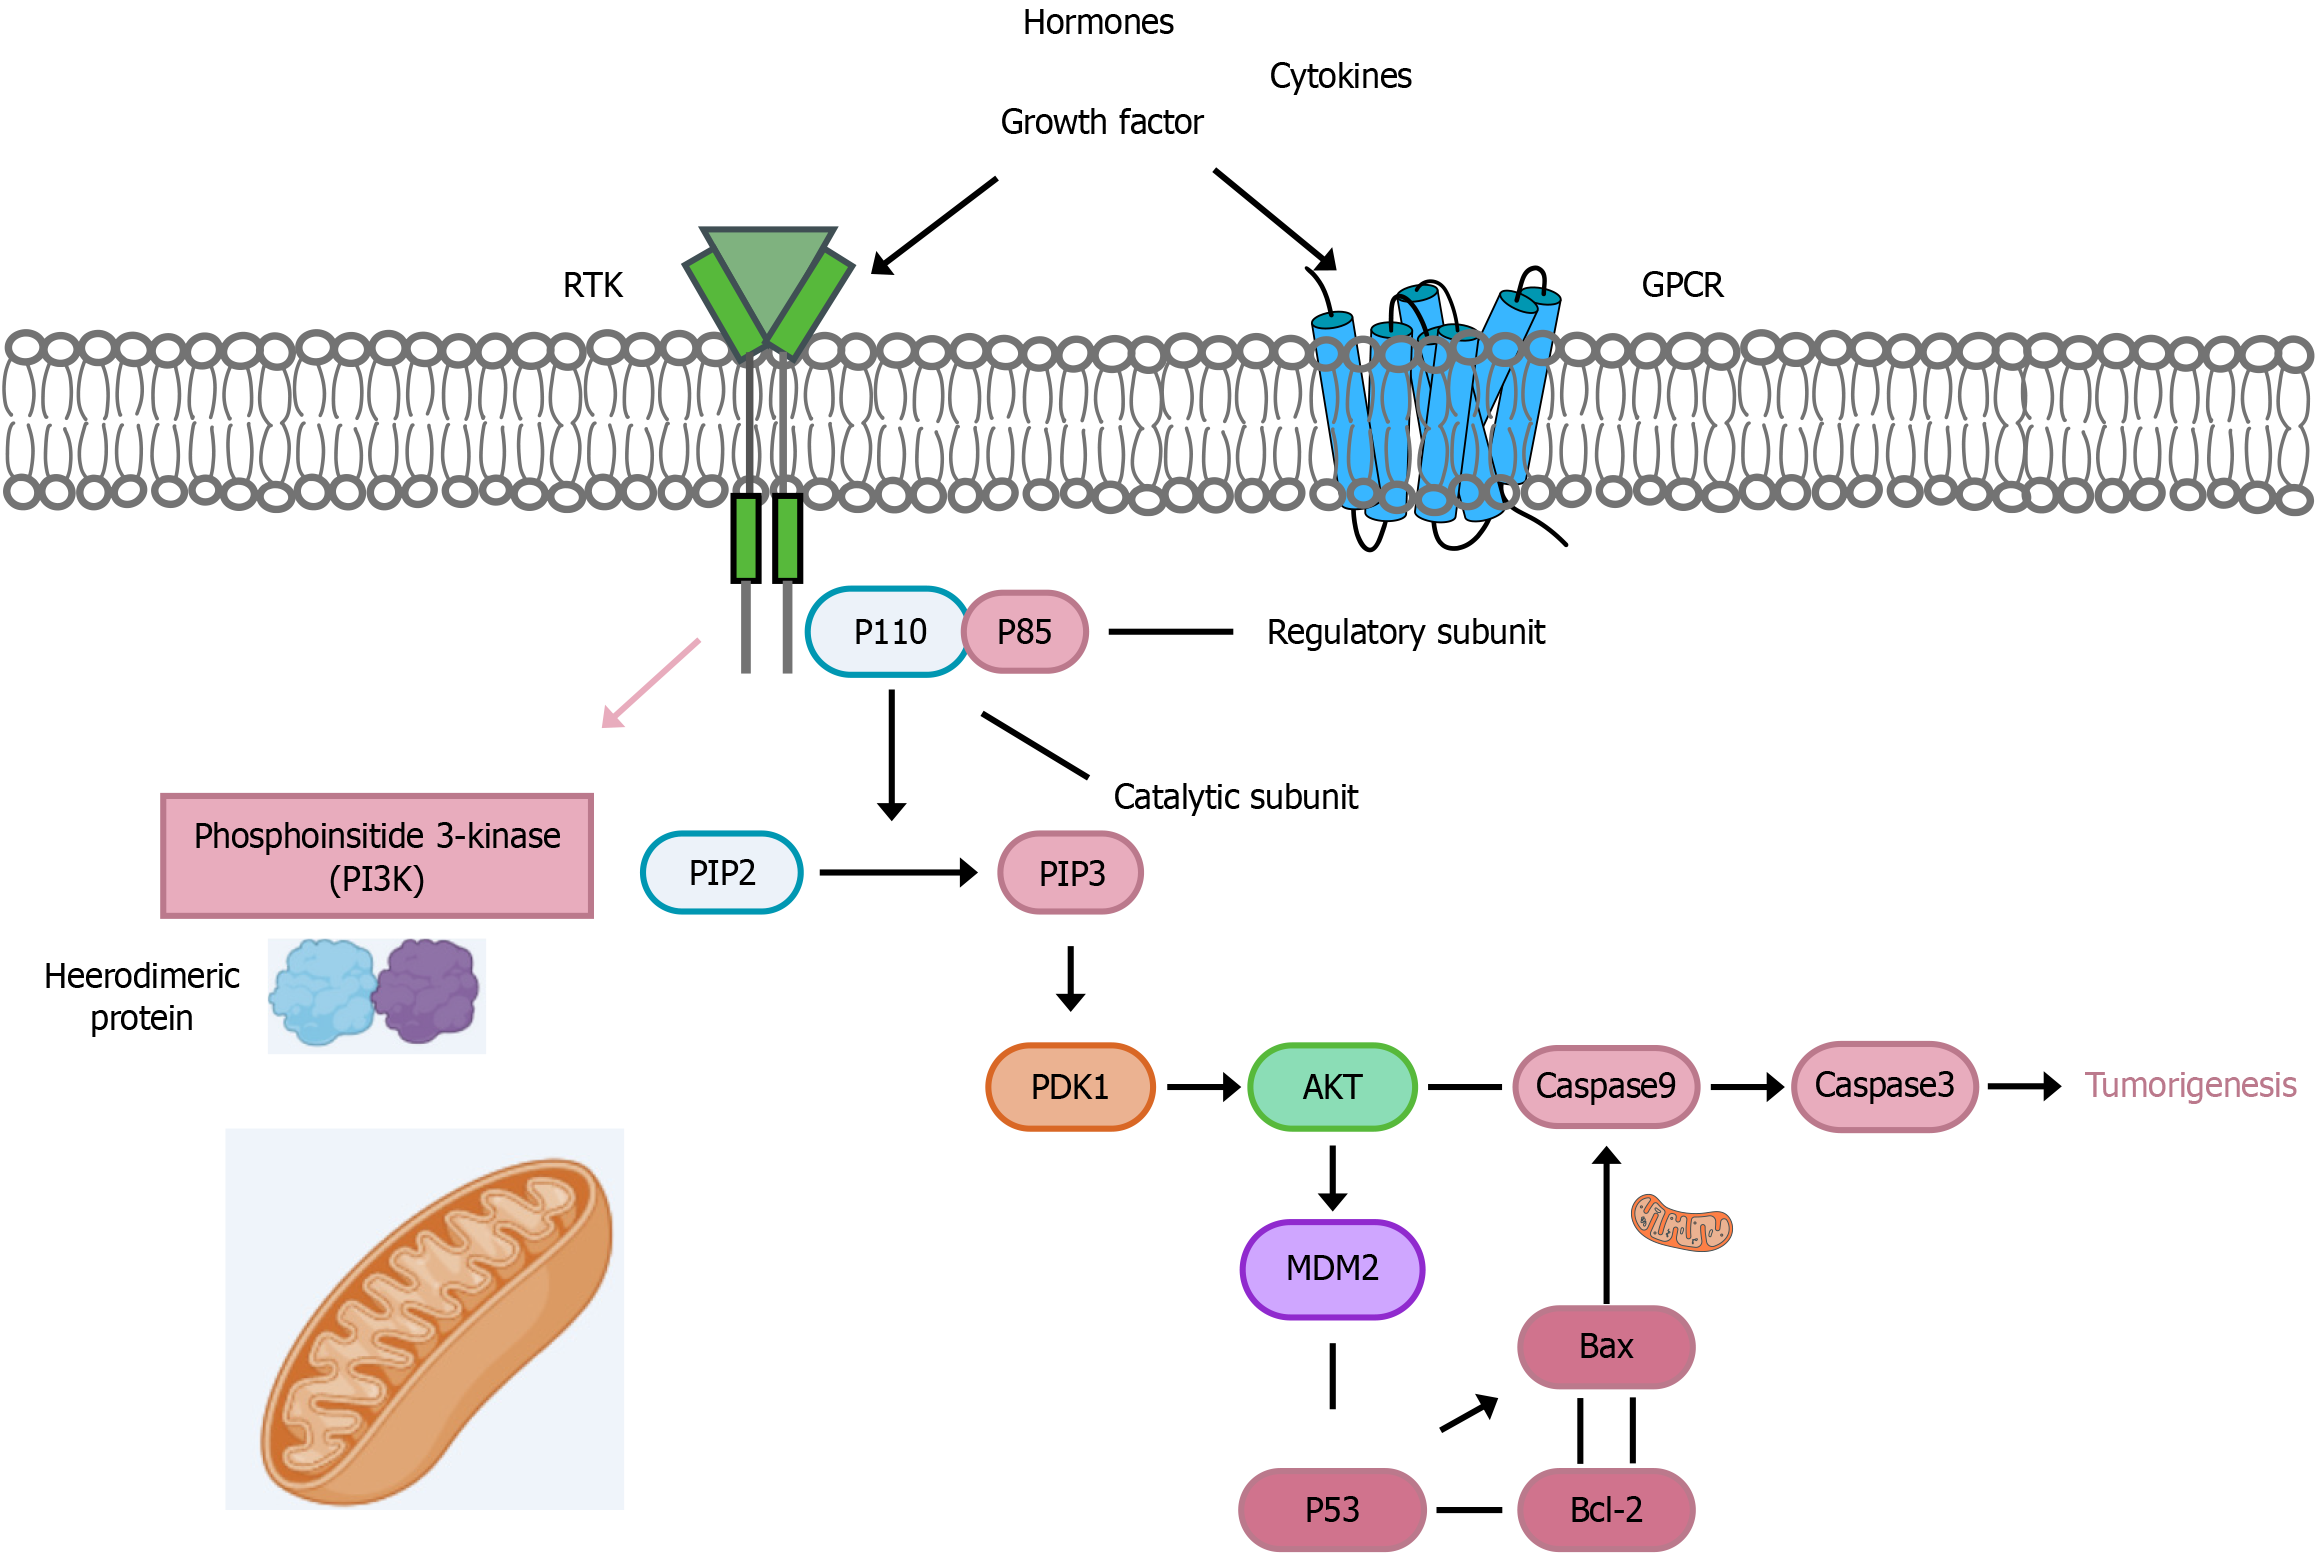
Figure 13 Schematic diagram of the phosphoinositide 3-kinases/AKT signaling pathway and its downstream multiple effector molecules.
RTK: Receptor tyrosine kinases; GPCR: G protein coupled receptor; PIP2: Phosphatidylinositol bisphosphate; PIP3: Phosphatidylinositol trisphosphate; PDK1: Pyruvate dehydrogenase kinase 1; MDM2: Murine double minute 2; Bax: B cell leukemia/lymphoma 2 associated X; Bcl-2: B cell leukemia/lymphoma 2.
- Citation: Bao ZC, Liu ZD, Zhang Y, Dai HJ, Jia H, Ren F, Li N, Zhao L, Wang YW, Lv SY, Zhang Y. To investigate the effect and mechanism of tetrahydrocurcumin on hepatocellular carcinoma based on phosphoinositide 3-kinases/AKT signaling pathway. World J Gastrointest Oncol 2025; 17(3): 102187
- URL: https://www.wjgnet.com/1948-5204/full/v17/i3/102187.htm
- DOI: https://dx.doi.org/10.4251/wjgo.v17.i3.102187


