Copyright
©The Author(s) 2025.
World J Gastrointest Oncol. Mar 15, 2025; 17(3): 100997
Published online Mar 15, 2025. doi: 10.4251/wjgo.v17.i3.100997
Published online Mar 15, 2025. doi: 10.4251/wjgo.v17.i3.100997
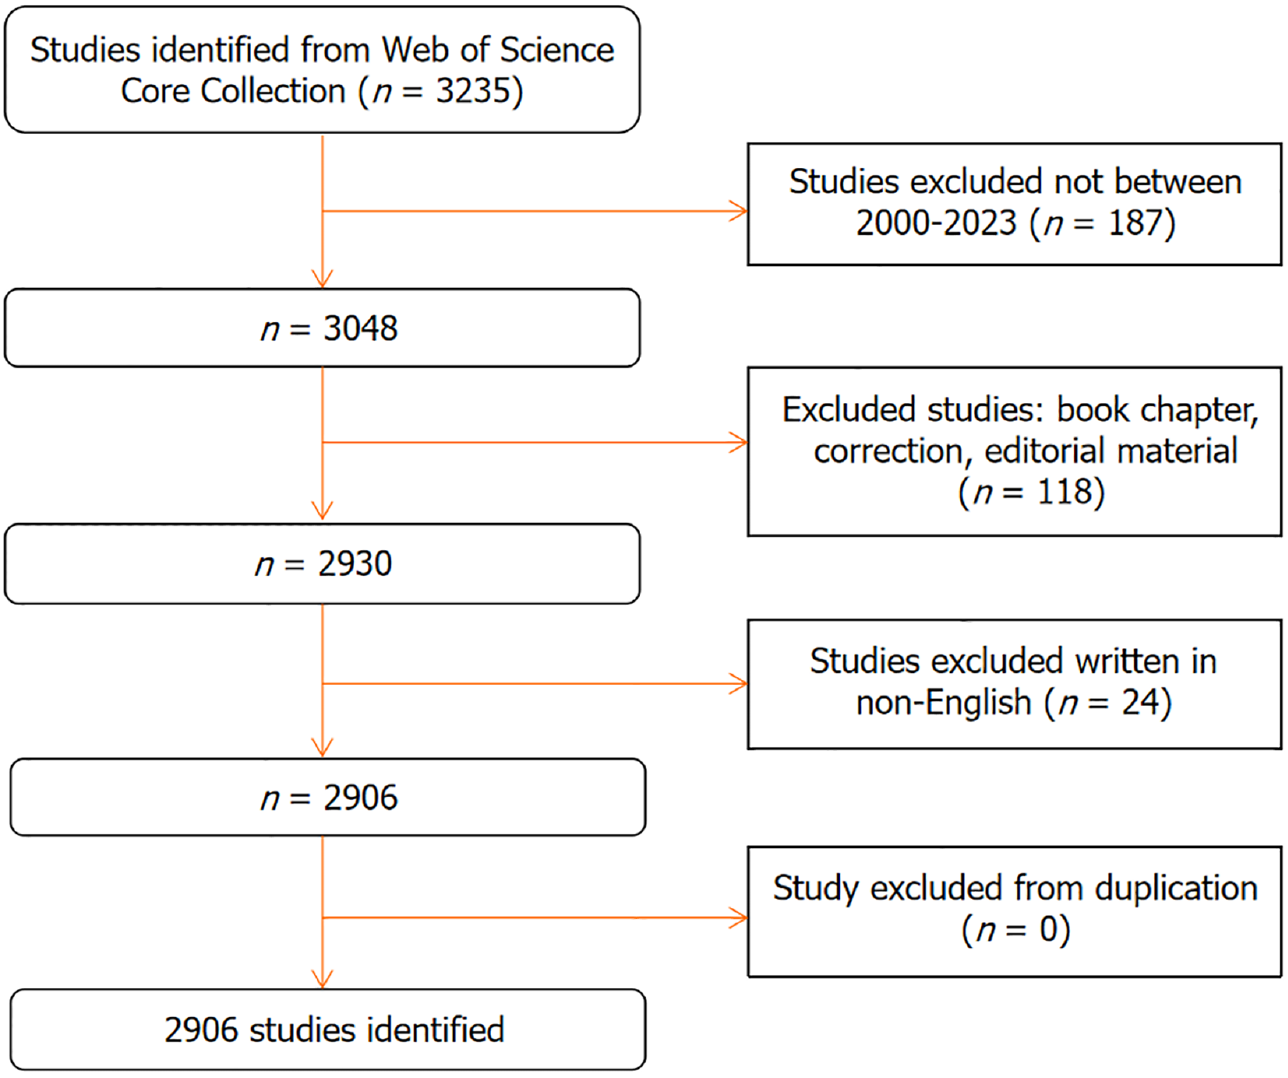
Figure 1 Flow chart illustrating the process for screening and searching literature.
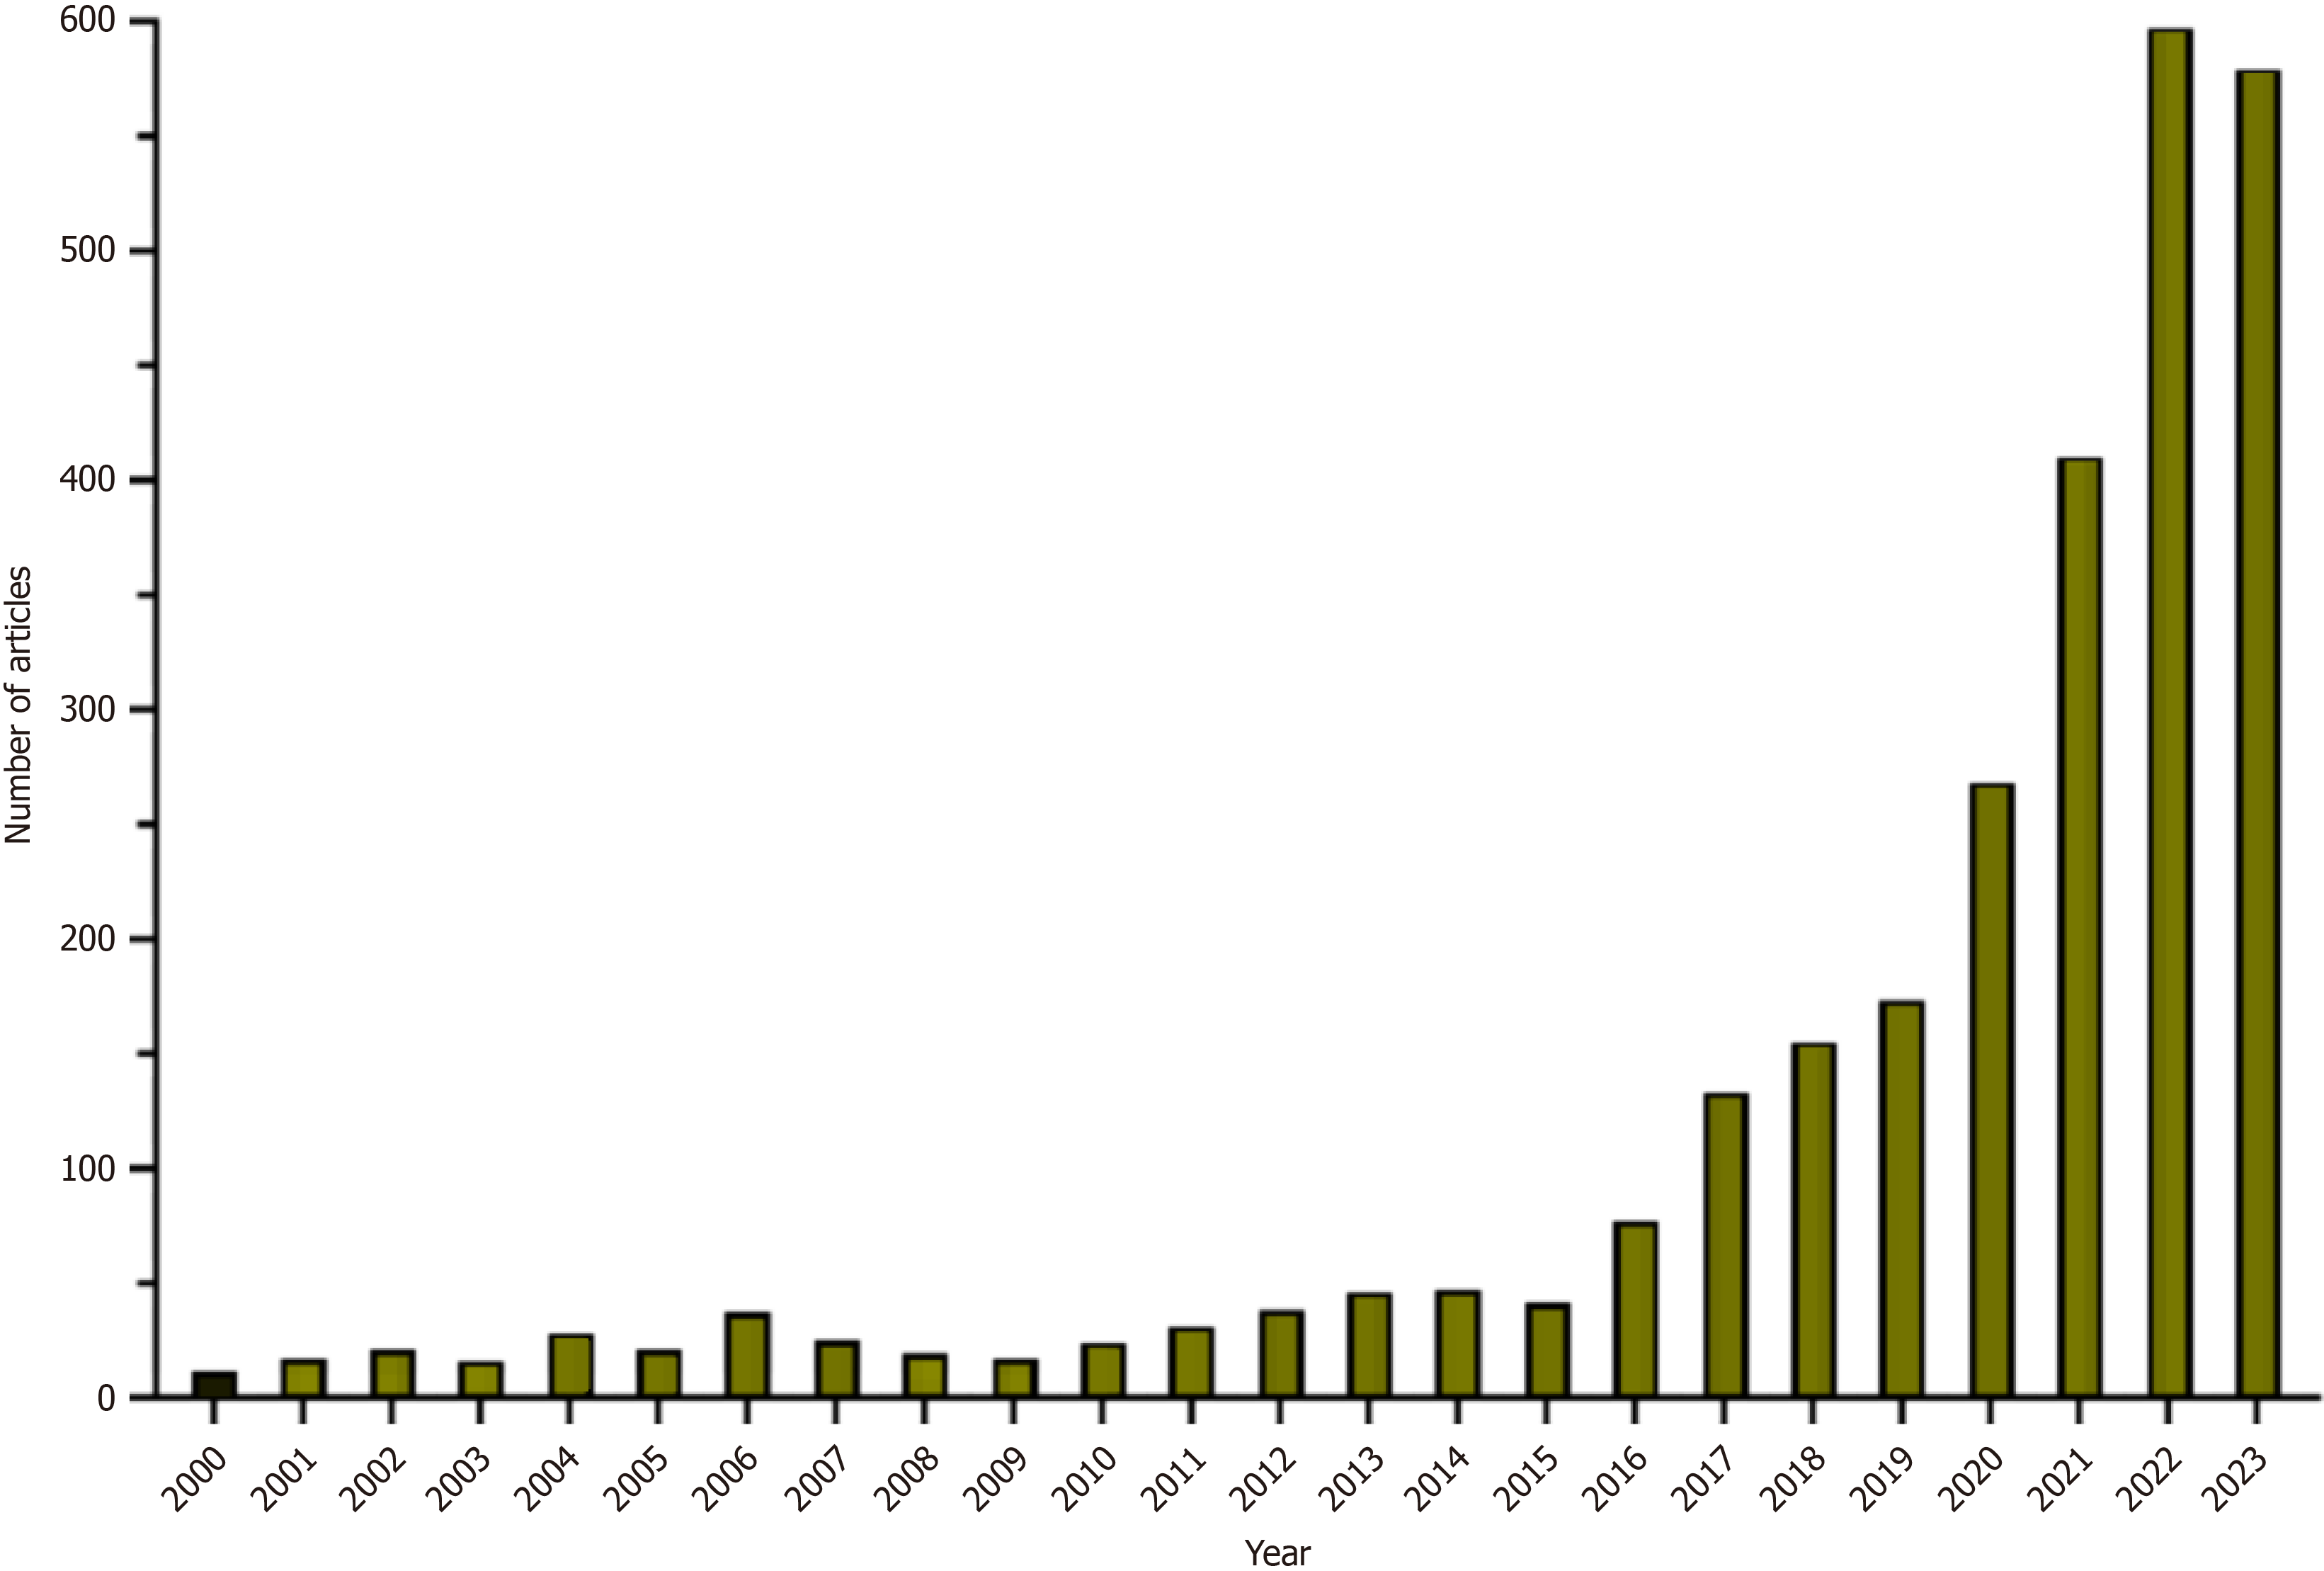
Figure 2 Publications by year distribution.
The number of publications increased modestly from 2000 to 2015, then gradually from 2016 to 2019, and surged after 2020, reaching its peak in 2022 in this field.
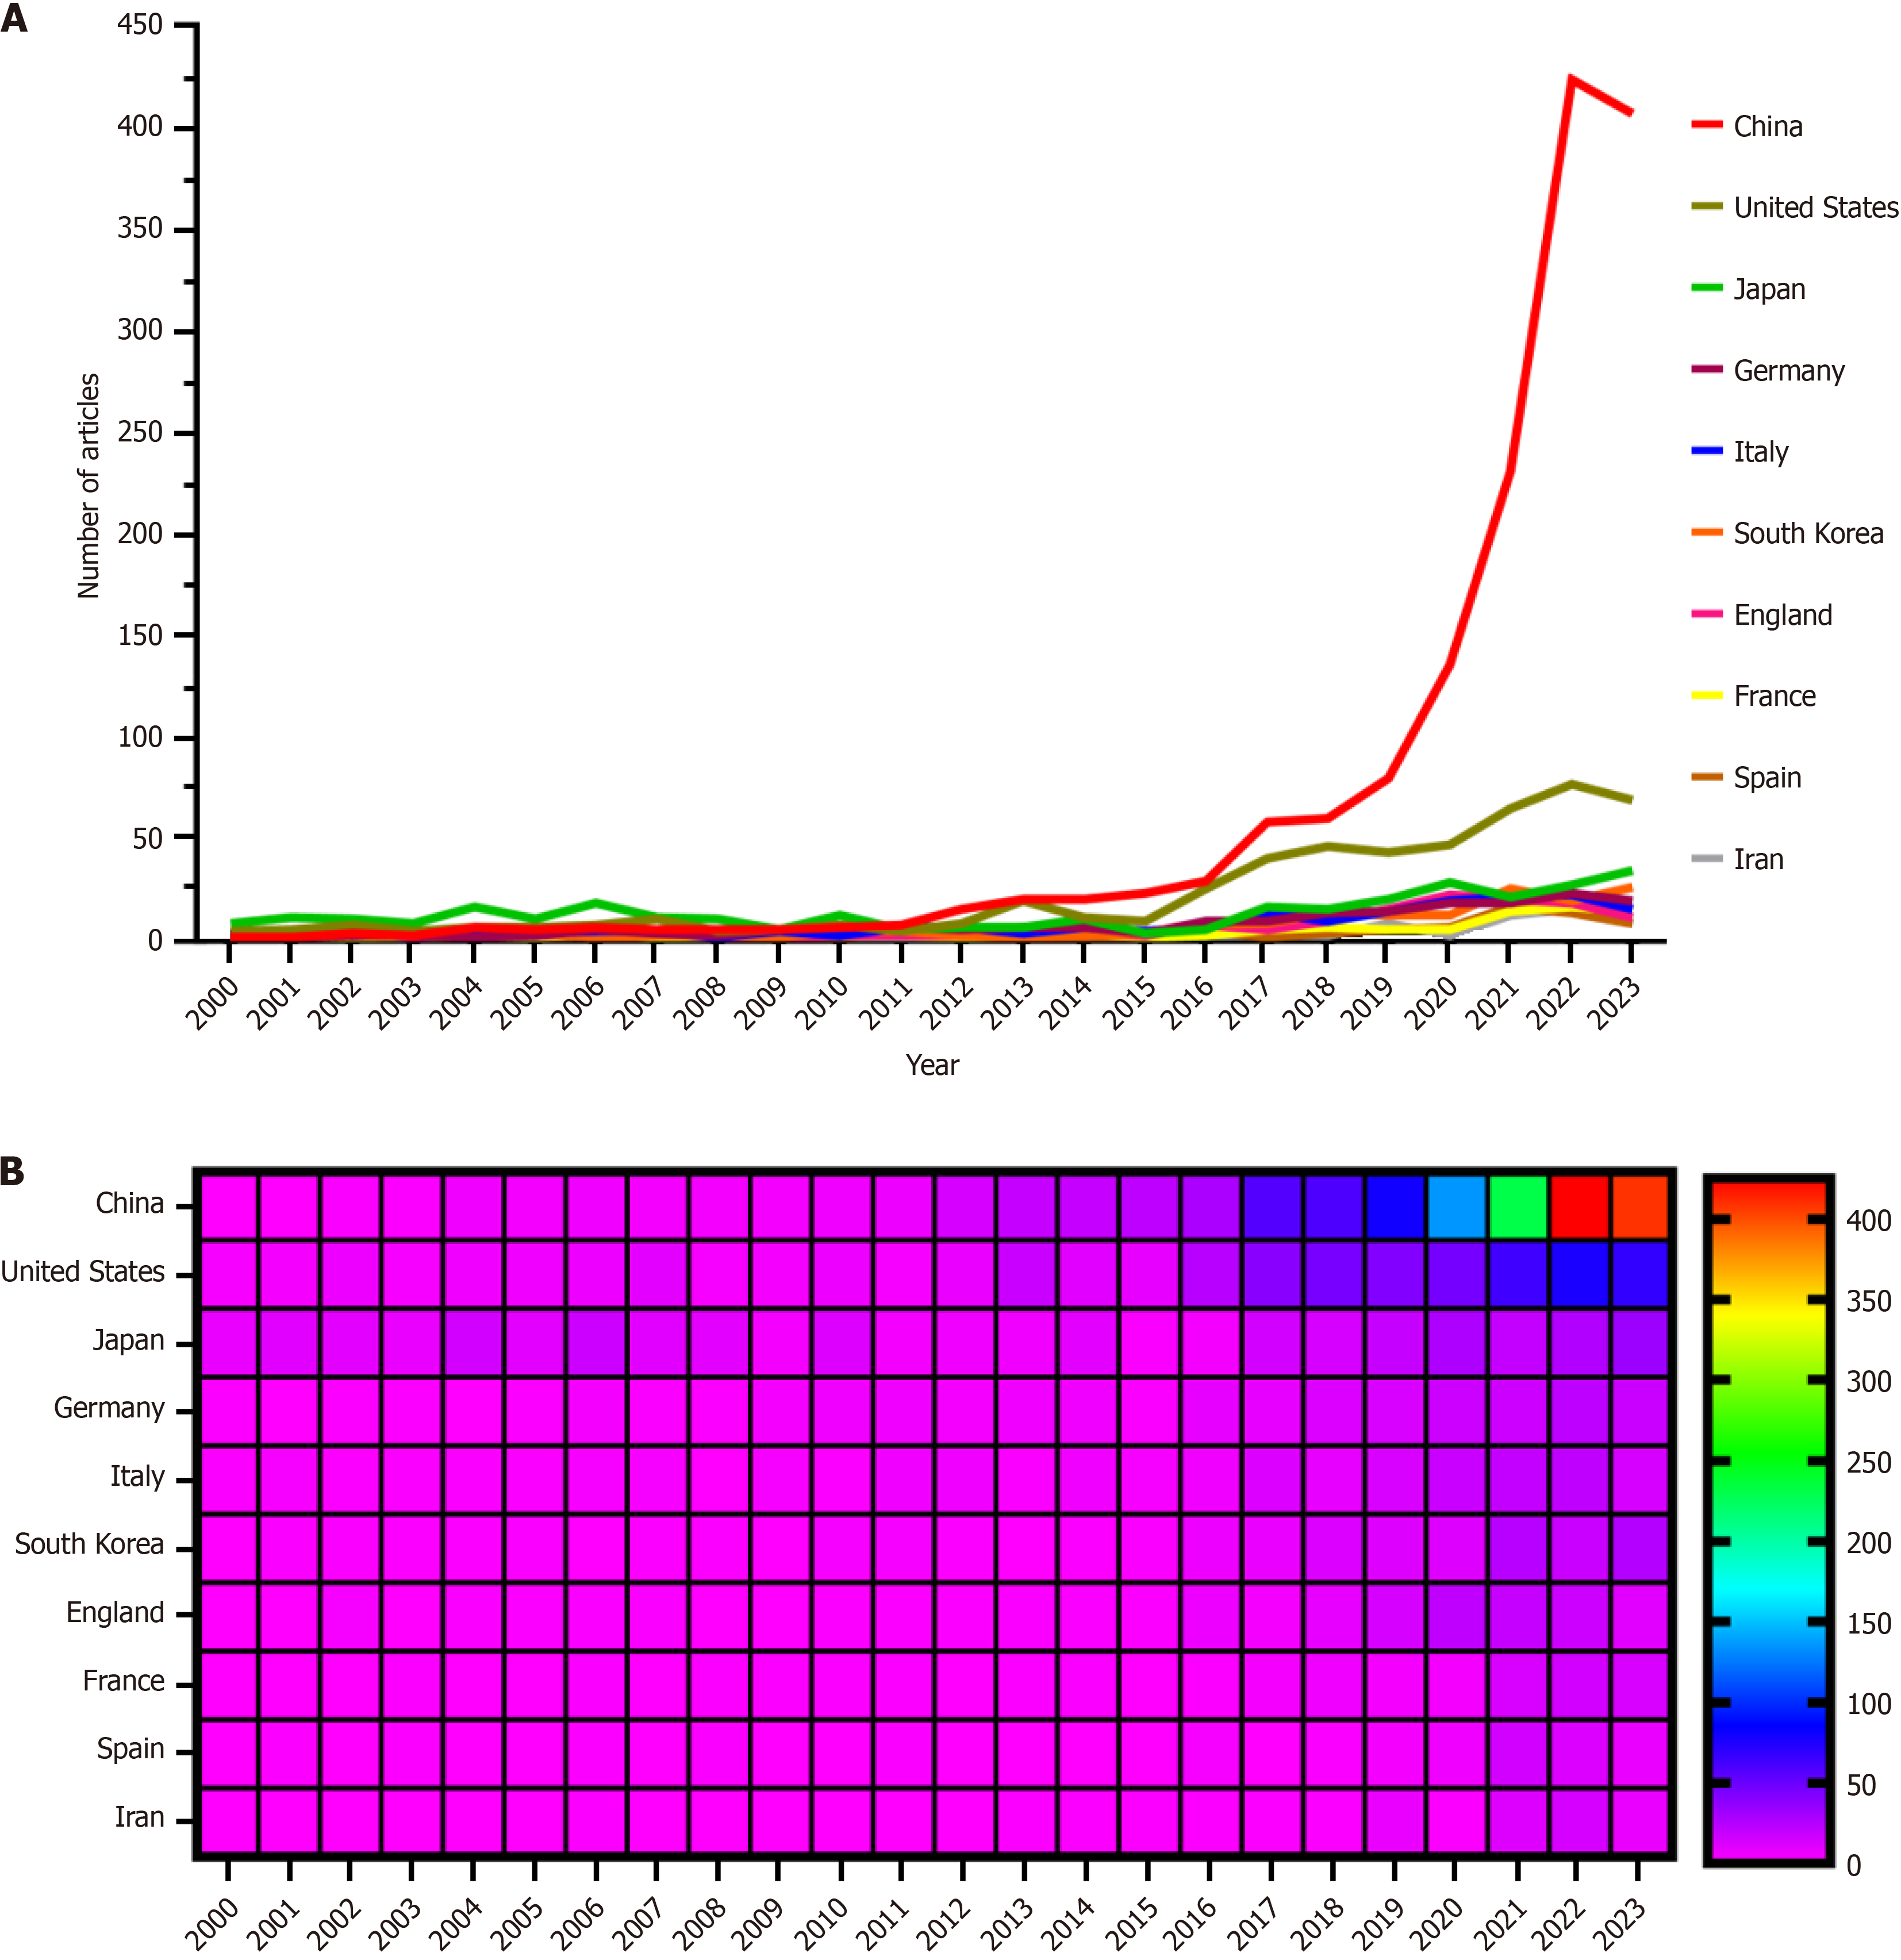
Figure 3 The annual publication volume of the top ten nations for the previous years.
A and B: The line graph (A) and heat map (B) of national publications show that the top 5 countries in this field are China, the United States, Japan, Germany, and Italy. China publishes many more articles than any other country.
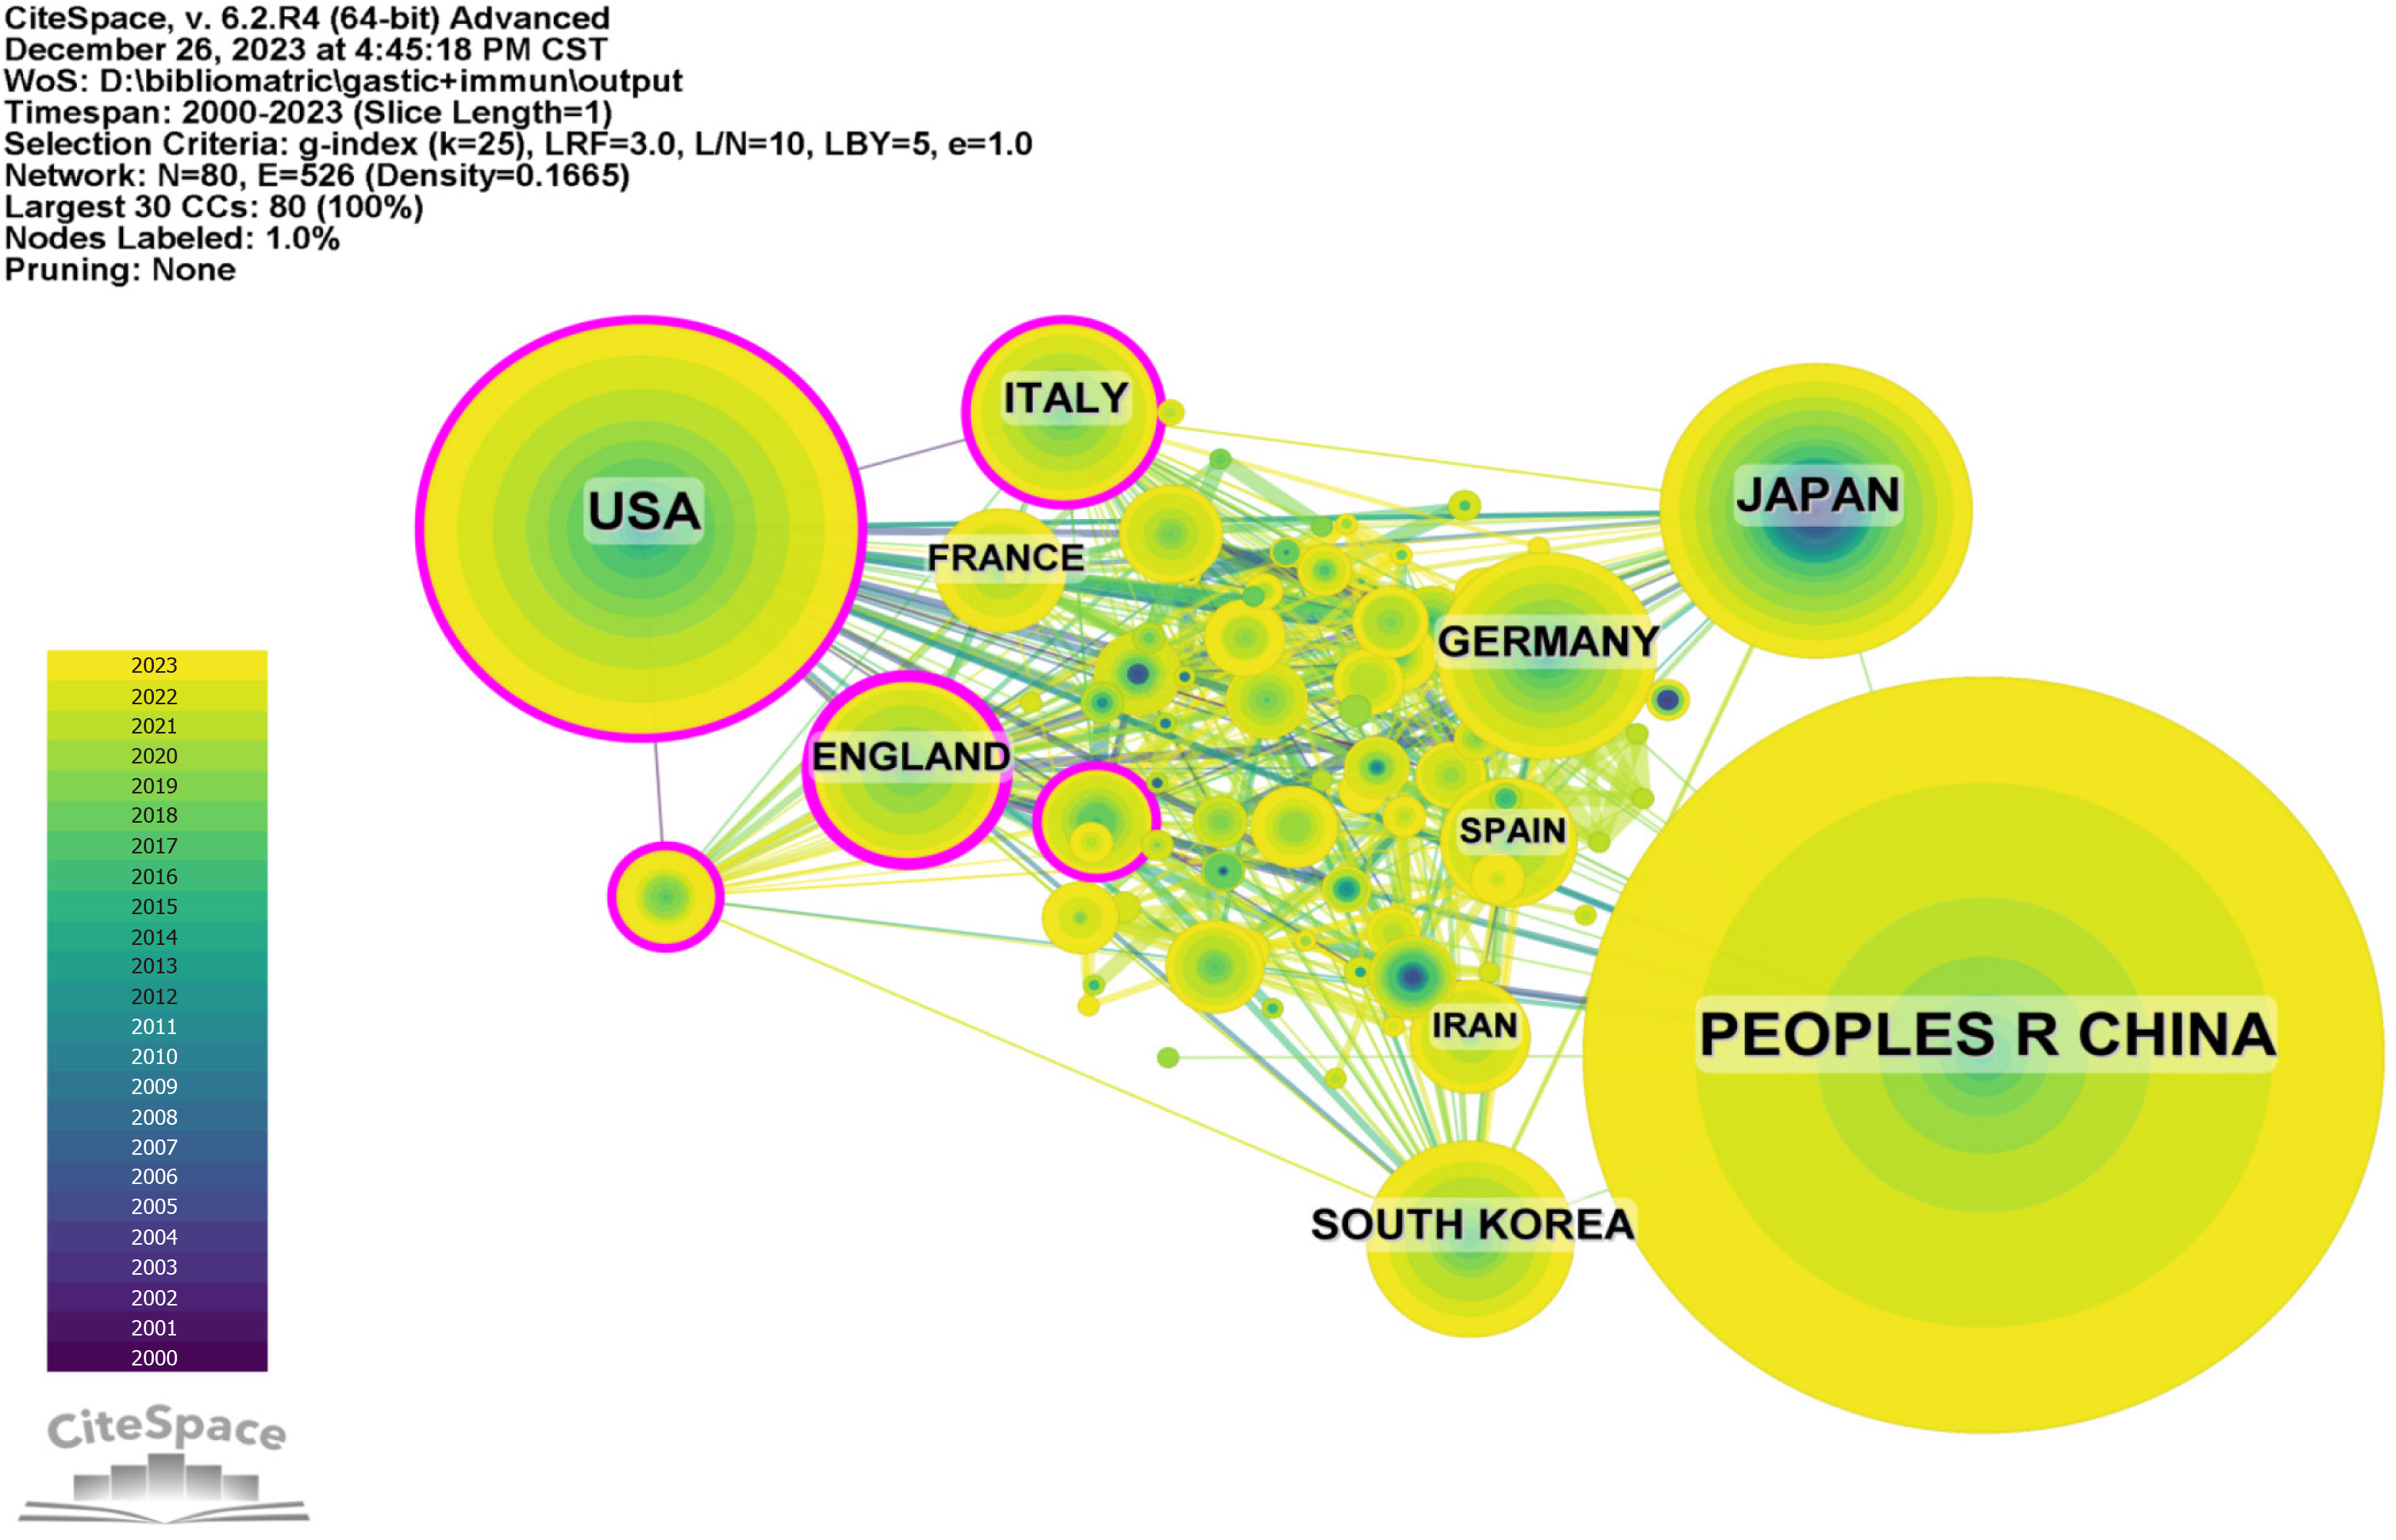
Figure 4 The network of cooperation between China and the United States is demonstrated in the cooperative network.
The United States maintains close collaborations with France, Italy, and the United Kingdom, while China's collaborations are closer with Japan, Germany, Spain, and South Korea.
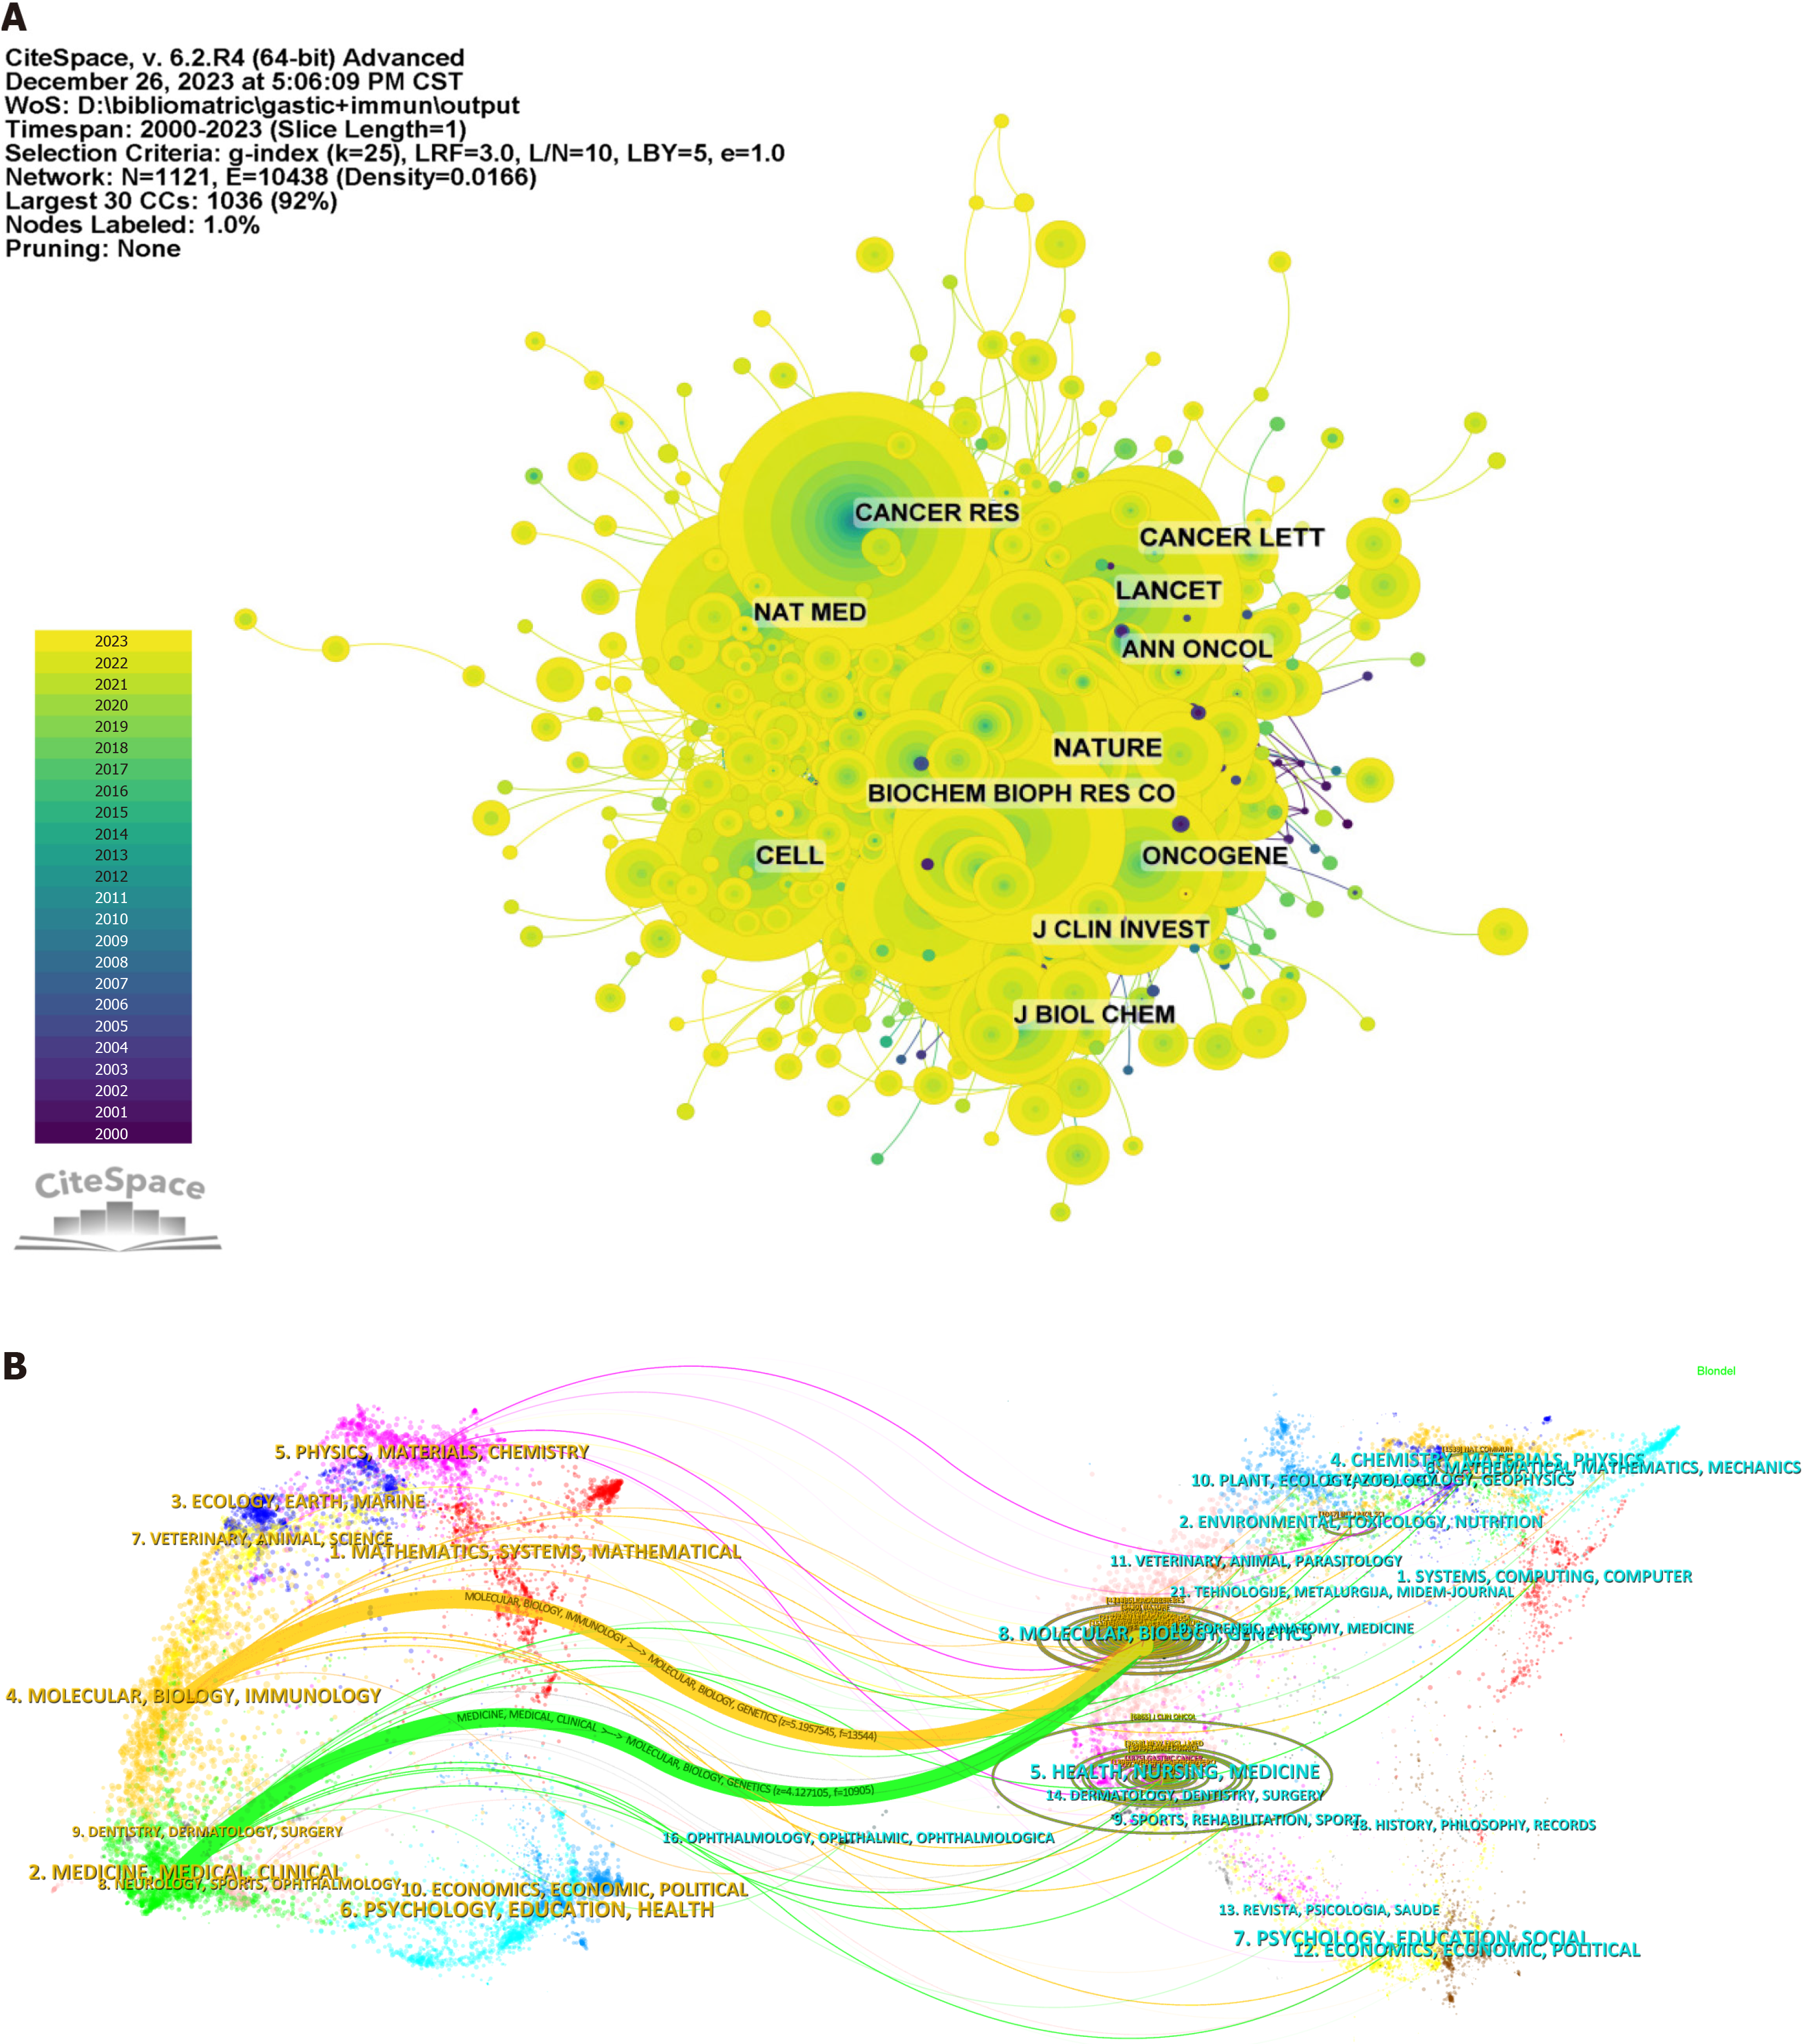
Figure 5 Visualization of journal-related statistical data.
A: The co-citation network diagram of journals visualizes the connections between the most frequently co-cited journals; B: Co-overlay map of journals. The research published in the domains of molecular biology/immunology is primarily cited by journals in the field of molecular biology/genetics, while the research in the field of medicine/medical/clinical primarily receives citations from journals in the field of molecular biology/genetics.
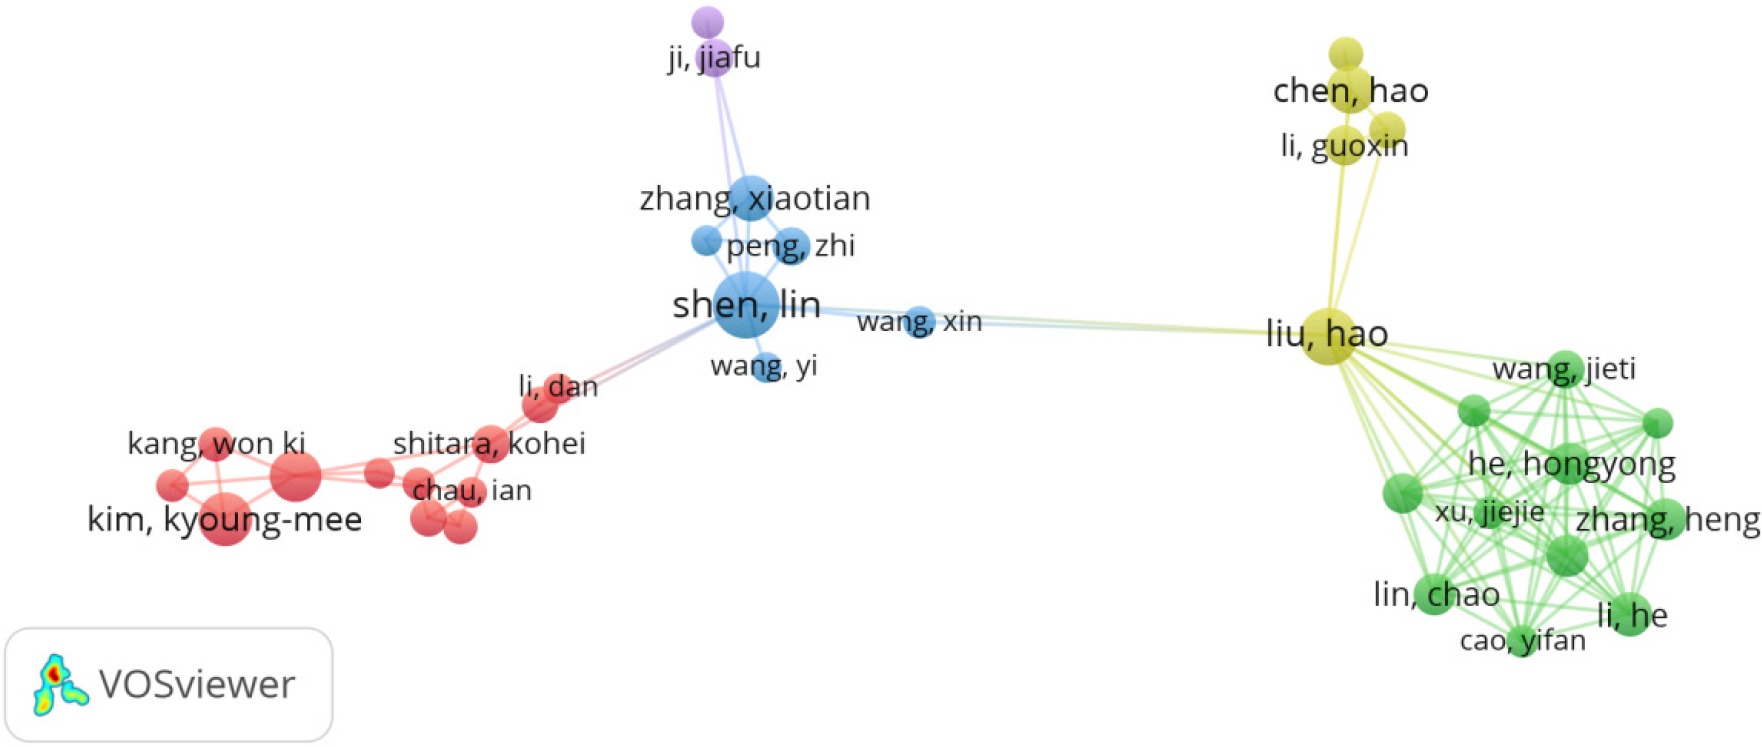
Figure 6 Author collaboration network diagram.
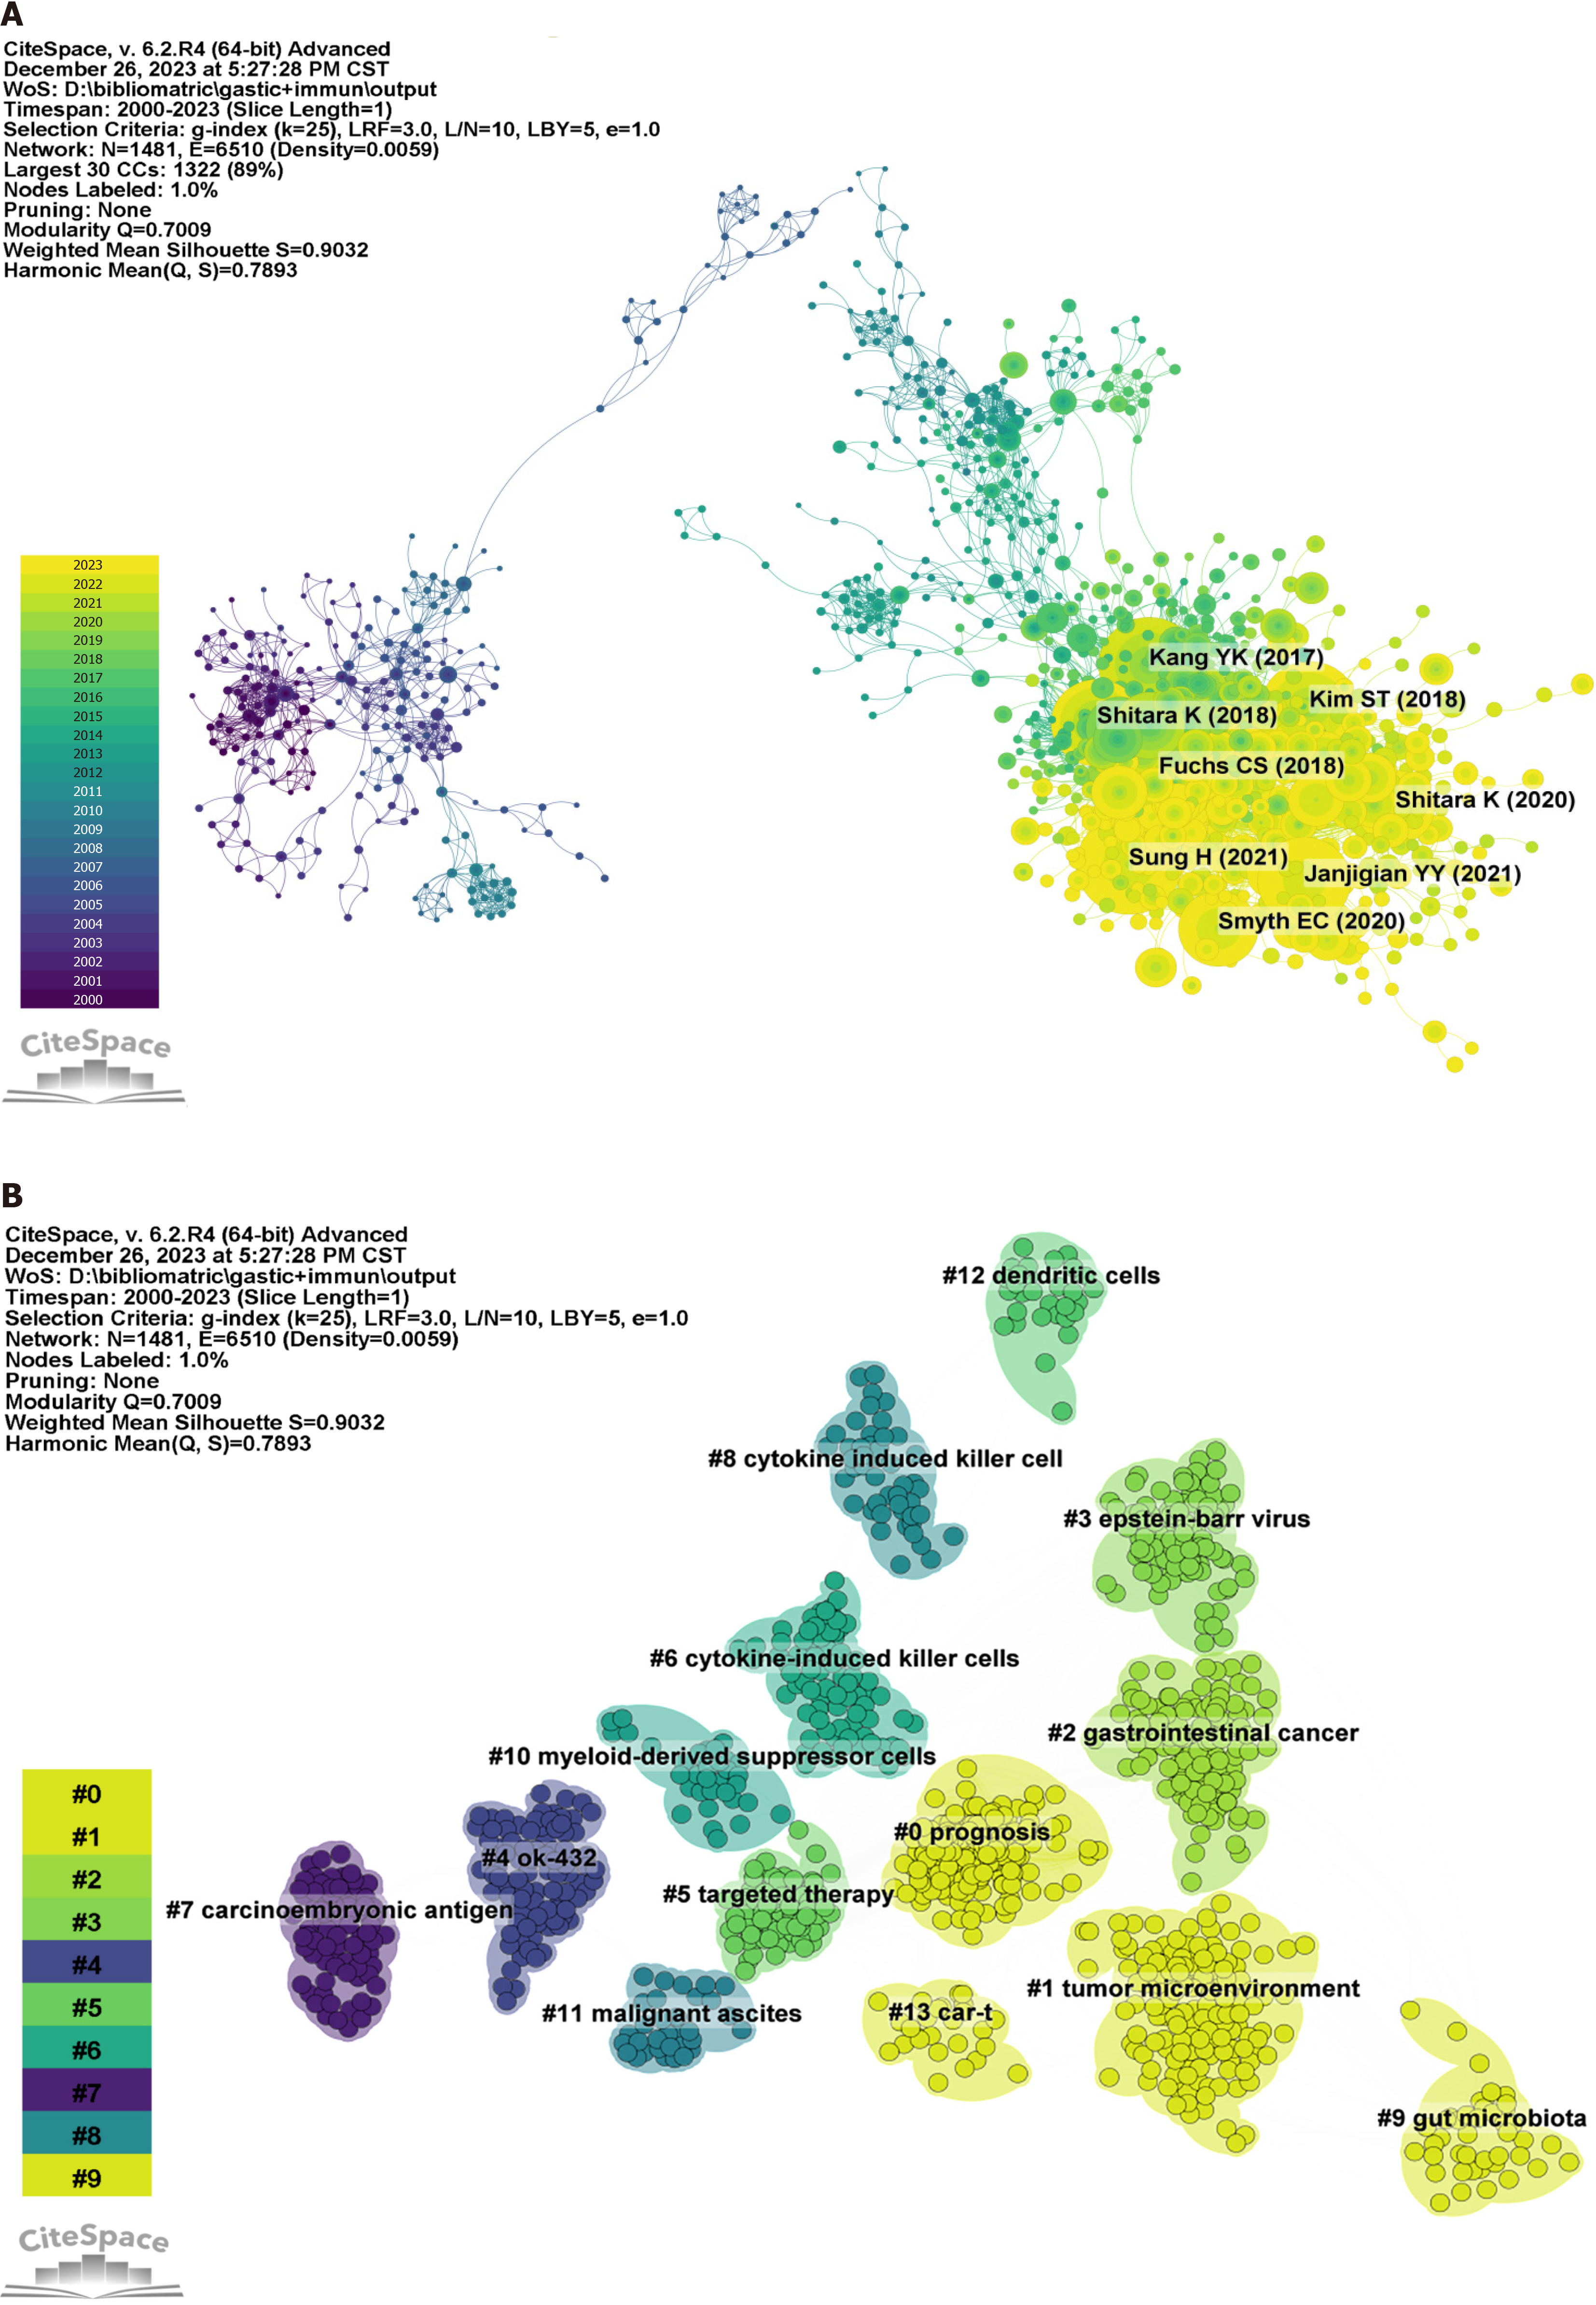
Figure 7 Statistical feature analysis of co-cited literature.
A: Co-cited literature network diagram. Using one year as a time slice, the period spans from 2000 to 2023, featuring a network with 1306 nodes and 4789 links; B: The co-citation clustering diagram conducted a cluster analysis of the topics of the cited literature, displaying 14 clusters.
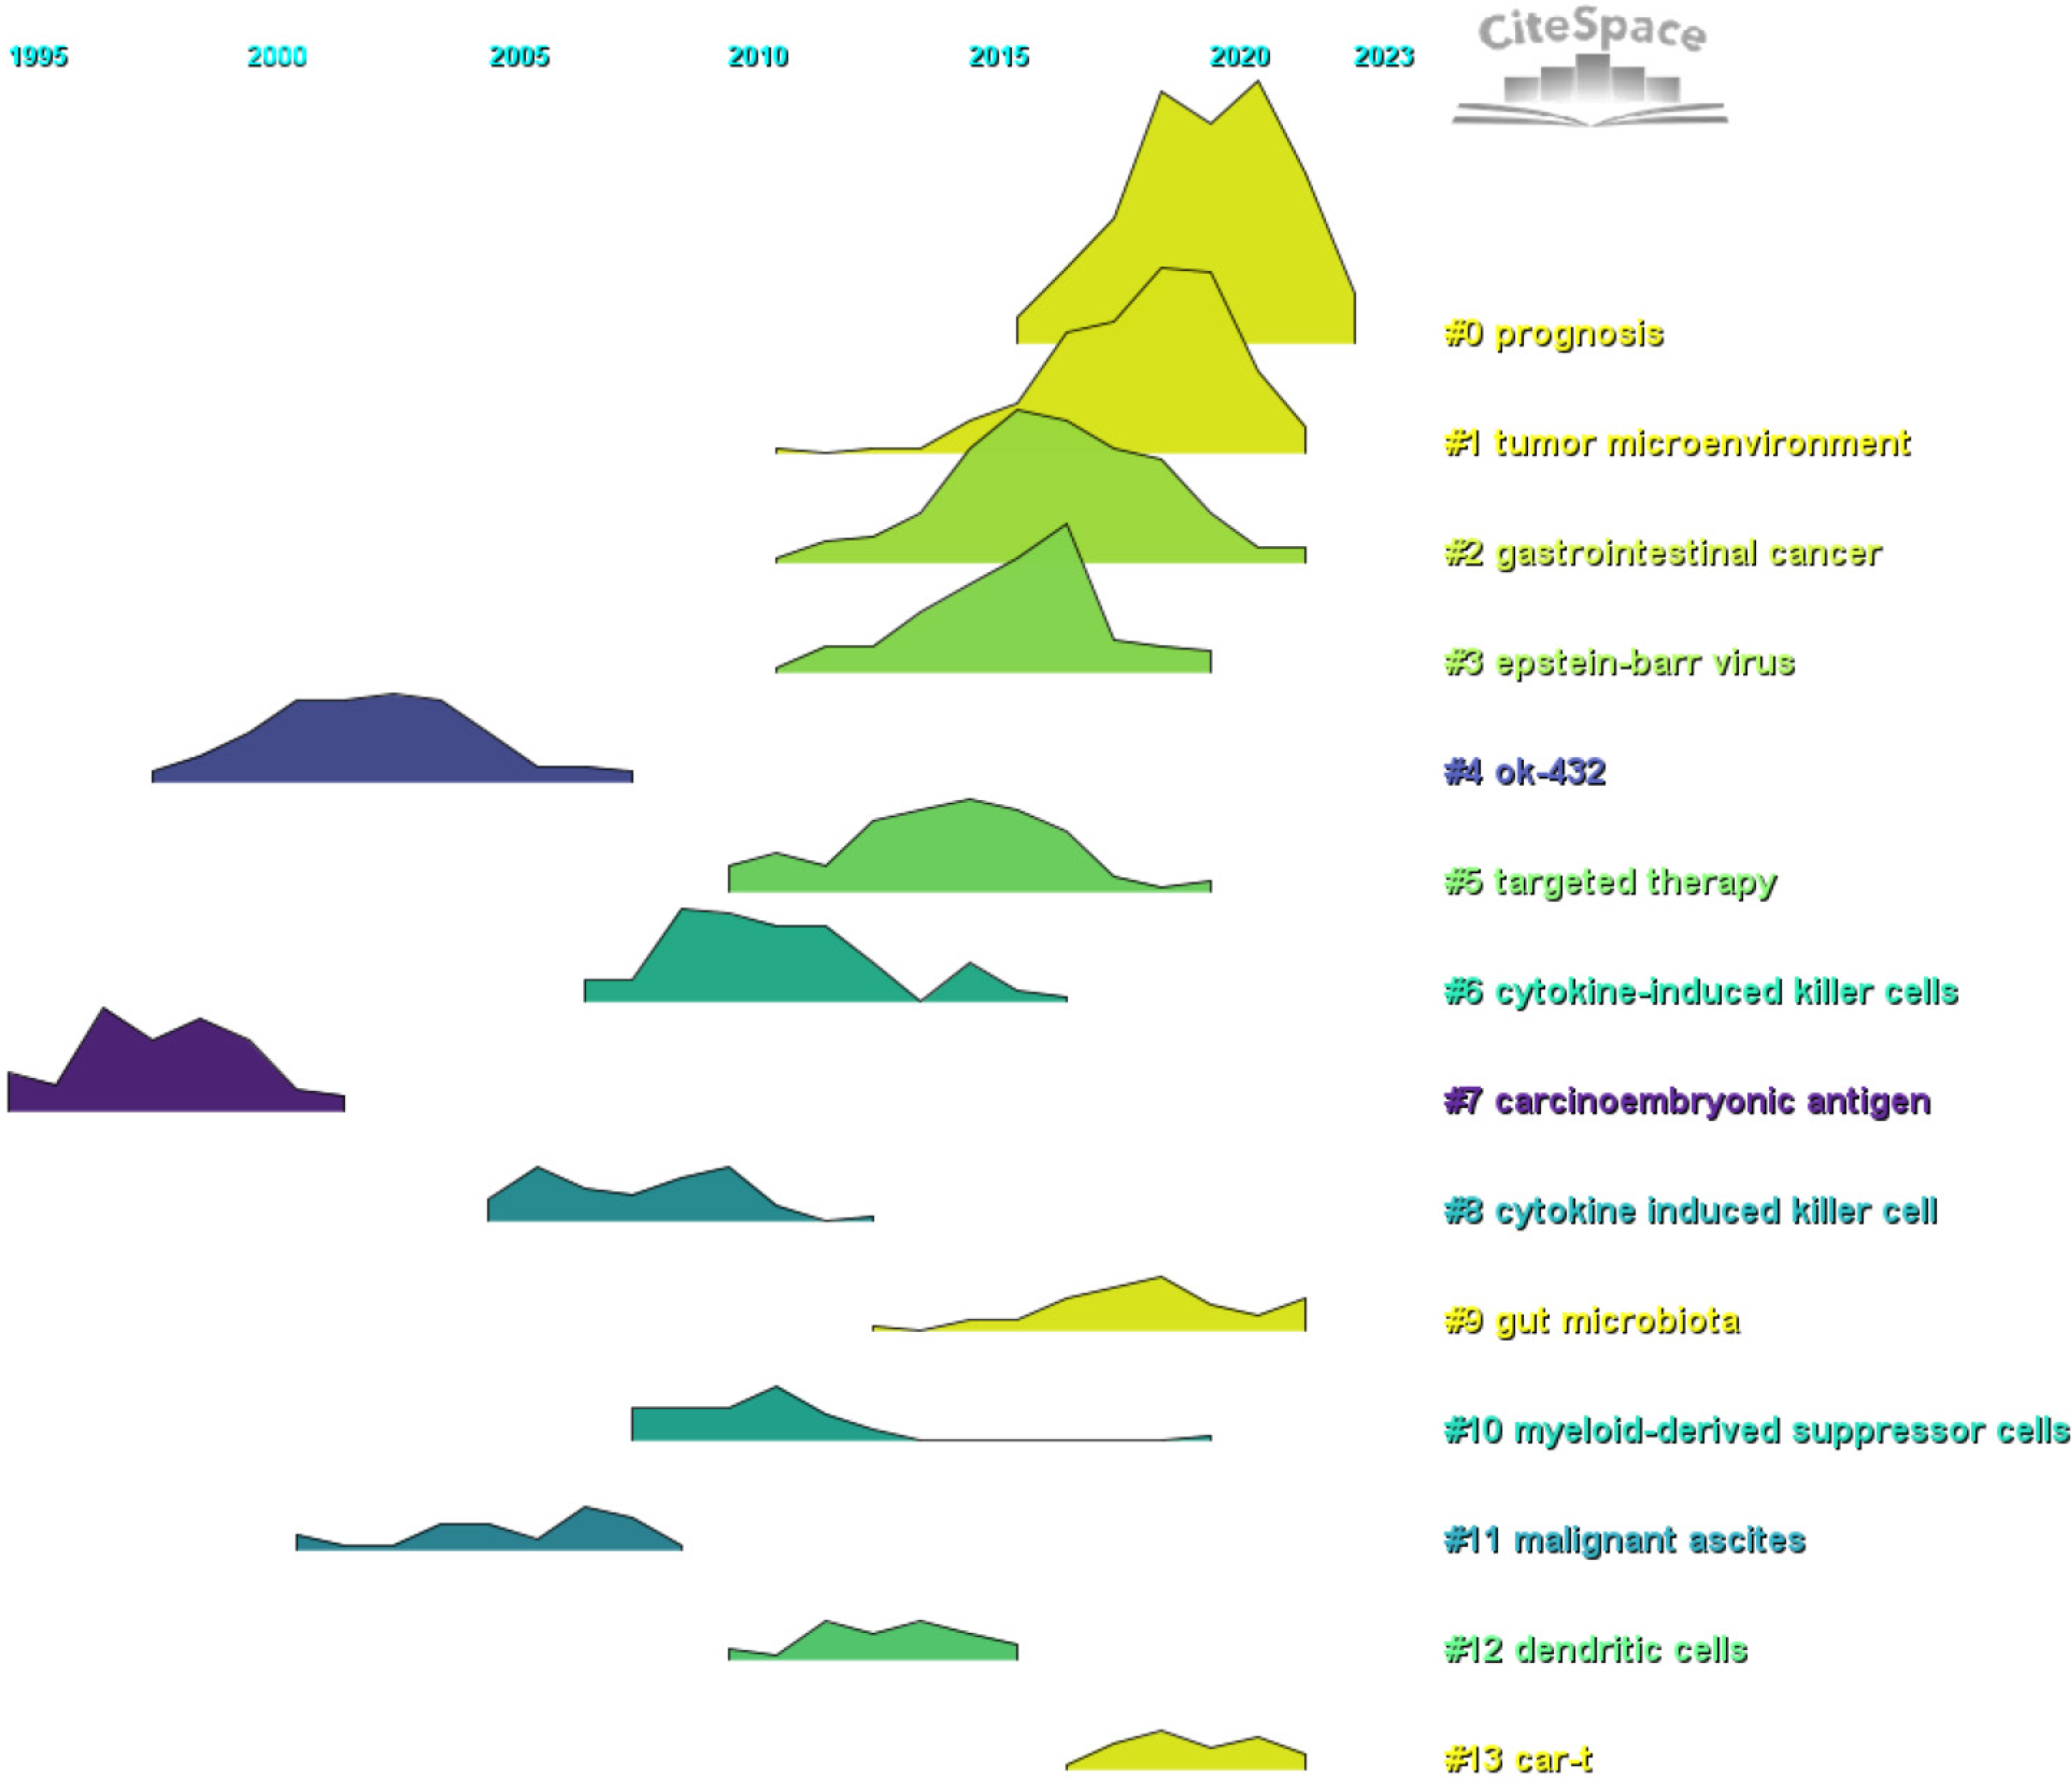
Figure 8 Volcano plot of co-cited literature.
Ok-432 (cluster 4) and carcinoembryonic antigen (cluster 7) are early research hotspots. Cytokine-induced killer cells (cluster 6), Cytokine induced killer cells (cluster 8), myeloid-derived suppressor cells (cluster 10), malignant ascites (cluster 11), and dendritic cells (cluster 12) are mid-term research hotspots. Prognosis (cluster 0), the tumor microenvironment (cluster 1), gastrointestinal cancer (cluster 2), Epstein-Barr virus (cluster 3), targeted therapy (cluster 5), gut microbiota (cluster 9), and CAR-T (cluster 13) are hot topics and trends in this field.
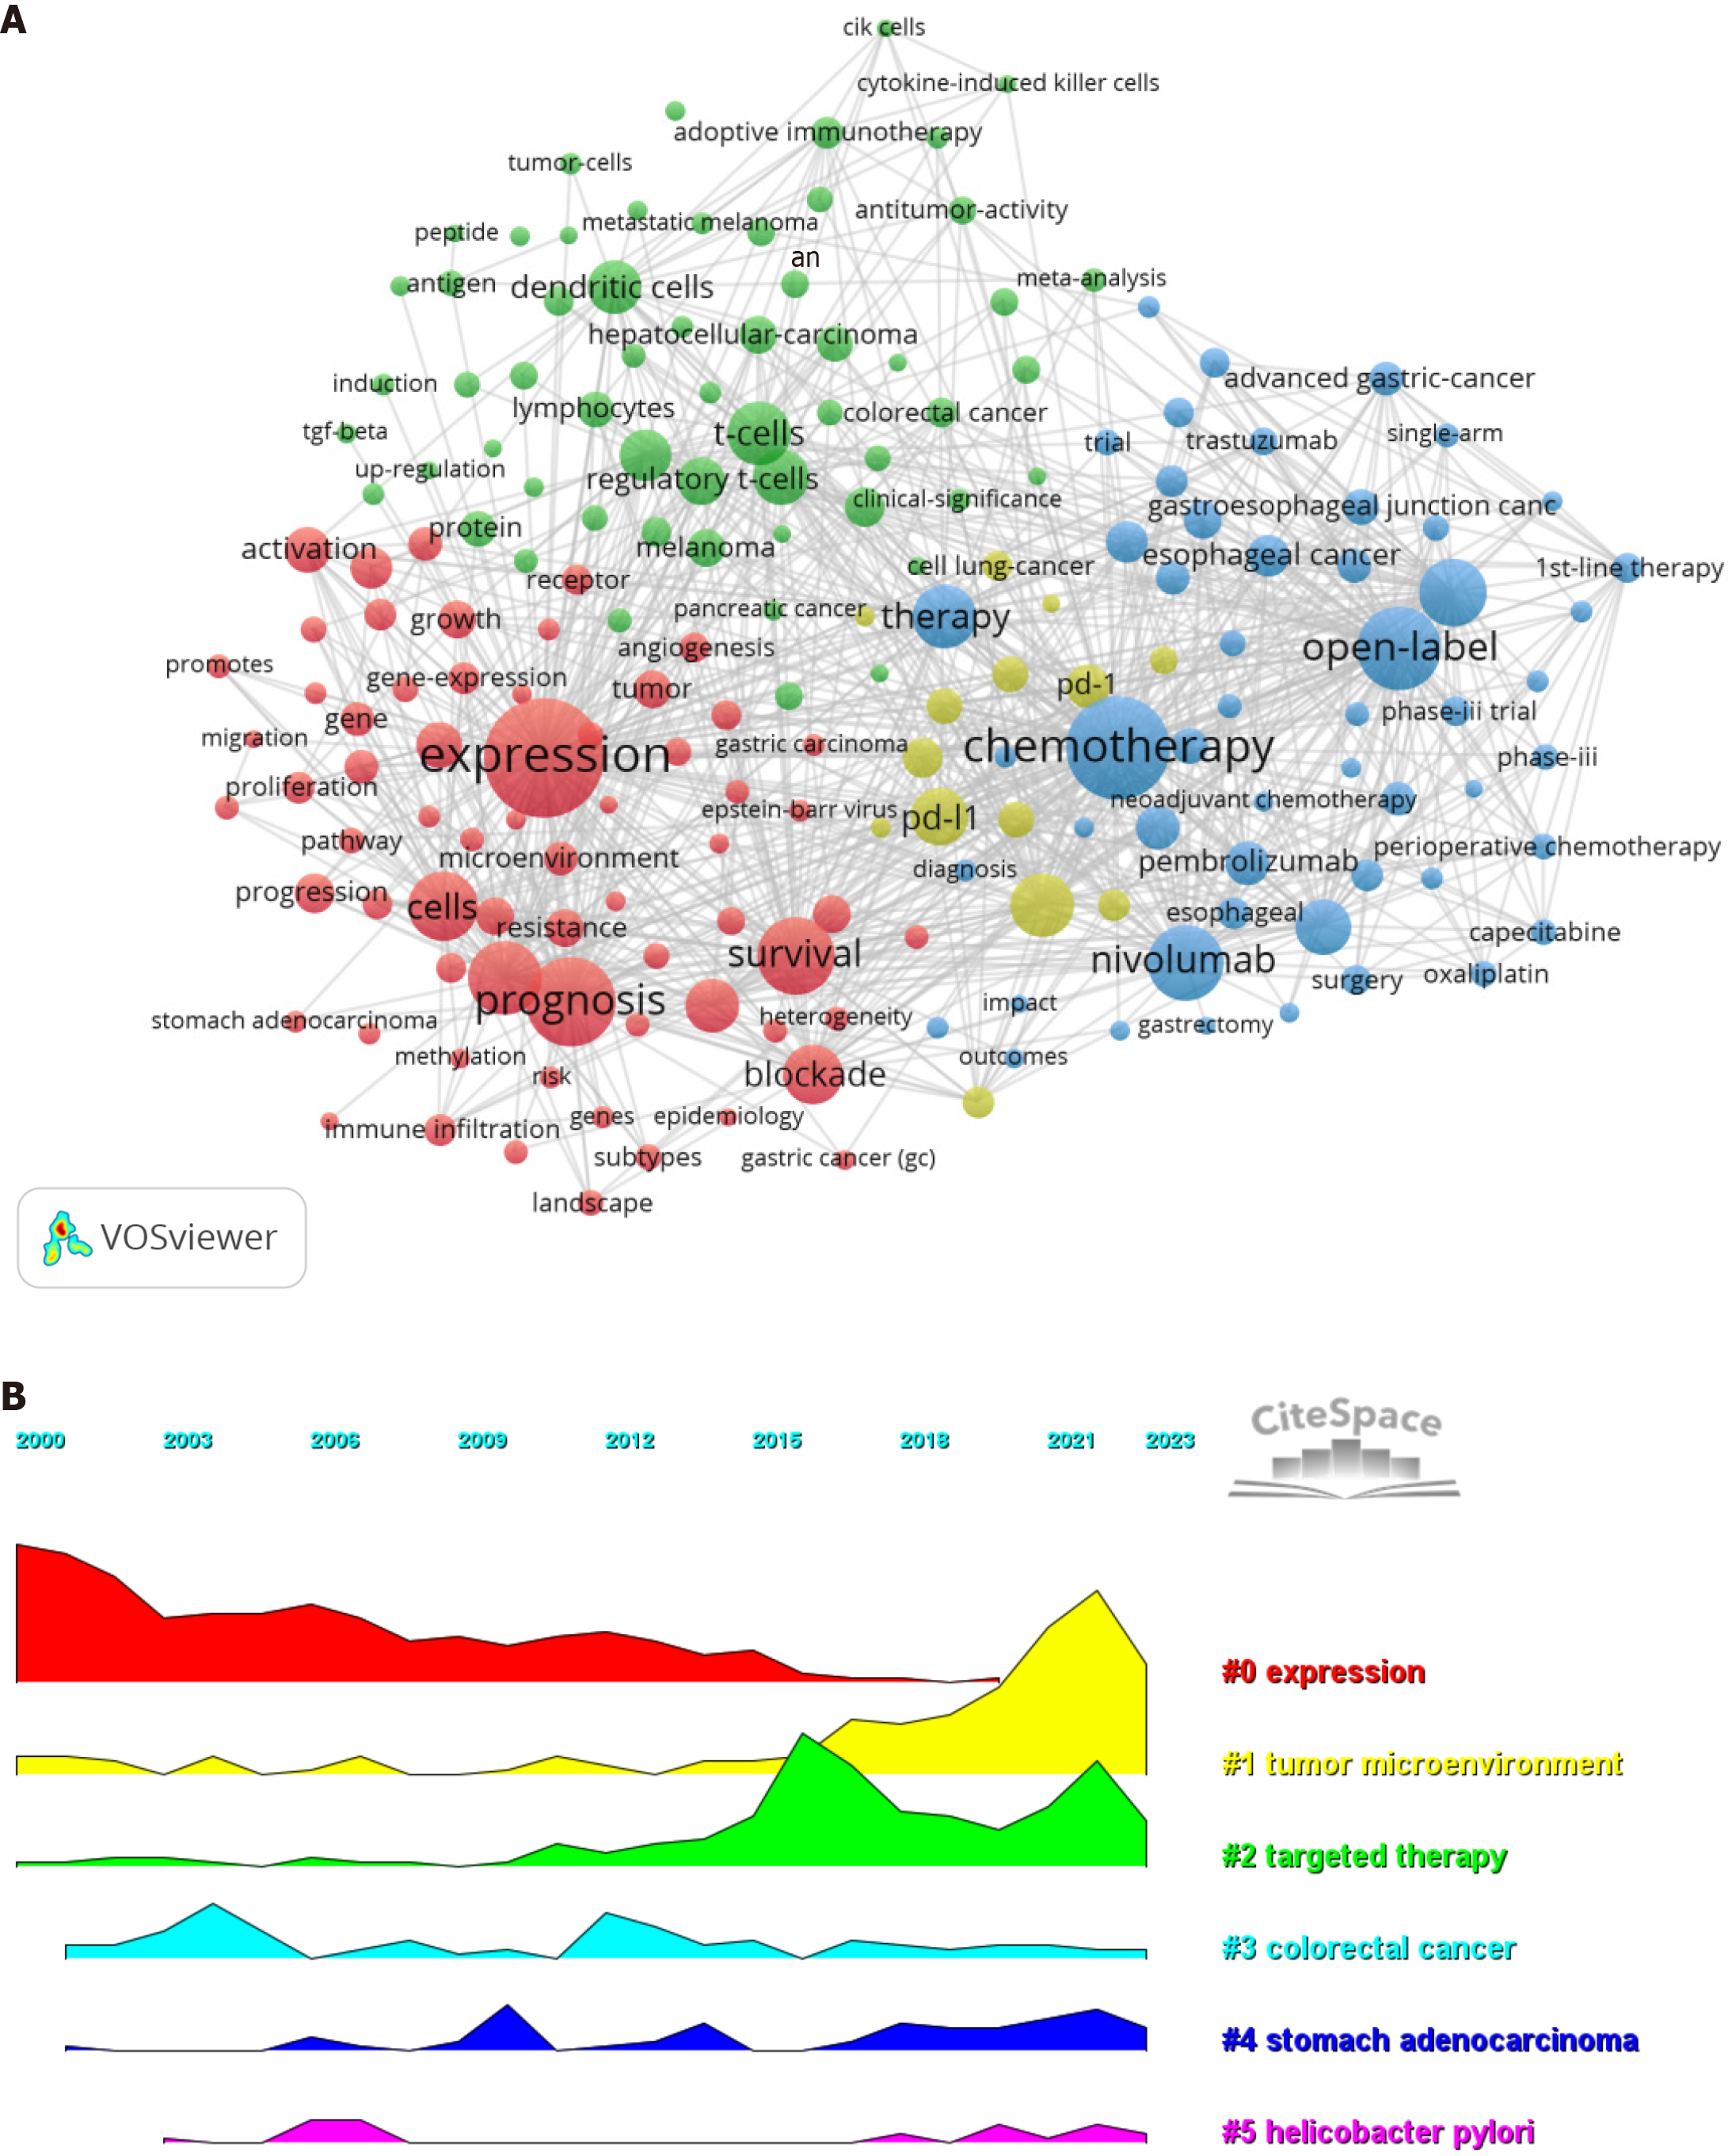
Figure 9 Keyword Analysis.
A: The high-frequency keyword network graph indicates that the most prevalent keyword is "expression", followed by "chemotherapy", "prognosis", and "open-label"; B: The keyword clustering volcano plot clearly illustrates shifts in research hotspots over time.
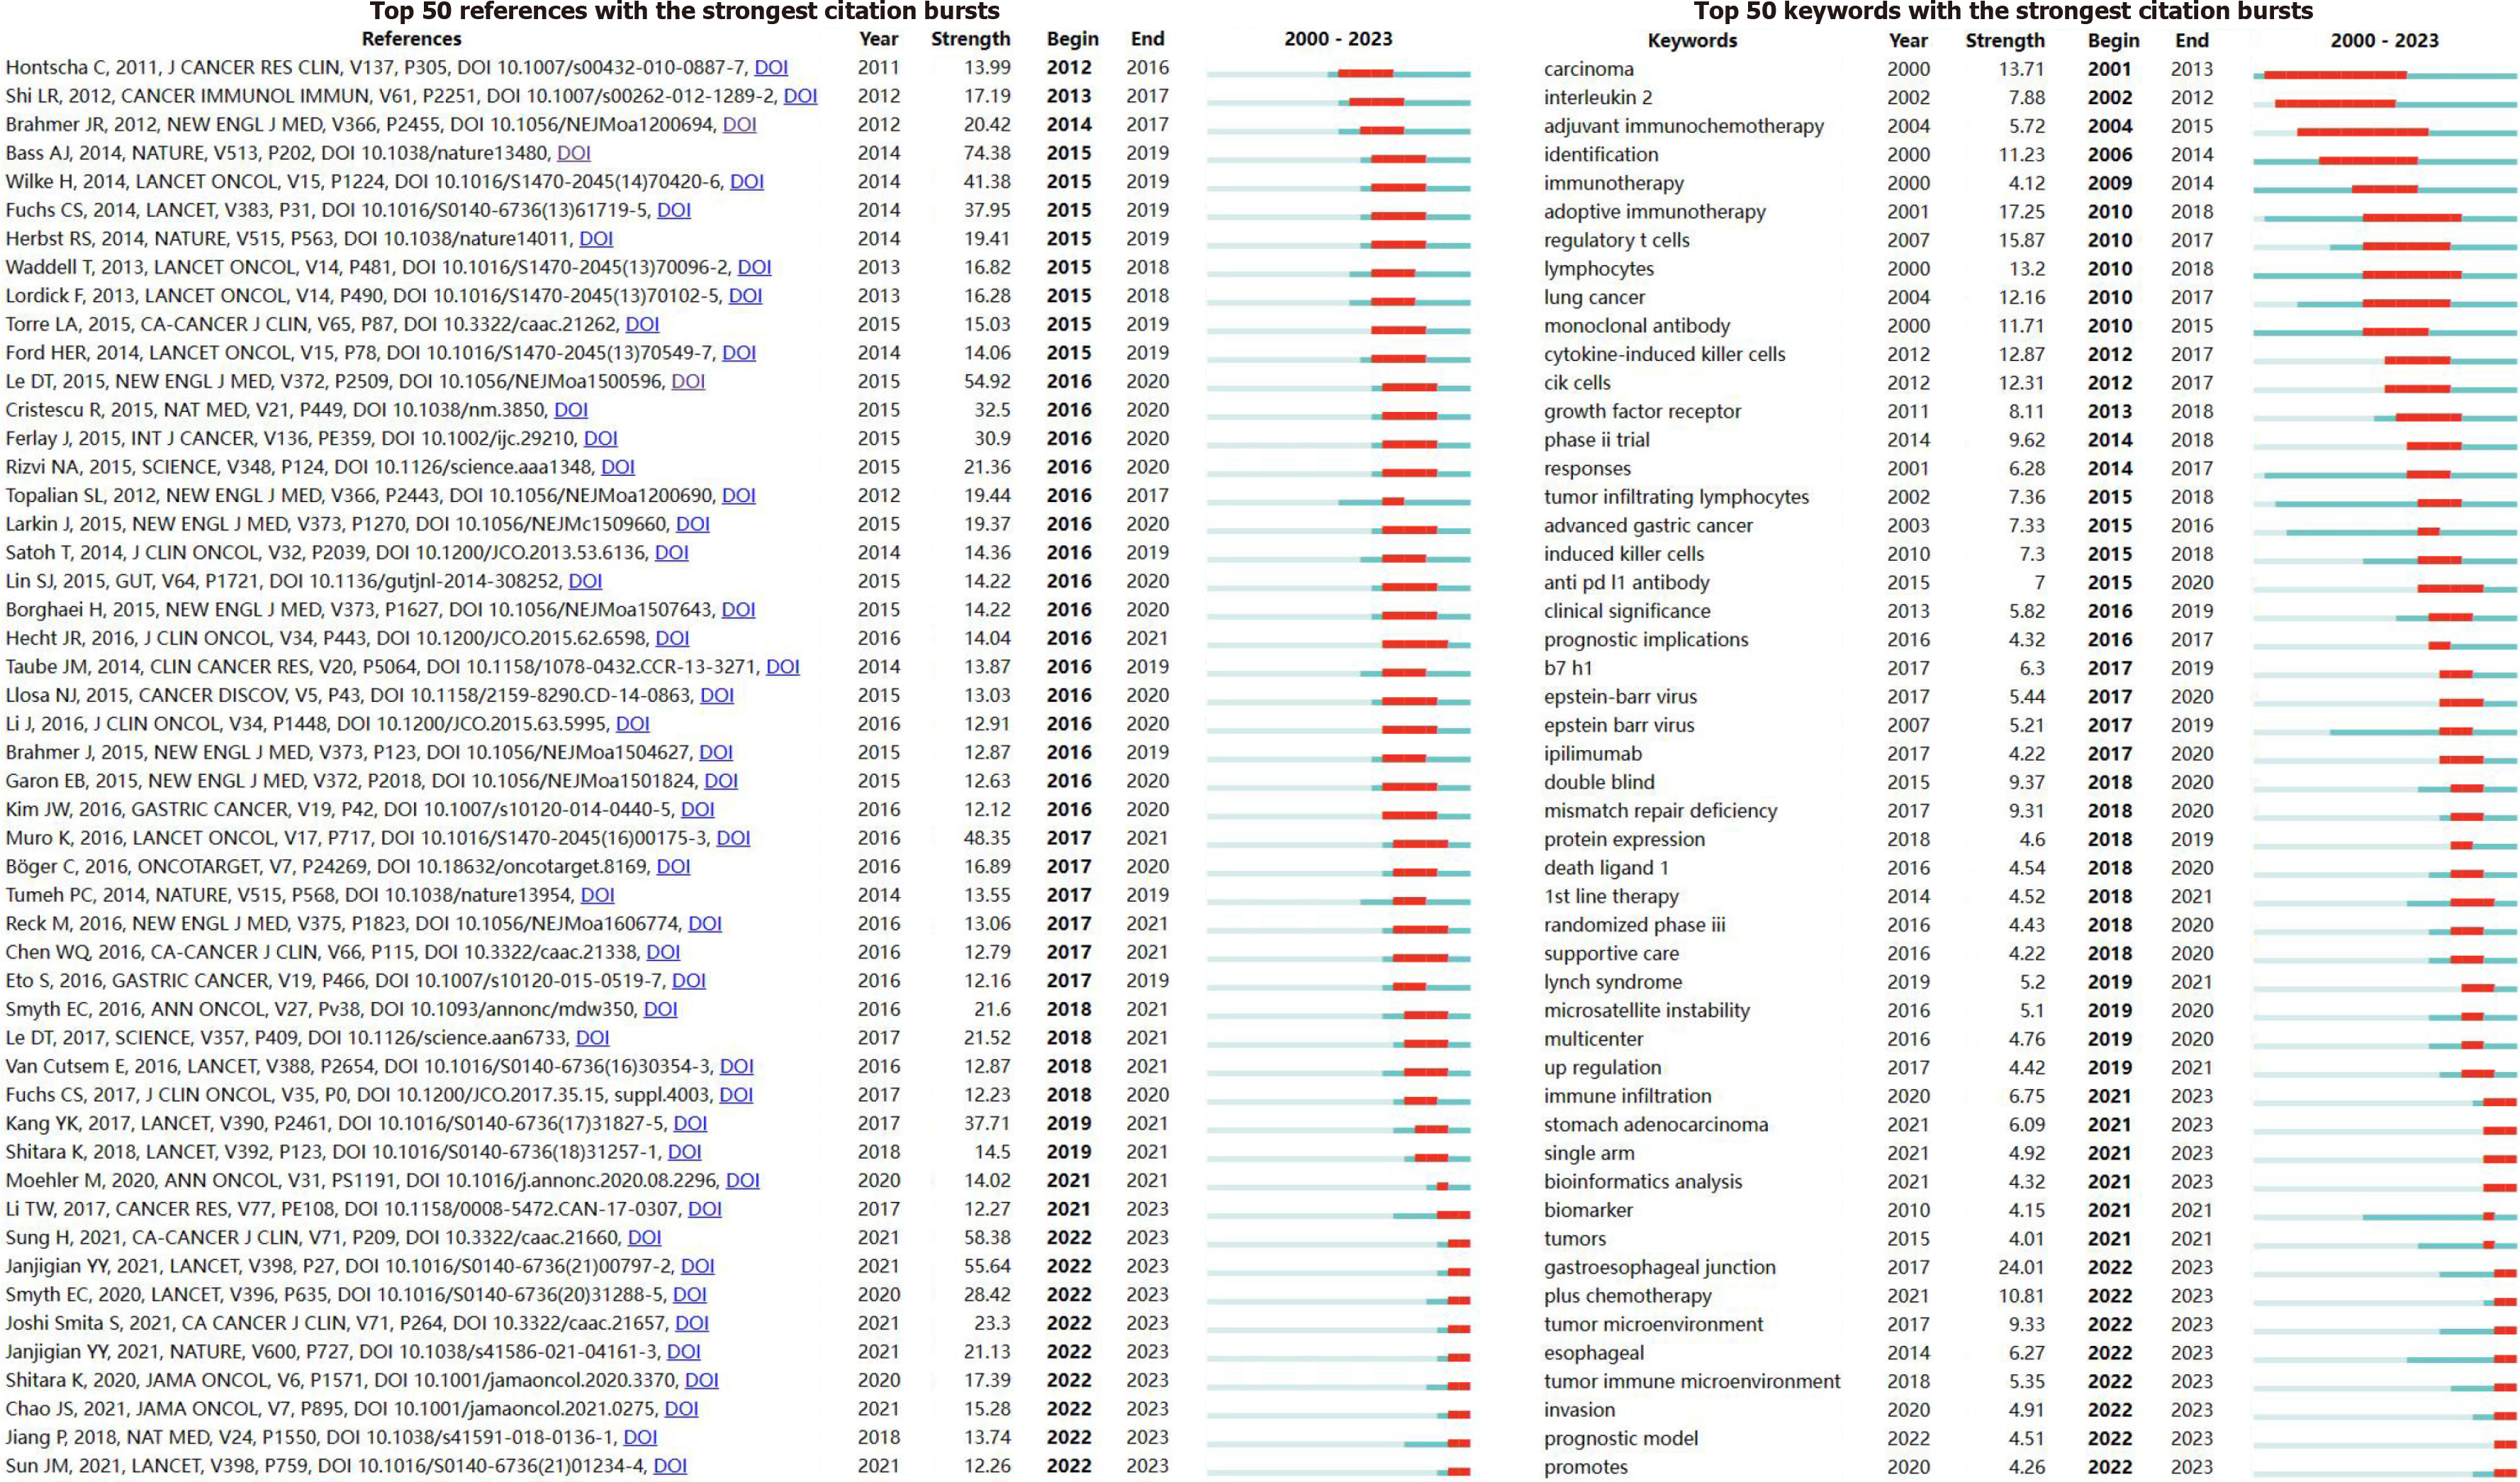
Figure 10 Cited references and keyword burst analysis.
A: Cited references burst visualization. All 50 references were published between 2000 and 2023, indicating their frequent citation over the past two decades, with 10 of these papers currently experiencing peak in terms of citations; B: The keyword burst visualization indicates that "gastroesophageal junction", " adoptive immunotherapy" and "regulation of T cells" are three current research hotspots.
- Citation: Yuan Z, Wang JH, Cui H, Wang SY, Wei B, Cui JX. Mapping the landscape of gastric cancer immunotherapy: Bibliometric insights into advances and hotspots. World J Gastrointest Oncol 2025; 17(3): 100997
- URL: https://www.wjgnet.com/1948-5204/full/v17/i3/100997.htm
- DOI: https://dx.doi.org/10.4251/wjgo.v17.i3.100997


