Copyright
©The Author(s) 2025.
World J Gastrointest Oncol. Feb 15, 2025; 17(2): 98927
Published online Feb 15, 2025. doi: 10.4251/wjgo.v17.i2.98927
Published online Feb 15, 2025. doi: 10.4251/wjgo.v17.i2.98927
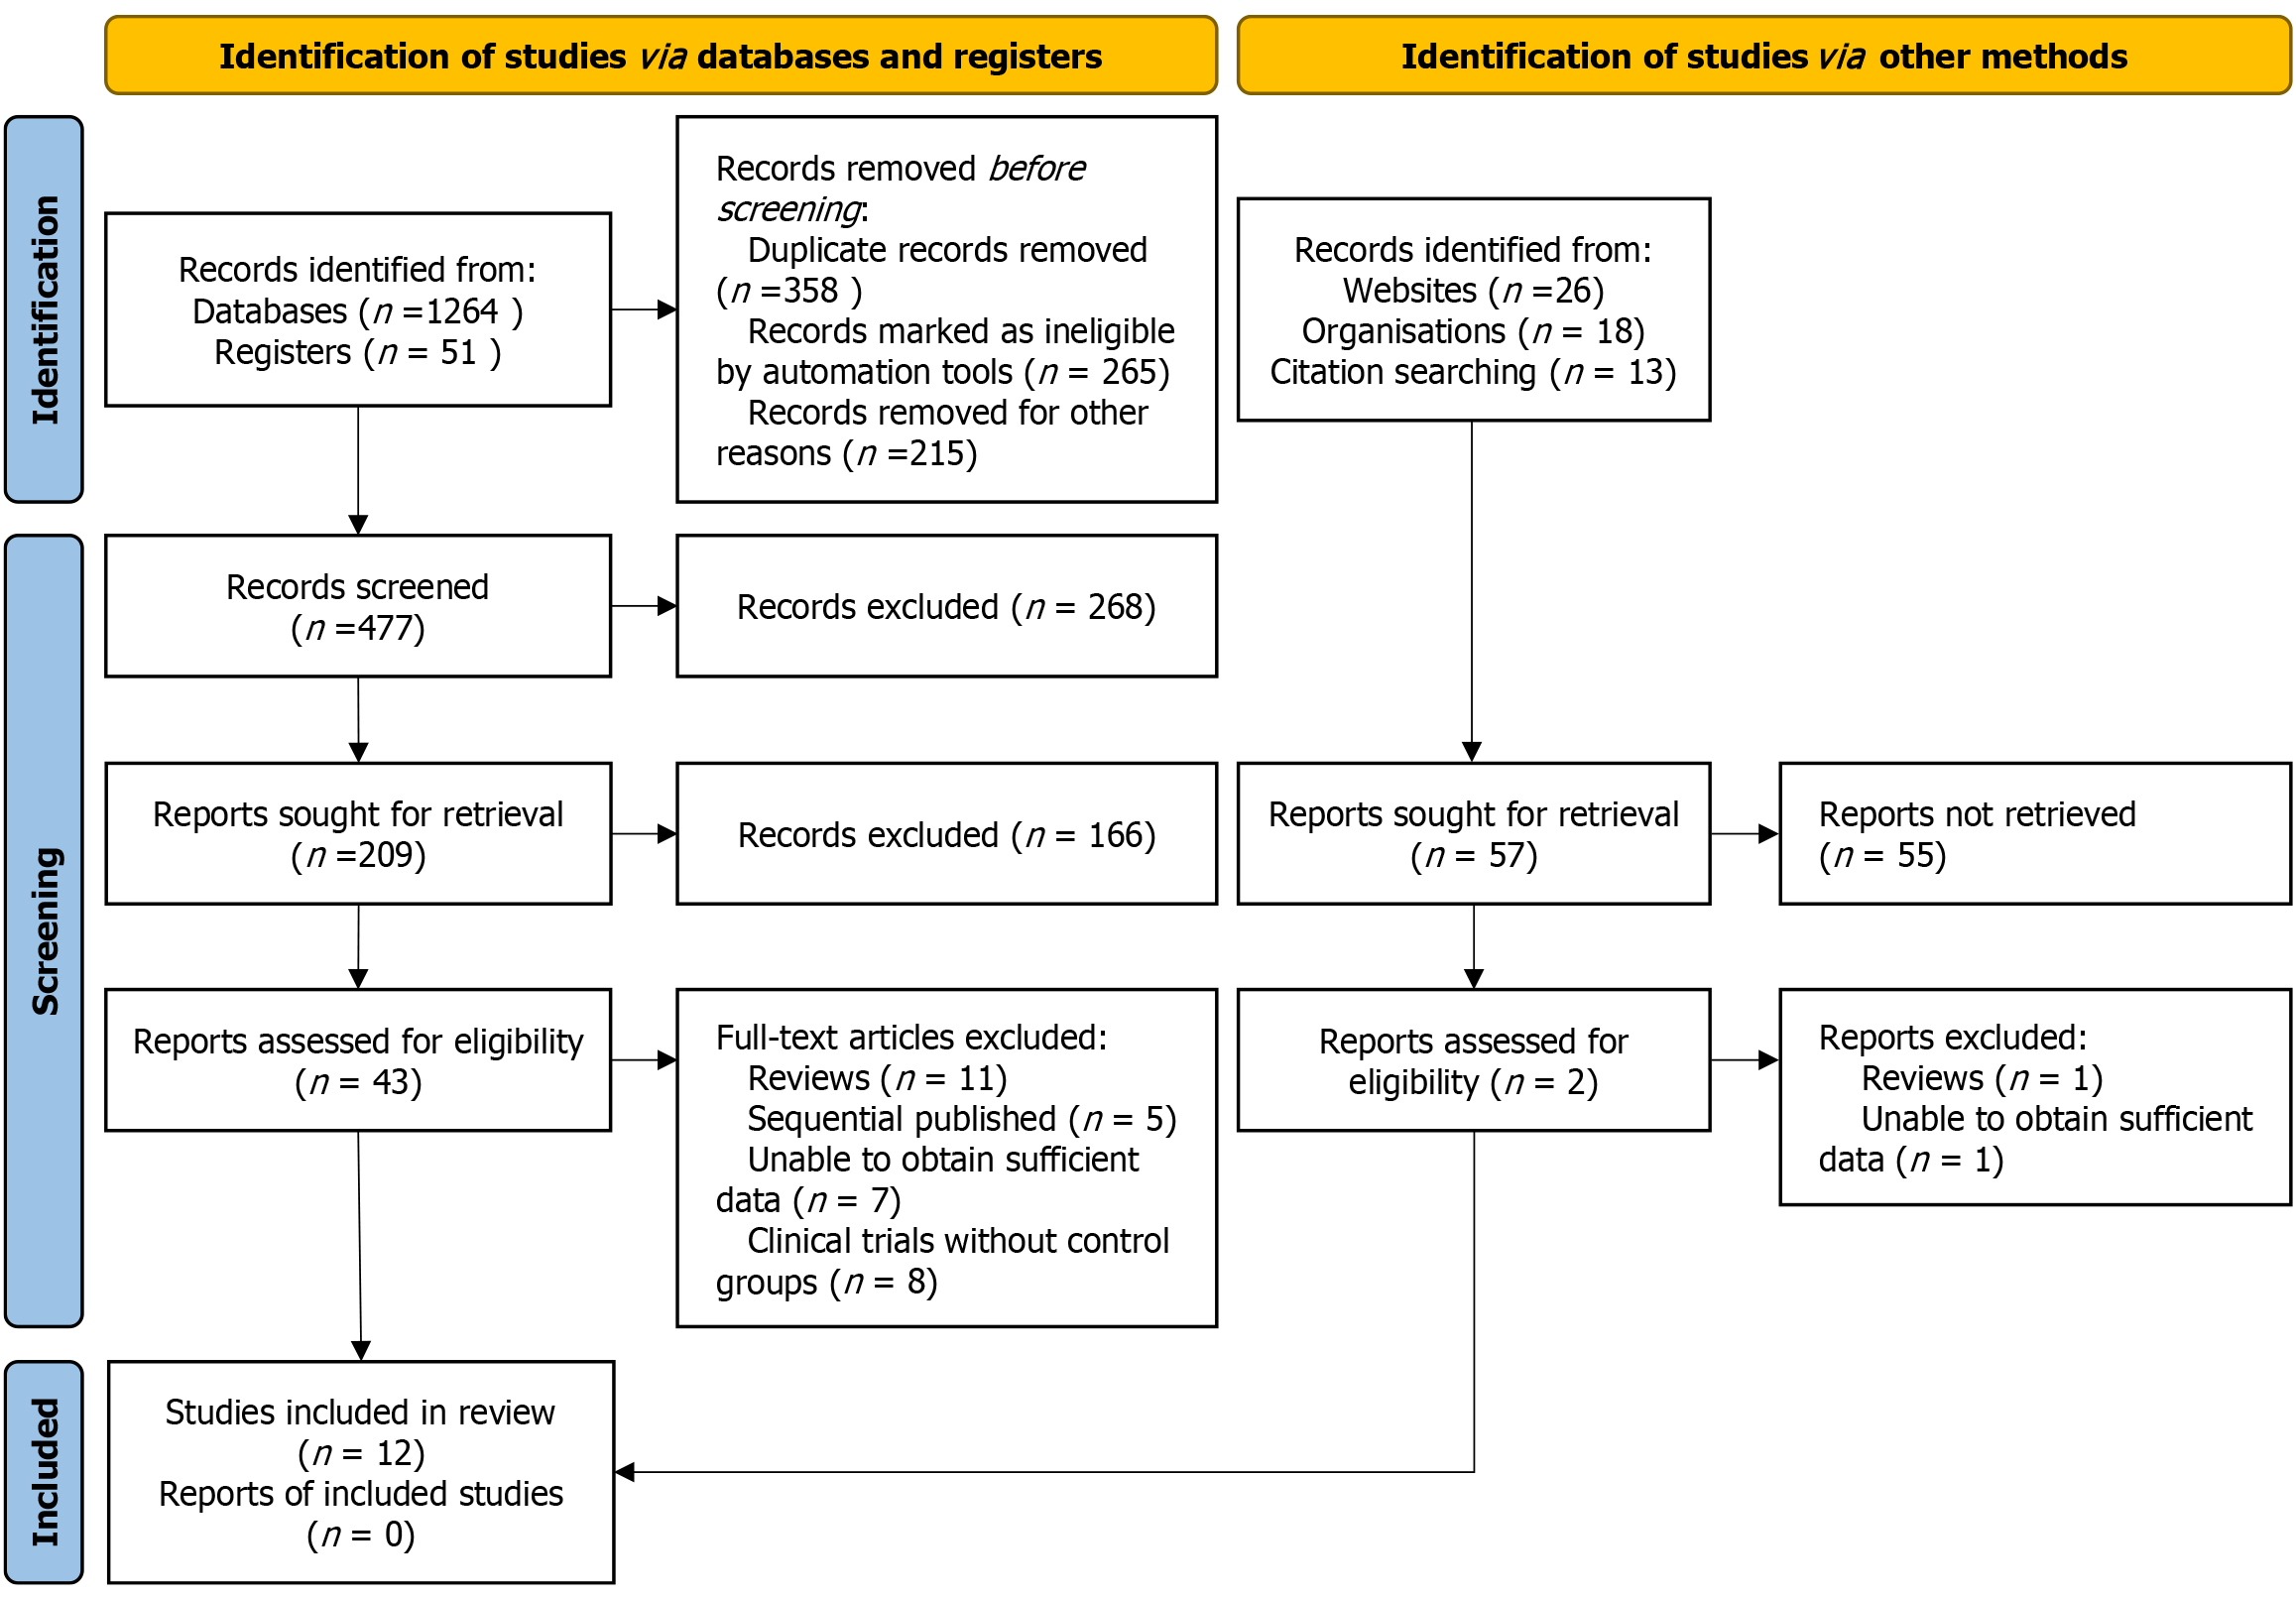
Figure 1
Study selection flow diagram for the meta-analysis.
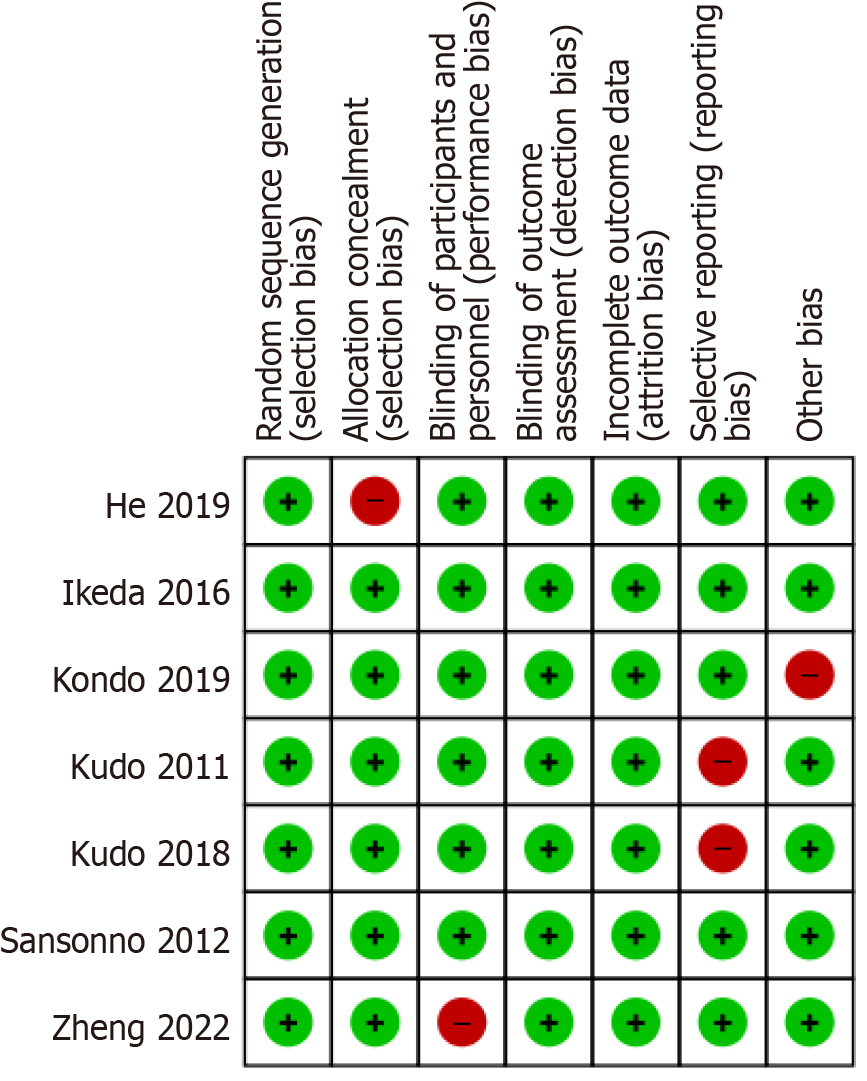
Figure 2
Risk of bias evaluation for included studies, depicted with red indicating high risk and green indicating low risk.
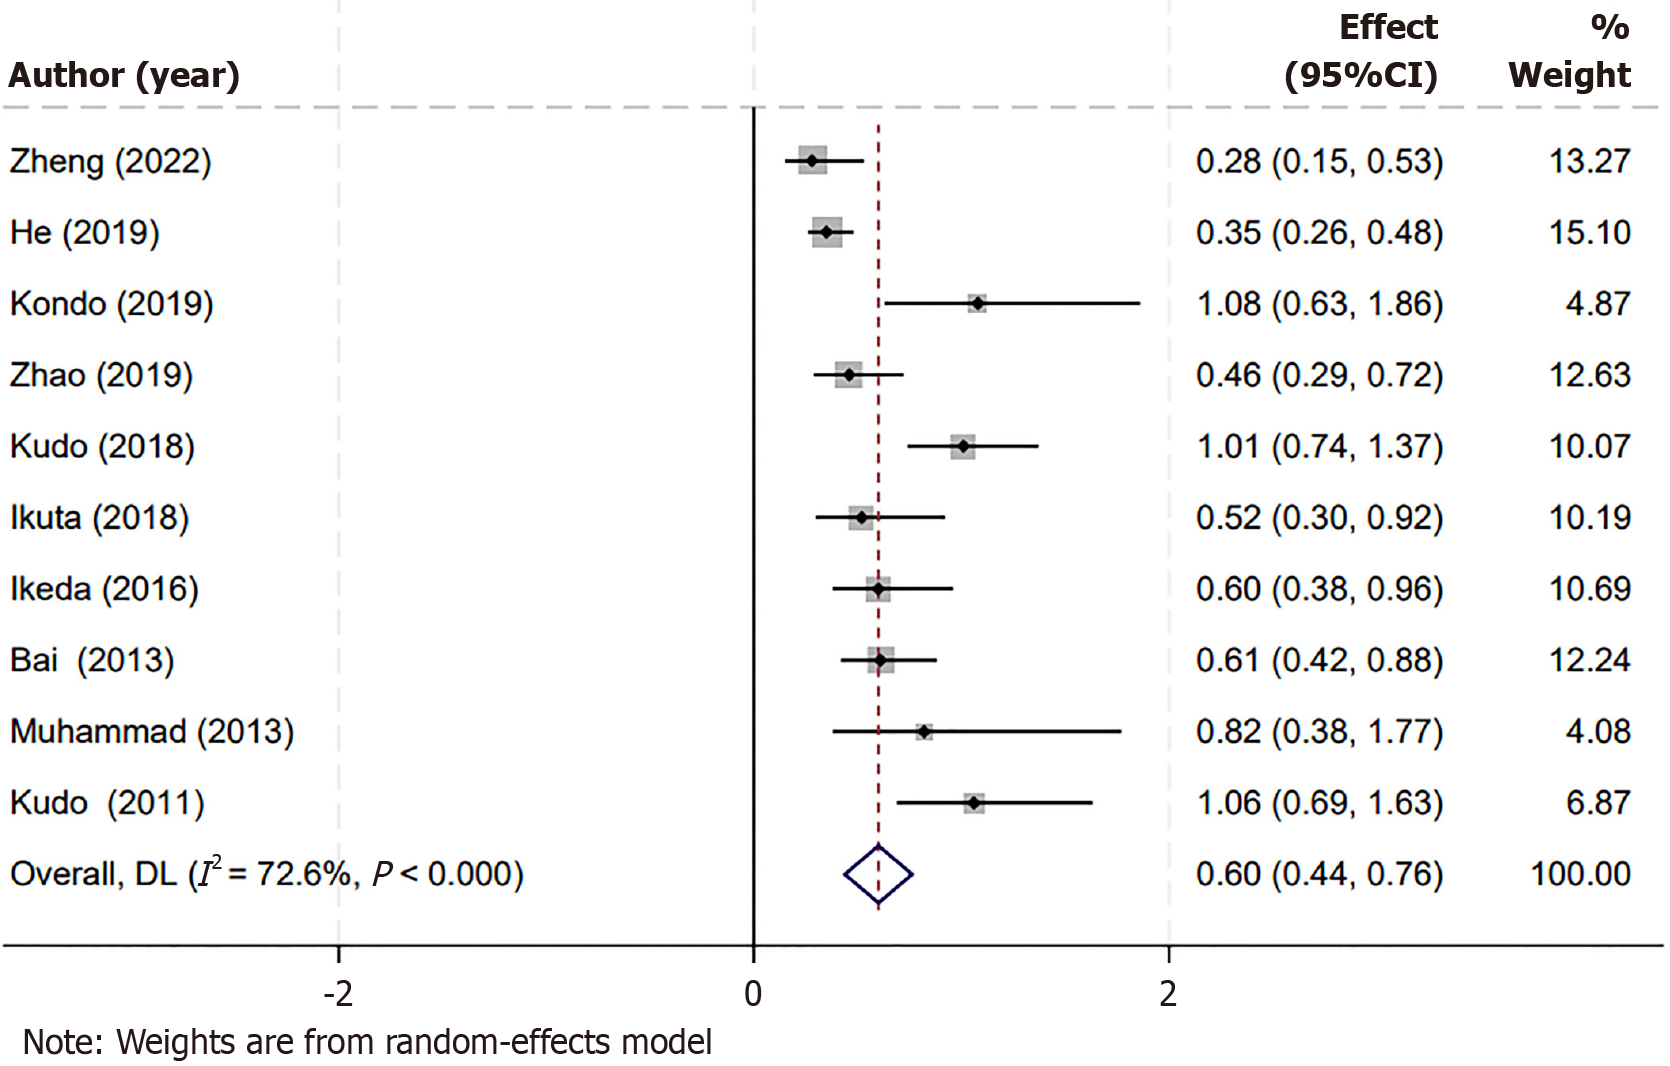
Figure 3
Forest plot showing the impact of combining sorafenib with transarterial chemoembolization on overall survival.
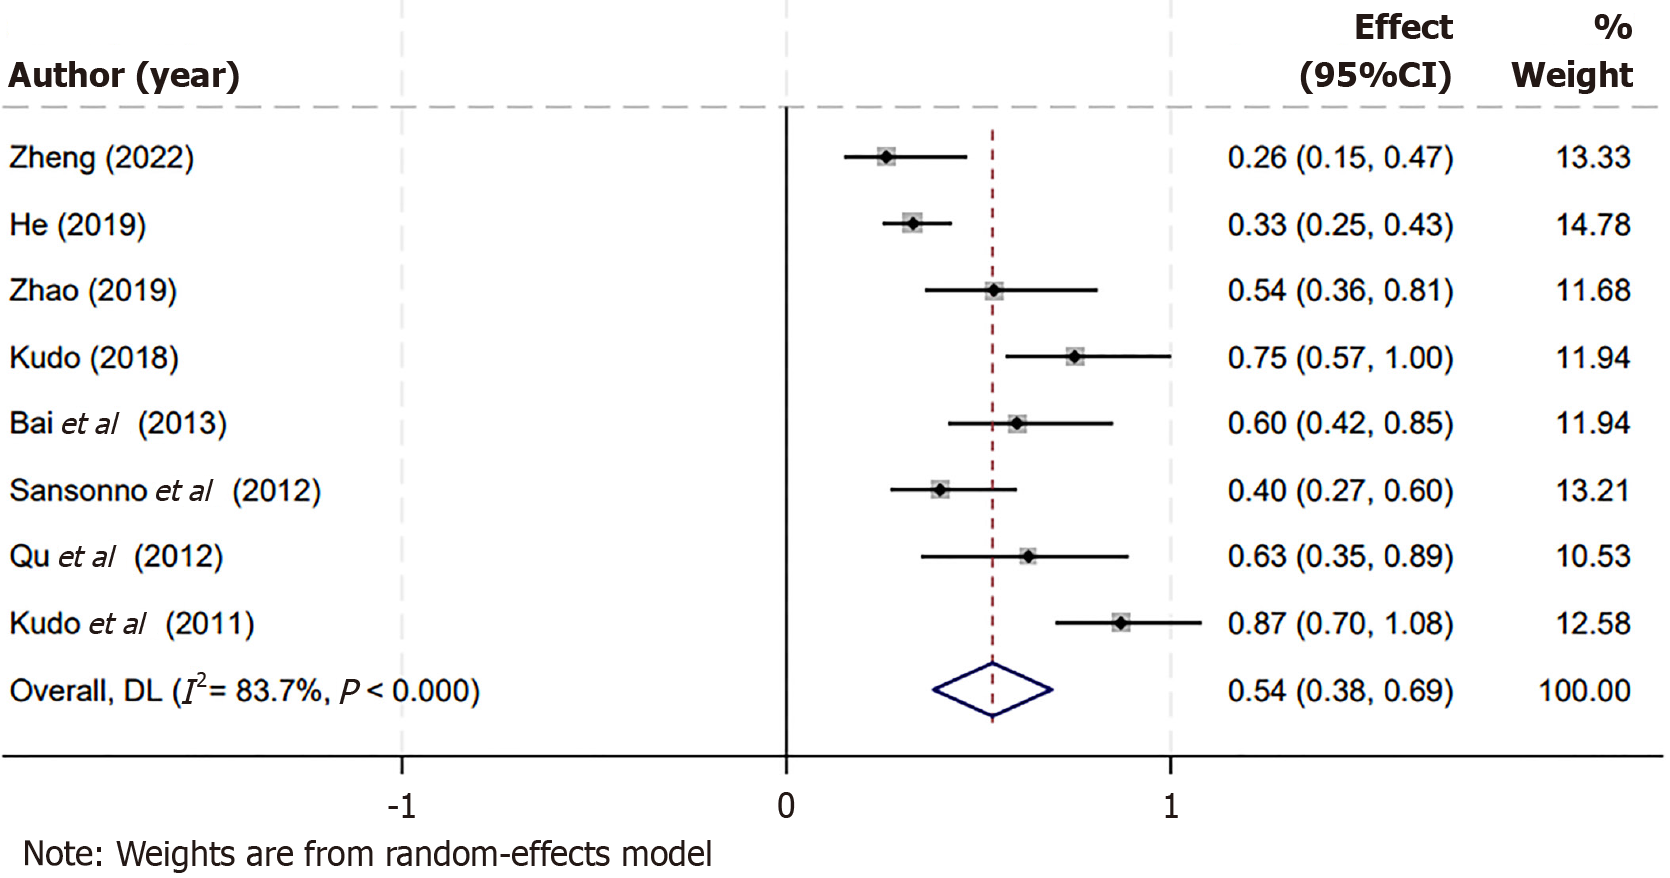
Figure 4
Forest plot displaying the benefits of sorafenib and transarterial chemoembolization combination on progression-free survival.
Figure 5 Sensitivity analysis graphs confirming the stability of the meta-analysis results for overall survival and progression-free survival.
A: Overall survival; B: Progression-free survival.
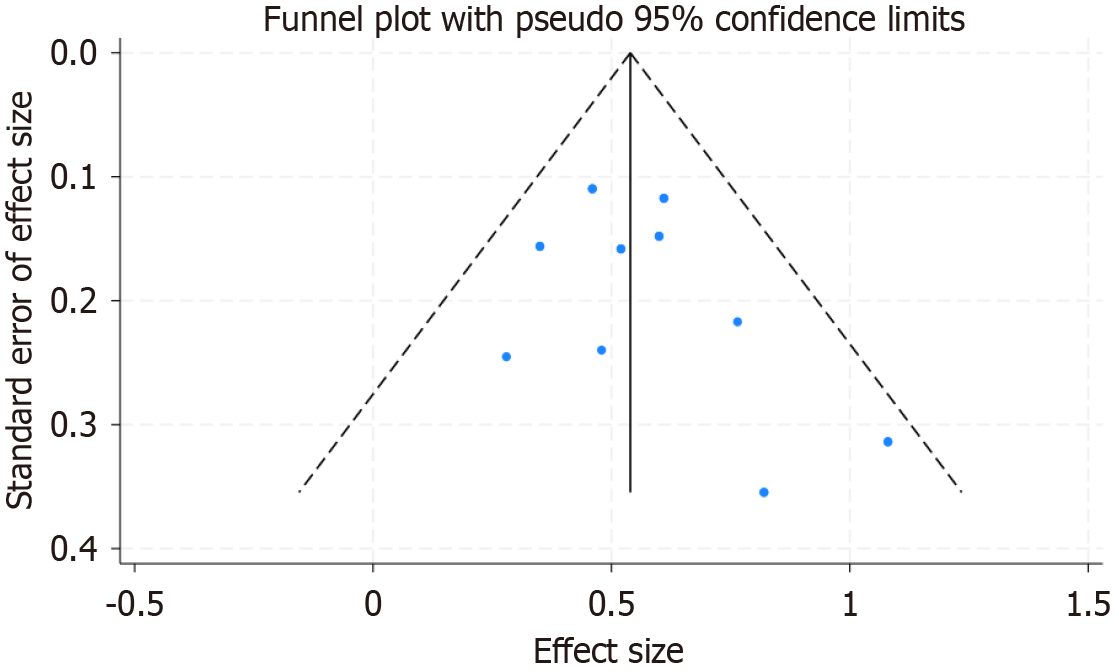
Figure 6
Funnel plot for evaluation of publication bias in the meta-analysis.
- Citation: Xu M, Zhou SR, Li YL, Zhang CH, Liao DZ, Wang XL. Efficacy of sorafenib combined with transarterial chemoembolization in the treatment of advanced hepatocellular carcinoma: A meta-analysis. World J Gastrointest Oncol 2025; 17(2): 98927
- URL: https://www.wjgnet.com/1948-5204/full/v17/i2/98927.htm
- DOI: https://dx.doi.org/10.4251/wjgo.v17.i2.98927


