Copyright
©The Author(s) 2025.
World J Gastrointest Oncol. Jan 15, 2025; 17(1): 96598
Published online Jan 15, 2025. doi: 10.4251/wjgo.v17.i1.96598
Published online Jan 15, 2025. doi: 10.4251/wjgo.v17.i1.96598
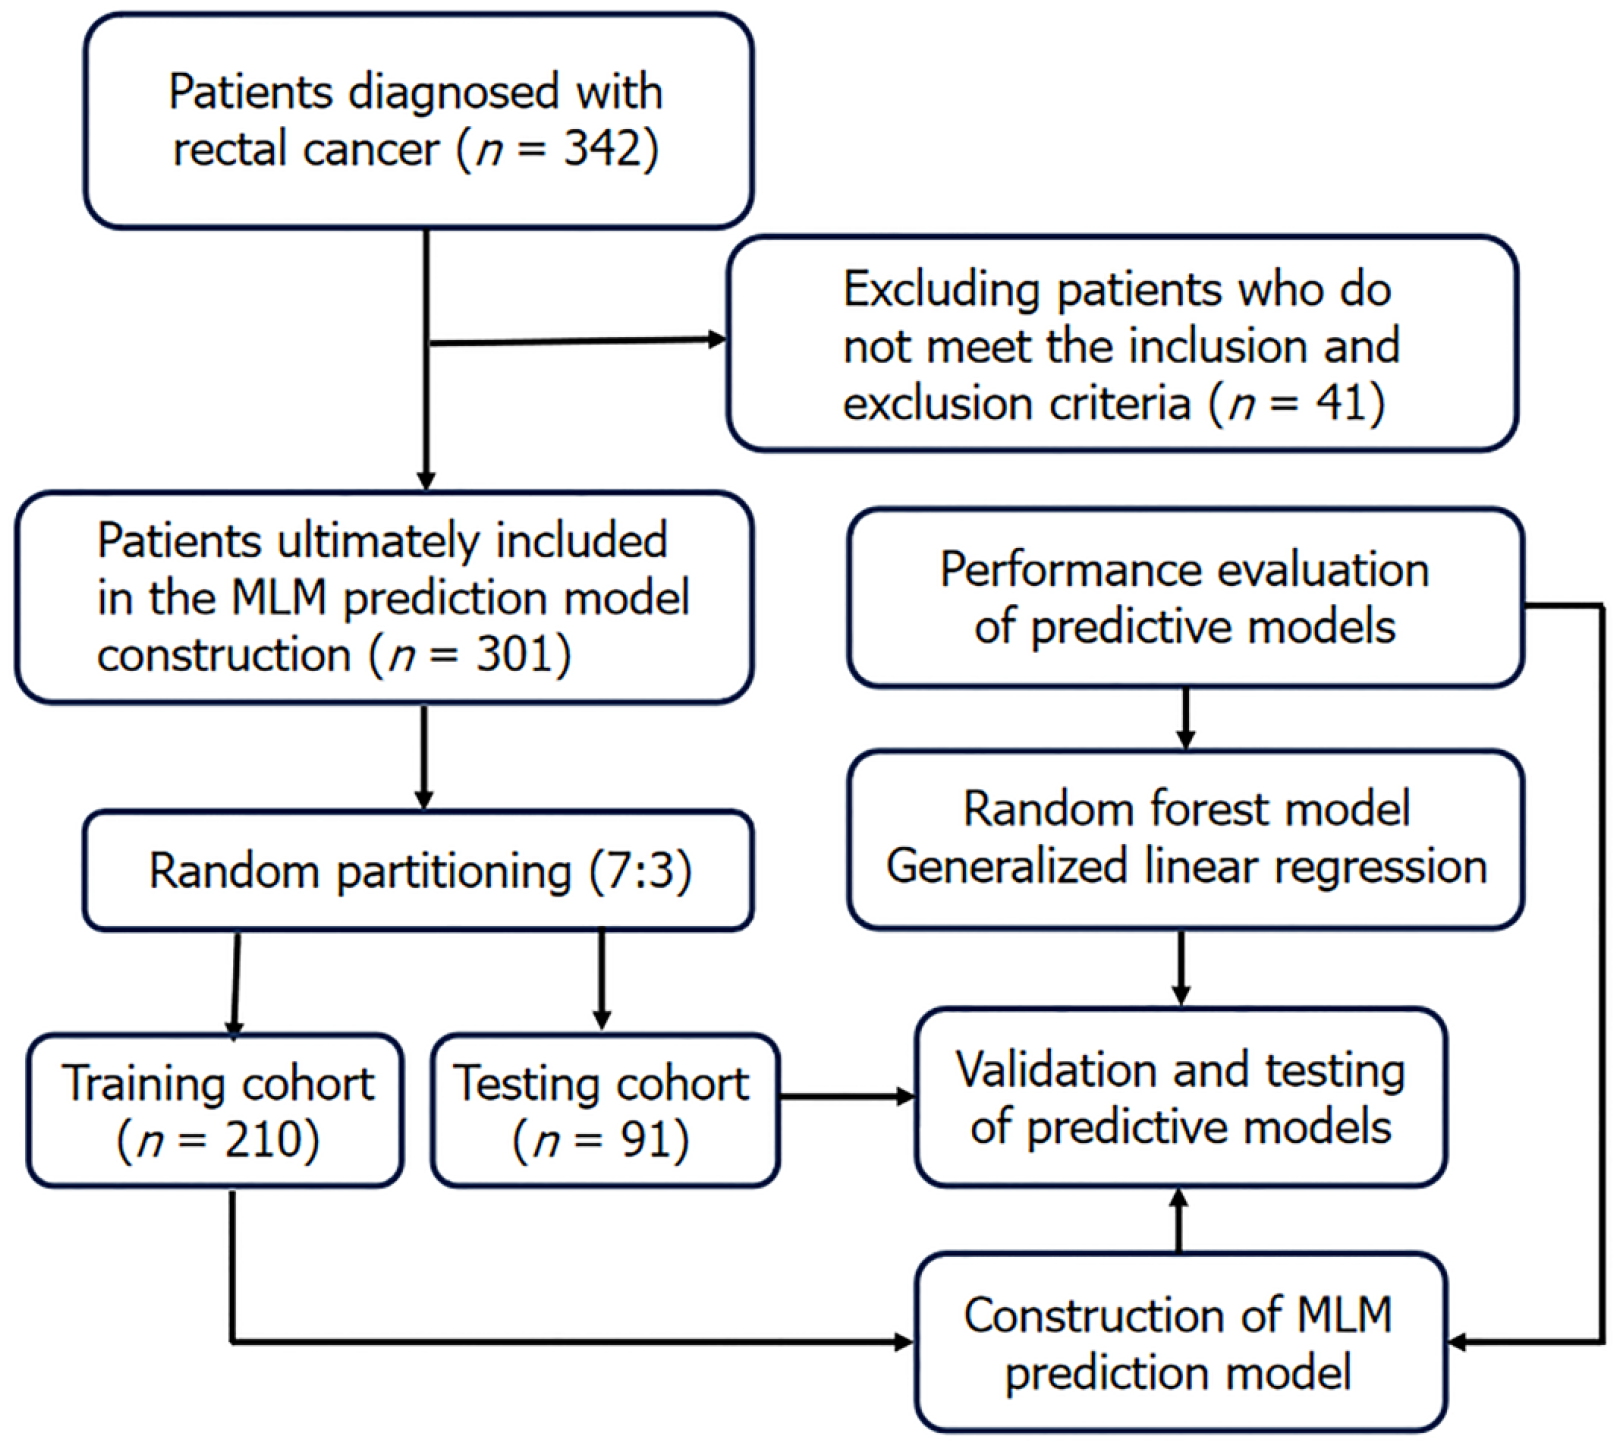
Figure 1 Patient inclusion and prediction model construction process.
MLM: Metachronous liver metastasis.
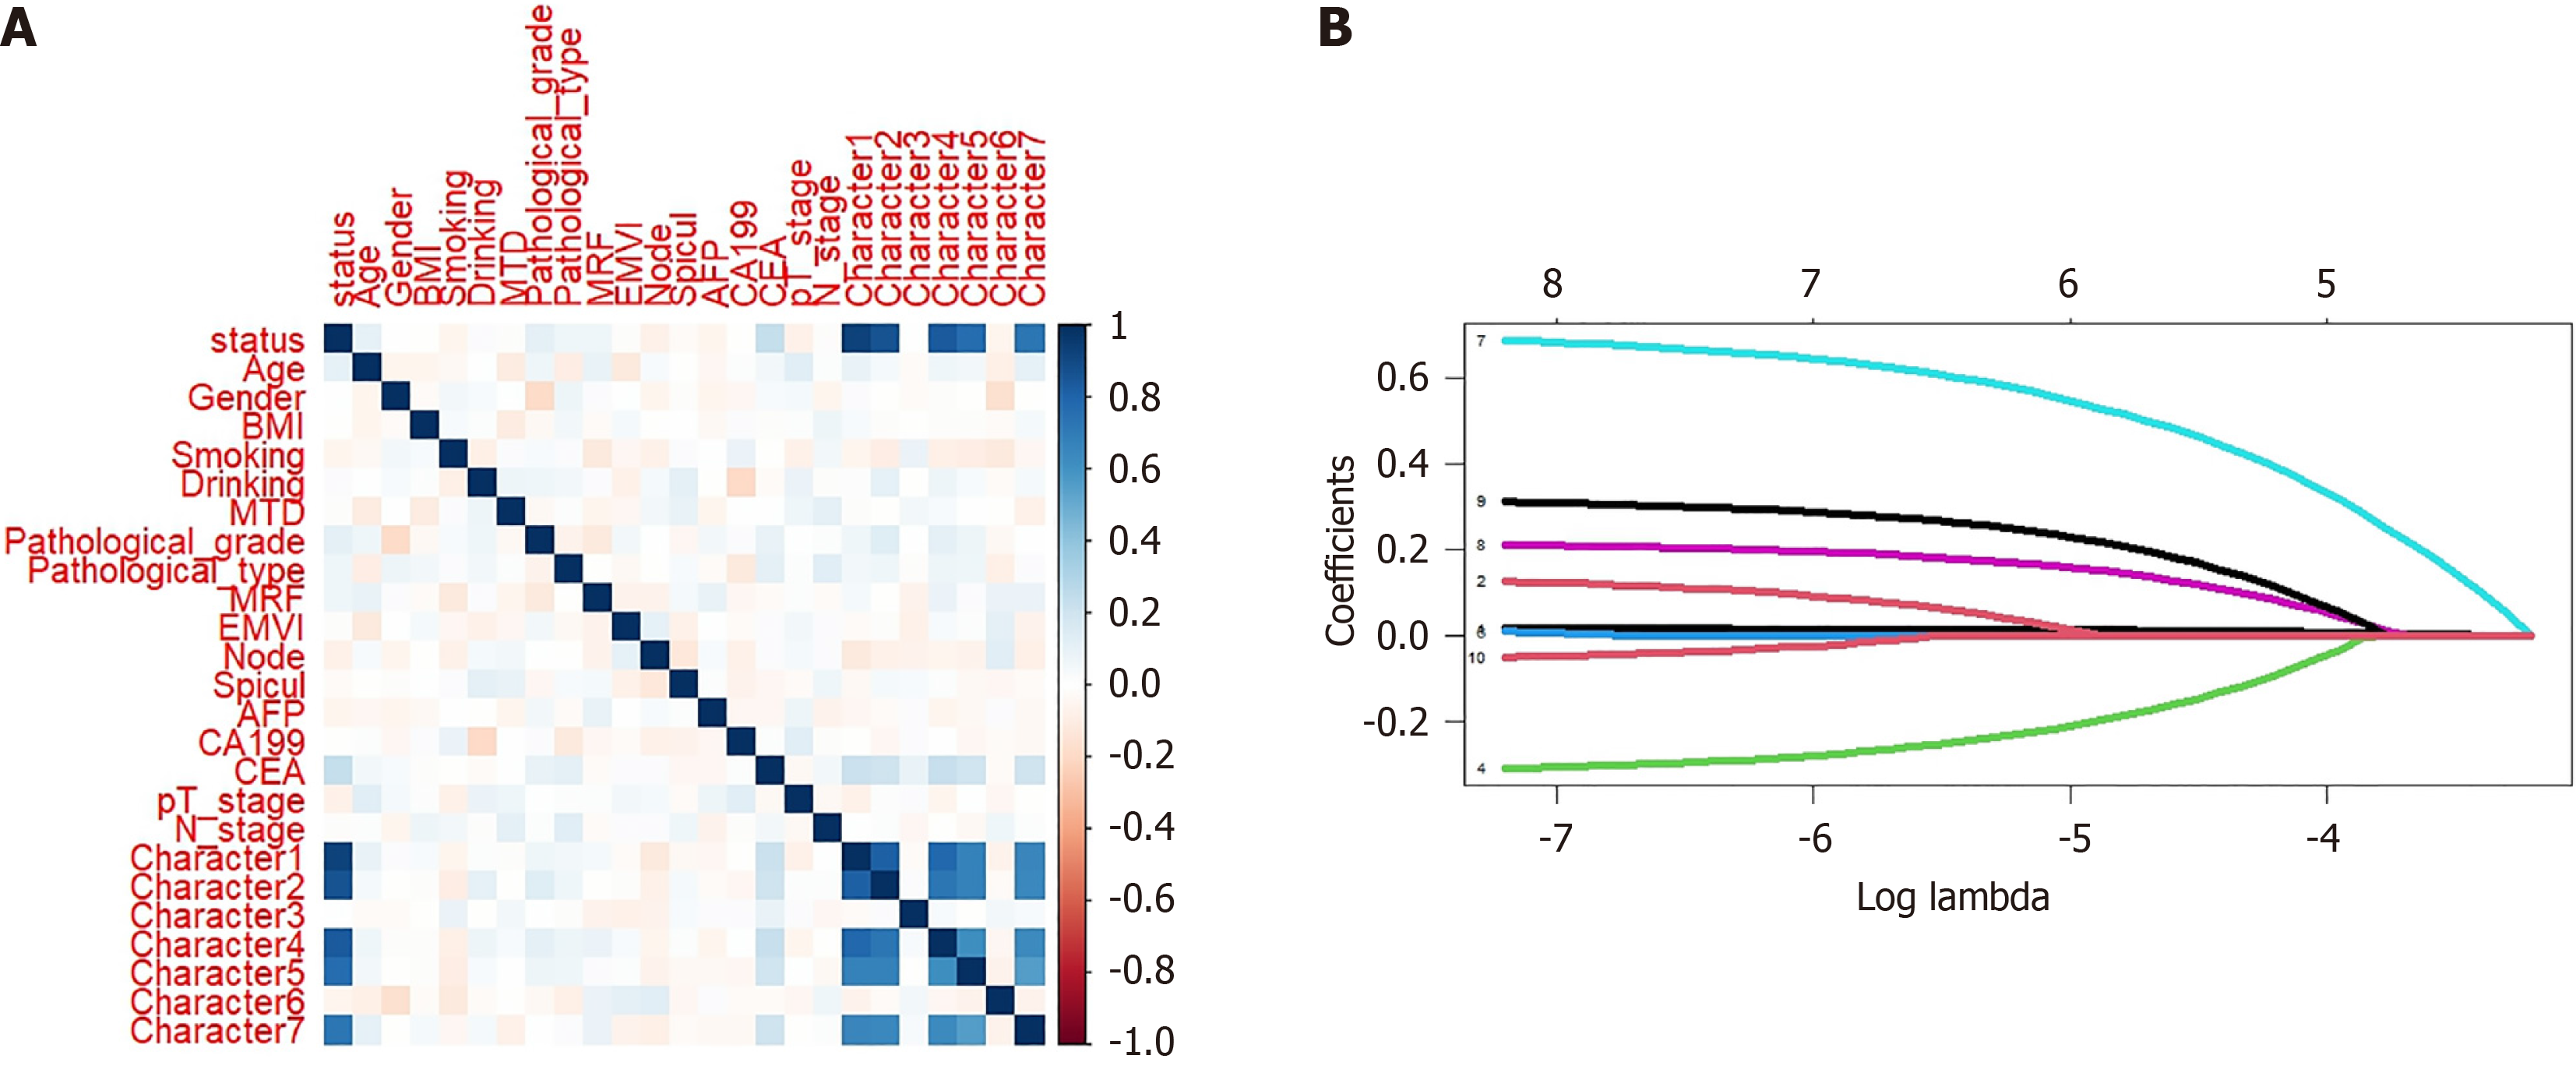
Figure 2 Selection of metachronous liver metastasis candidate predictive variables based on least absolute shrinkage and selection operator regression.
A: Spearman correlation analysis; B: Least absolute shrinkage and selection operator regression analysis. BMI: Body mass index; MTD: Maximum tumor diameter; MRF: Mesenteric fascia; AFP: Alpha fetoprotein; CA: Carbohydrate antigen; CEA: Carcinoembryonic antigen.
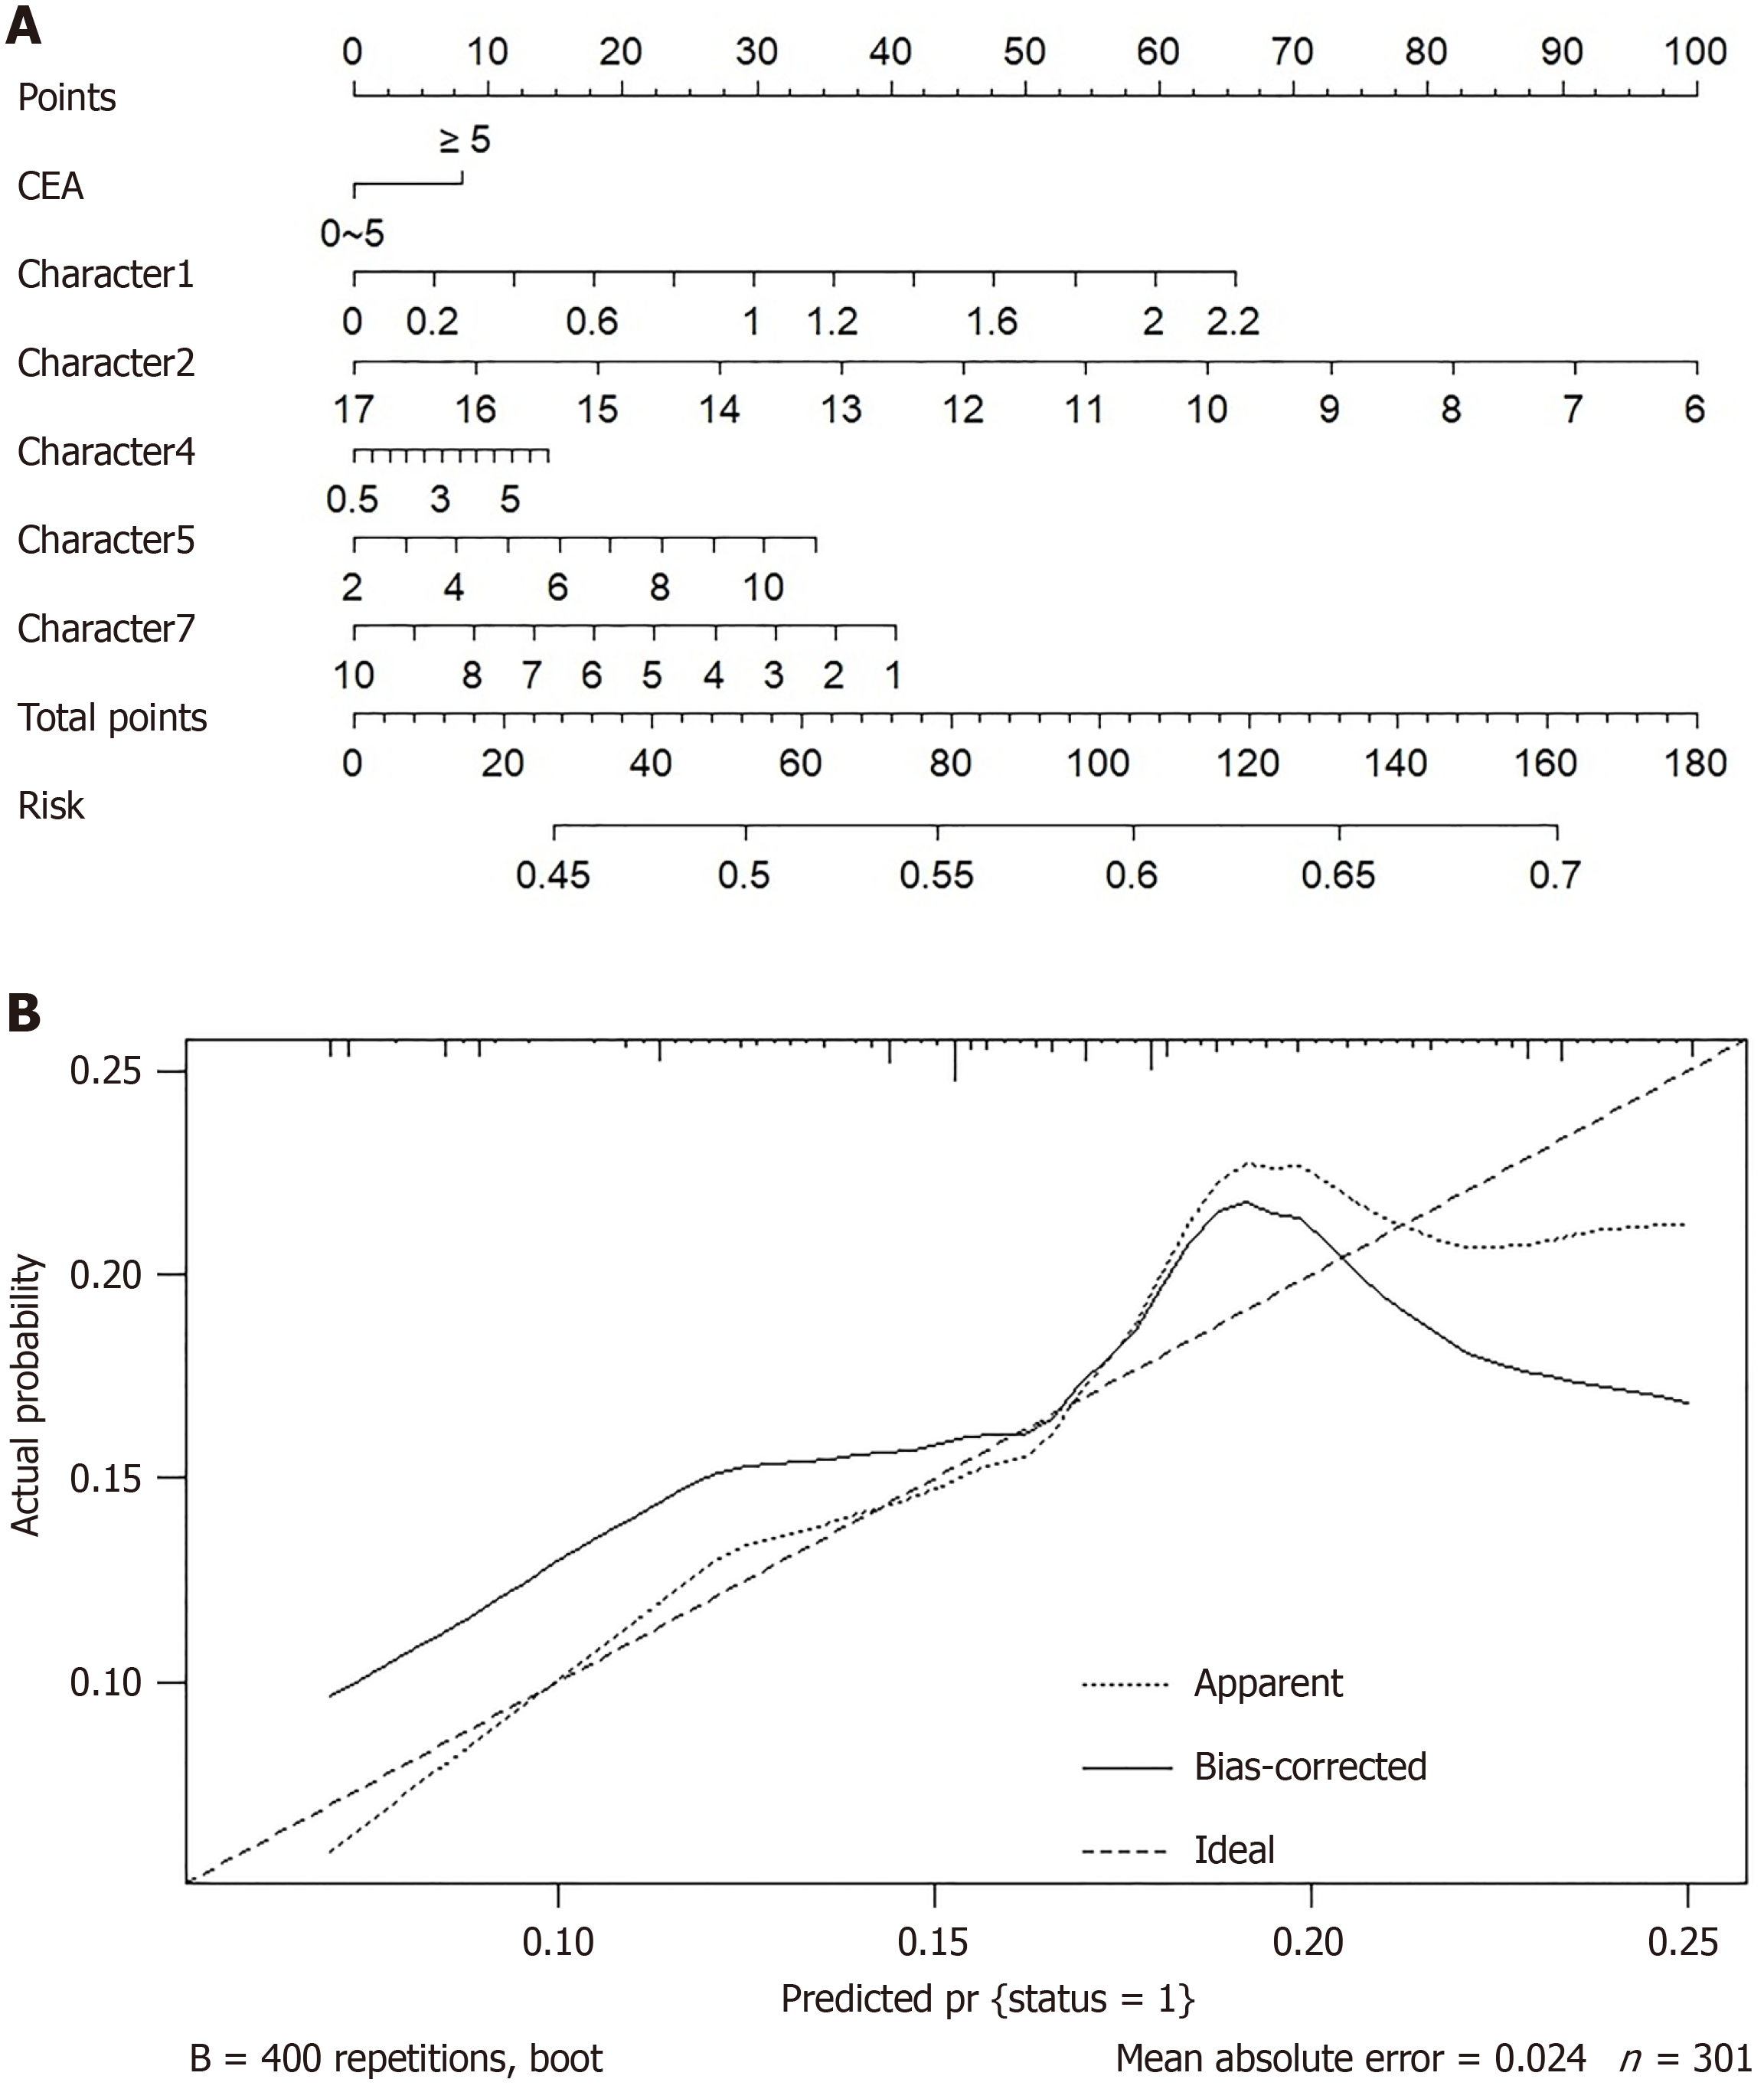
Figure 3 Nomogram visual prediction model for predicting metachronous liver metastasis.
A: Nomogram; B: Calibration curve. CEA: Carcinoembryonic antigen.
Figure 4 Random forest prediction model for predicting metachronous liver metastasis.
A: The random forest prediction model based on machine learning algorithms; B: Predictive performance detection of models. The red dots represent patients with metachronous liver metastasis, and the blue dots represent patients without metachronous liver metastasis.
Figure 5 Performance evaluation of predictive models based on decision curve analysis.
A: Training cohort; B: Testing cohort. RFM: Random forest model; GLRM: Generalized linear regression model.
- Citation: Long ZD, Yu X, Xing ZX, Wang R. Multiparameter magnetic resonance imaging-based radiomics model for the prediction of rectal cancer metachronous liver metastasis. World J Gastrointest Oncol 2025; 17(1): 96598
- URL: https://www.wjgnet.com/1948-5204/full/v17/i1/96598.htm
- DOI: https://dx.doi.org/10.4251/wjgo.v17.i1.96598


