Copyright
©The Author(s) 2025.
World J Gastrointest Oncol. Jan 15, 2025; 17(1): 100204
Published online Jan 15, 2025. doi: 10.4251/wjgo.v17.i1.100204
Published online Jan 15, 2025. doi: 10.4251/wjgo.v17.i1.100204
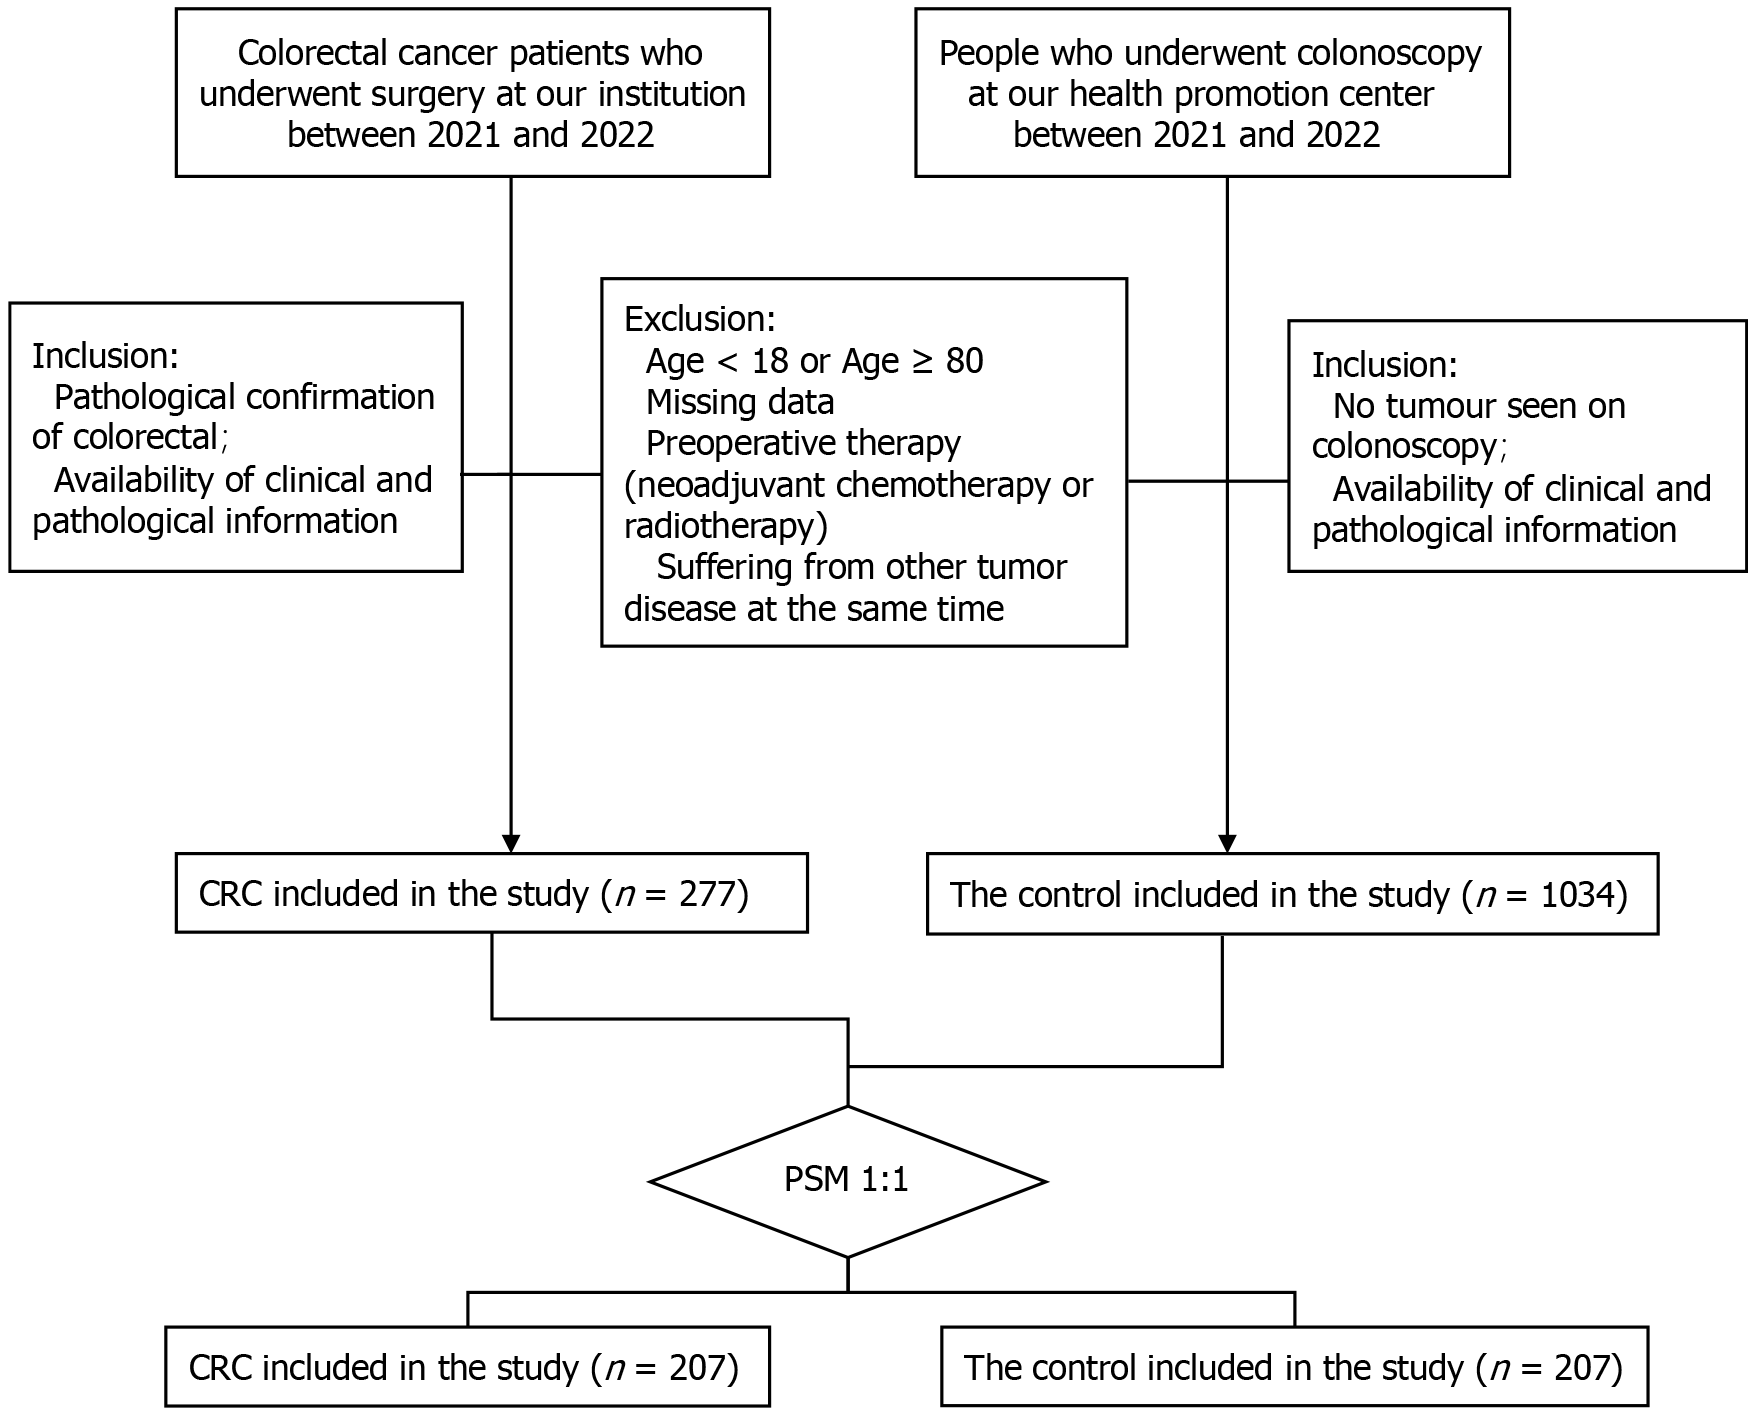
Figure 1 Flow of included participants.
CRC: Colorectal cancer; PSM: Propensity score matching.
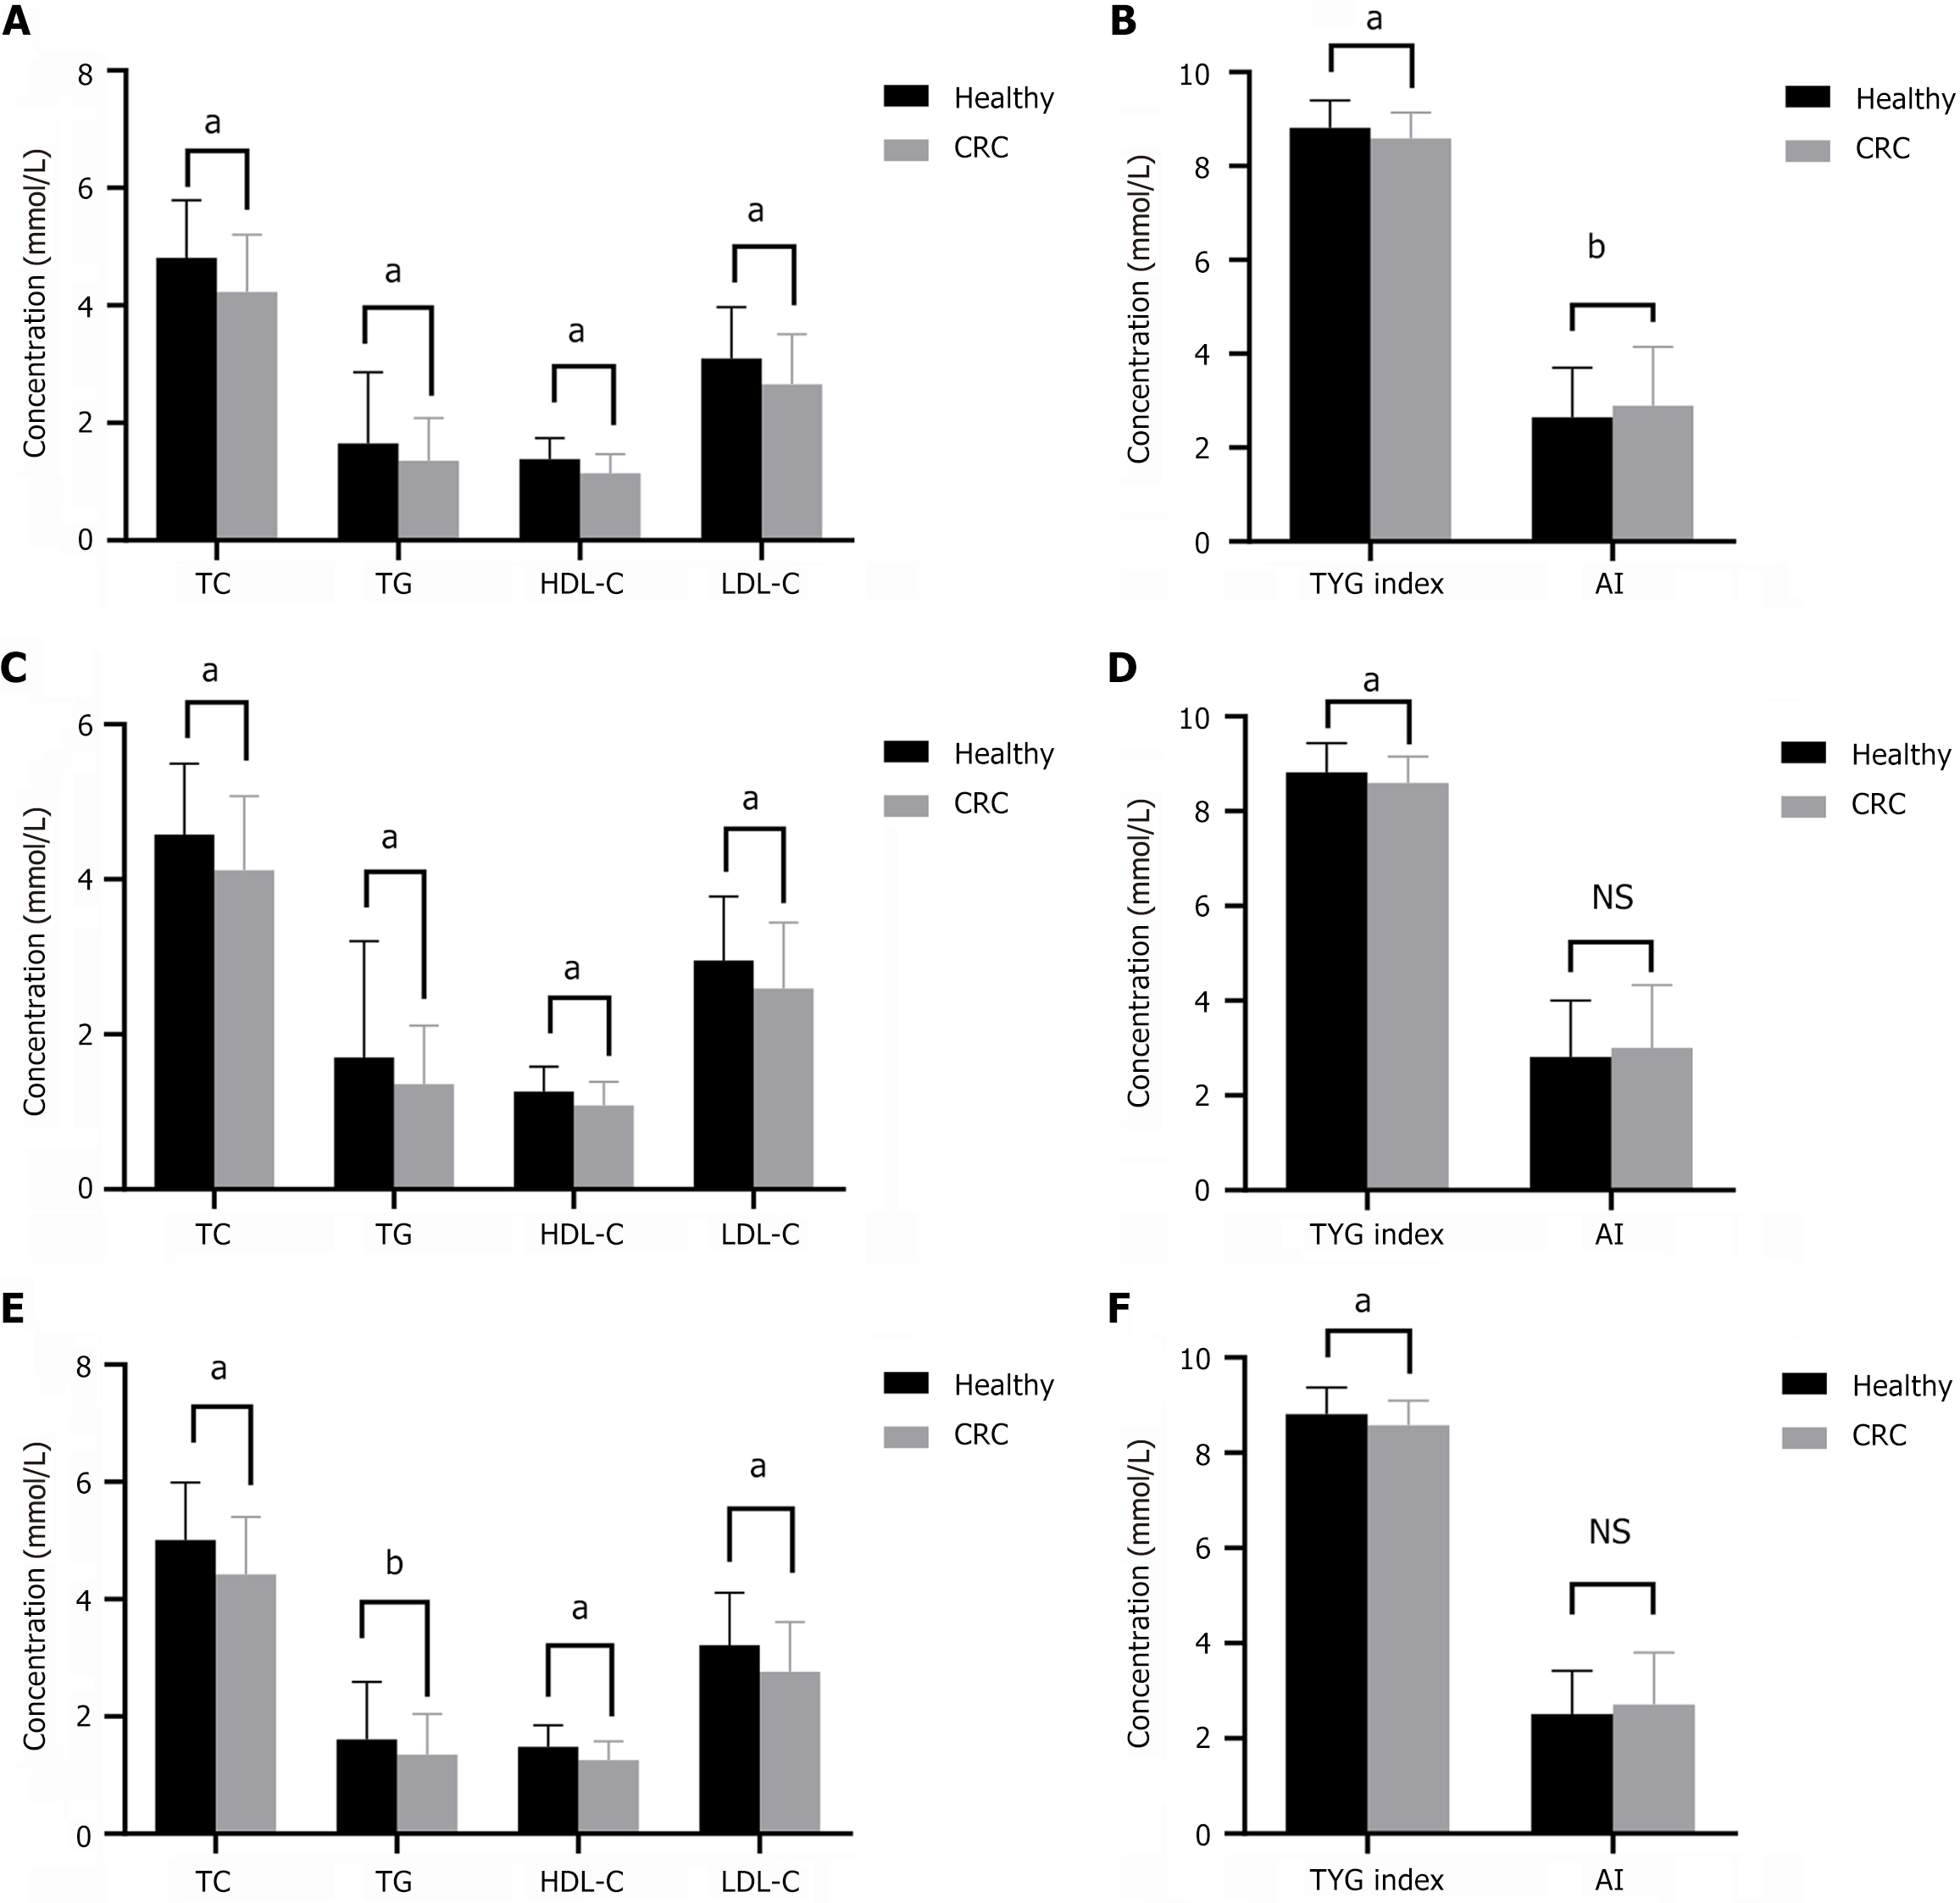
Figure 2 Serum lipid, triglyceride-glucose index, and atherosclerotic index in patients with colorectal cancer and healthy participants.
A: Serum lipids including total cholesterol (TC), triglyceride (TG), high-density lipoprotein cholesterol (HDL-C), and low-density lipoprotein cholesterol (LDL-C); B: Triglyceride-glucose (TyG) index and atherosclerotic index (AI) in all research subjects; C: Serum lipids; D: TyG index and AI in male subjects; E and F: Serum lipids; TyG index, and AI in female subjects. Data are presented as the mean ± standard deviation and analyzed by the Student’s t-test. aP < 0.05; bP < 0.01; cP < 0.001. CRC: Colorectal cancer.
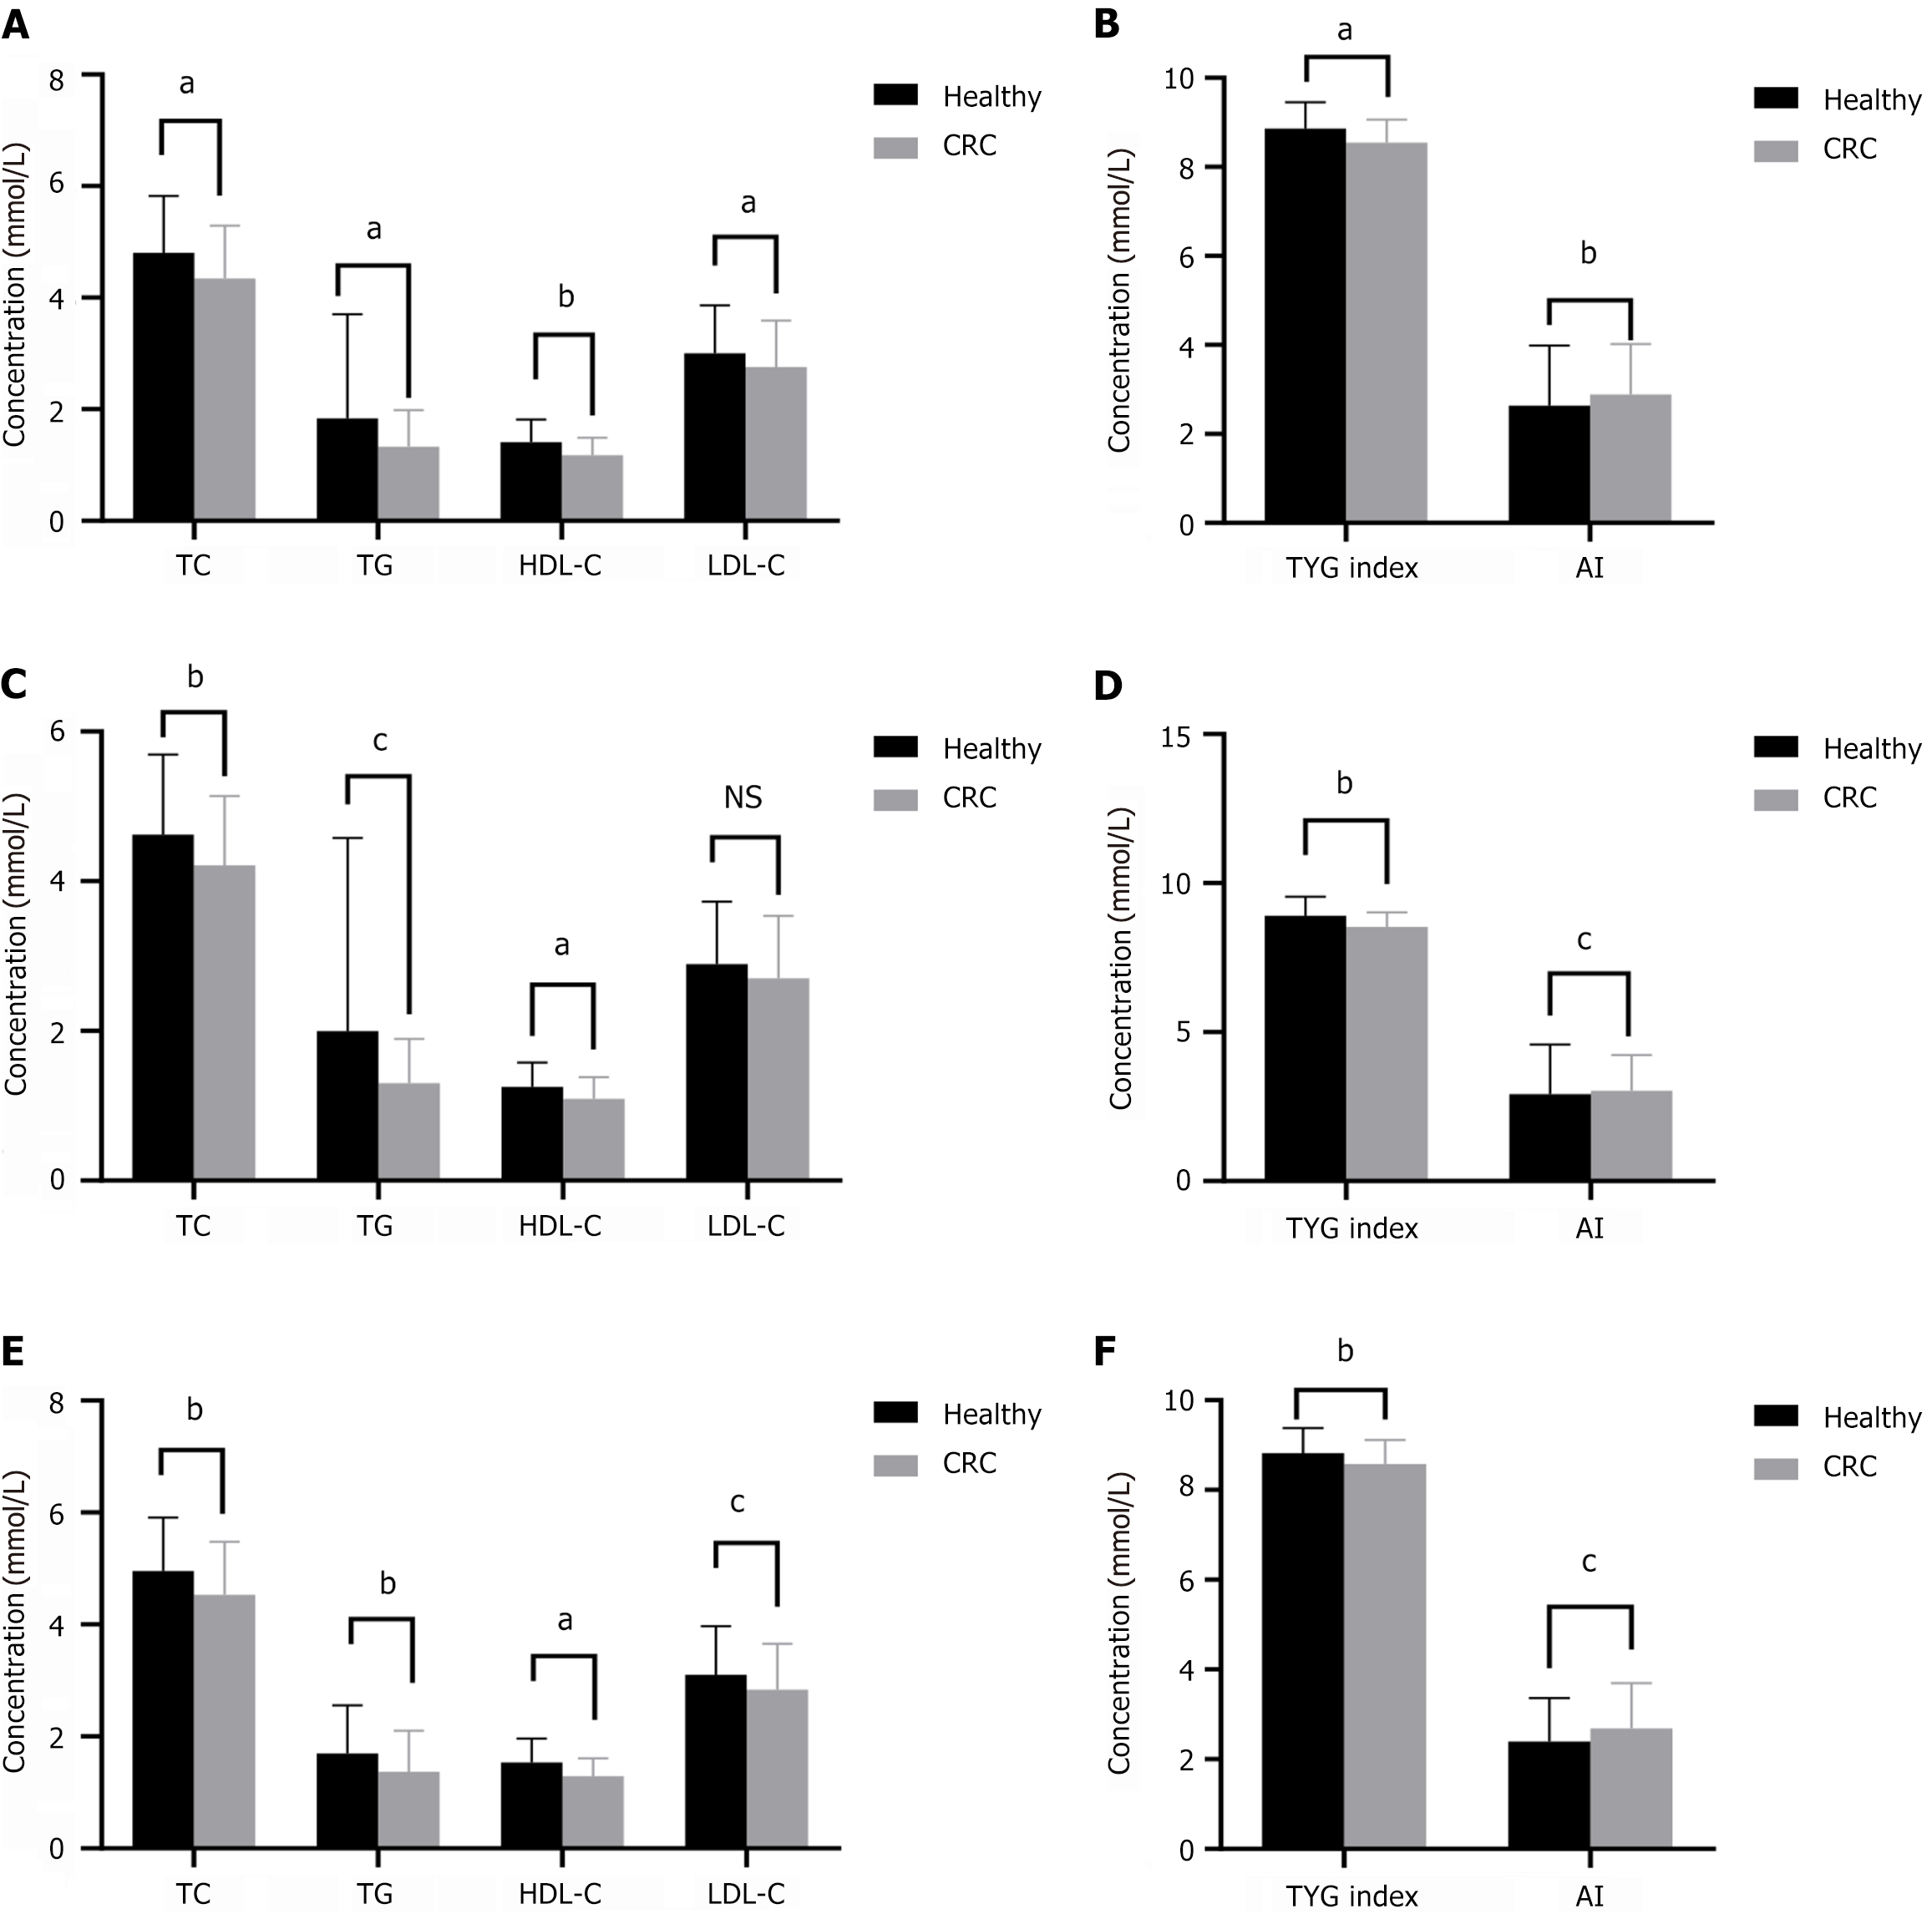
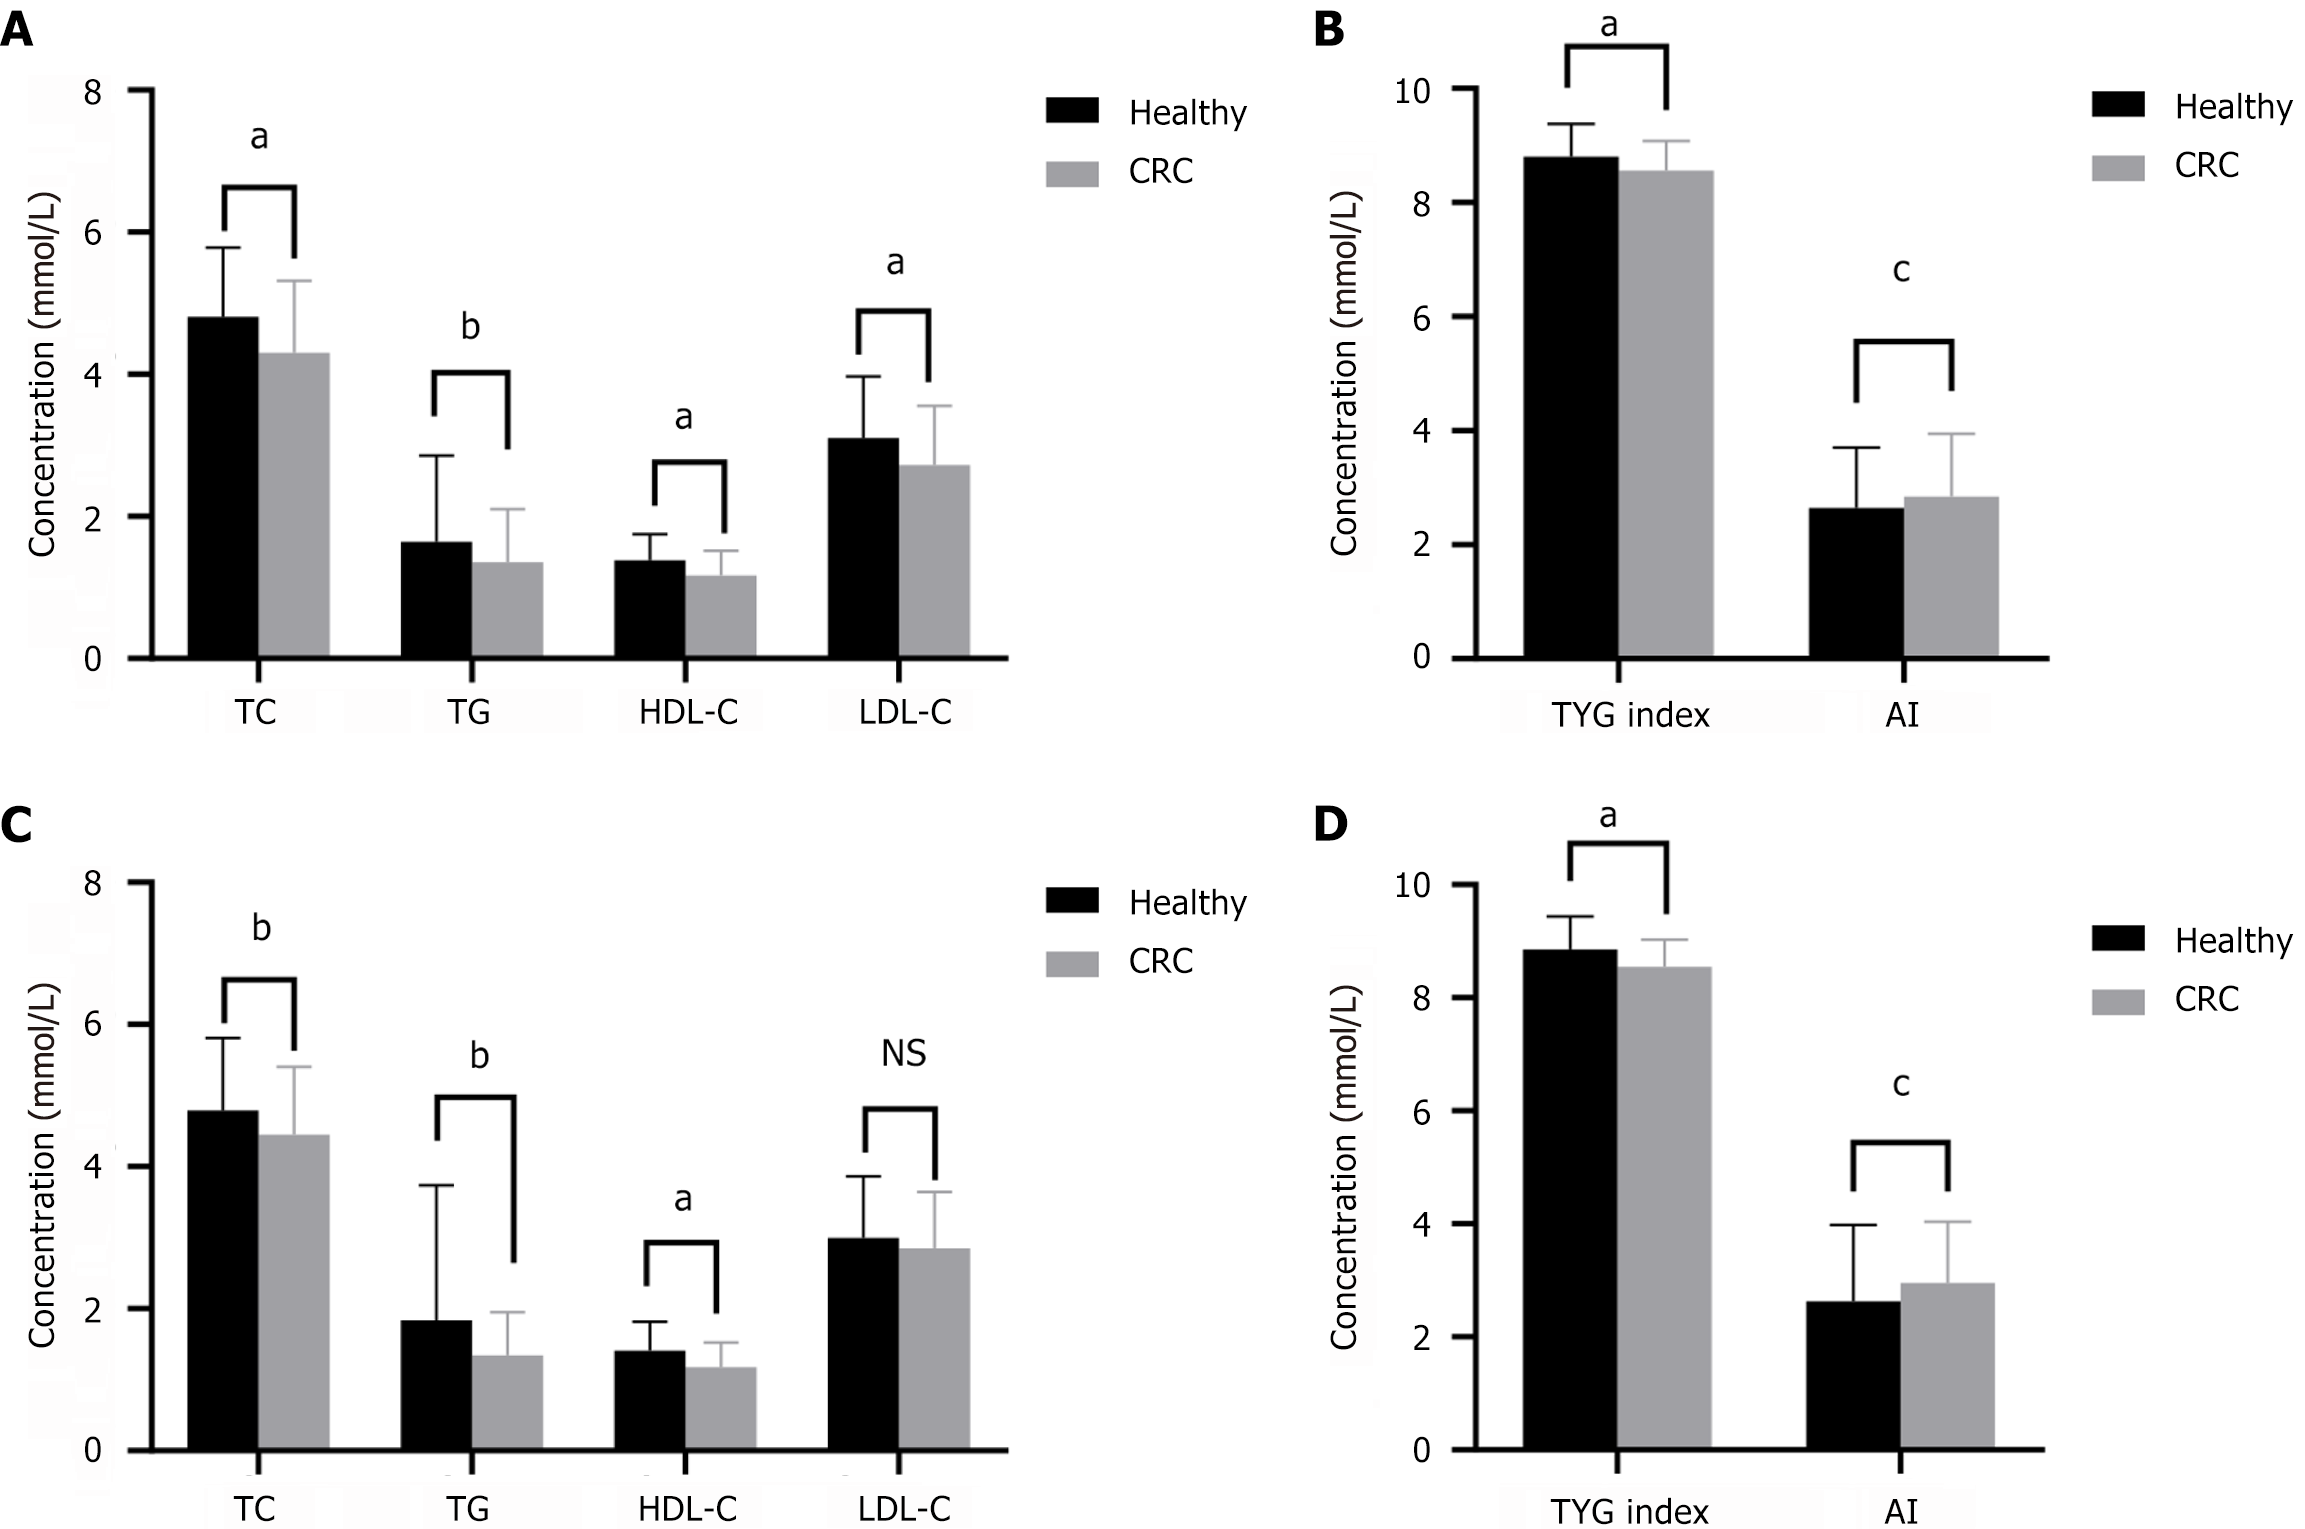
Figure 3 Serum lipid, triglyceride-glucose index, and atherosclerotic index in patients with colorectal cancer and healthy participants after propensity score matching.
A and B: Serum lipids, triglyceride-glucose (TyG) index and atherosclerotic index (AI) in all research subjects after propensity score matching (PSM); C and D: Serum lipids, TyG index, and AI in male subjects after PSM; E and F: Serum lipids, TyG index, and AI in female subjects after PSM. Data are presented as the mean ± standard deviation and analyzed by the Student’s t-test. aP < 0.05; bP < 0.01; cP < 0.001. CRC: Colorectal cancer; HDL-C: High-density lipoprotein cholesterol; LDL-C: Low-density lipoprotein cholesterol; TC: Total cholesterol; TG: Triglyceride.
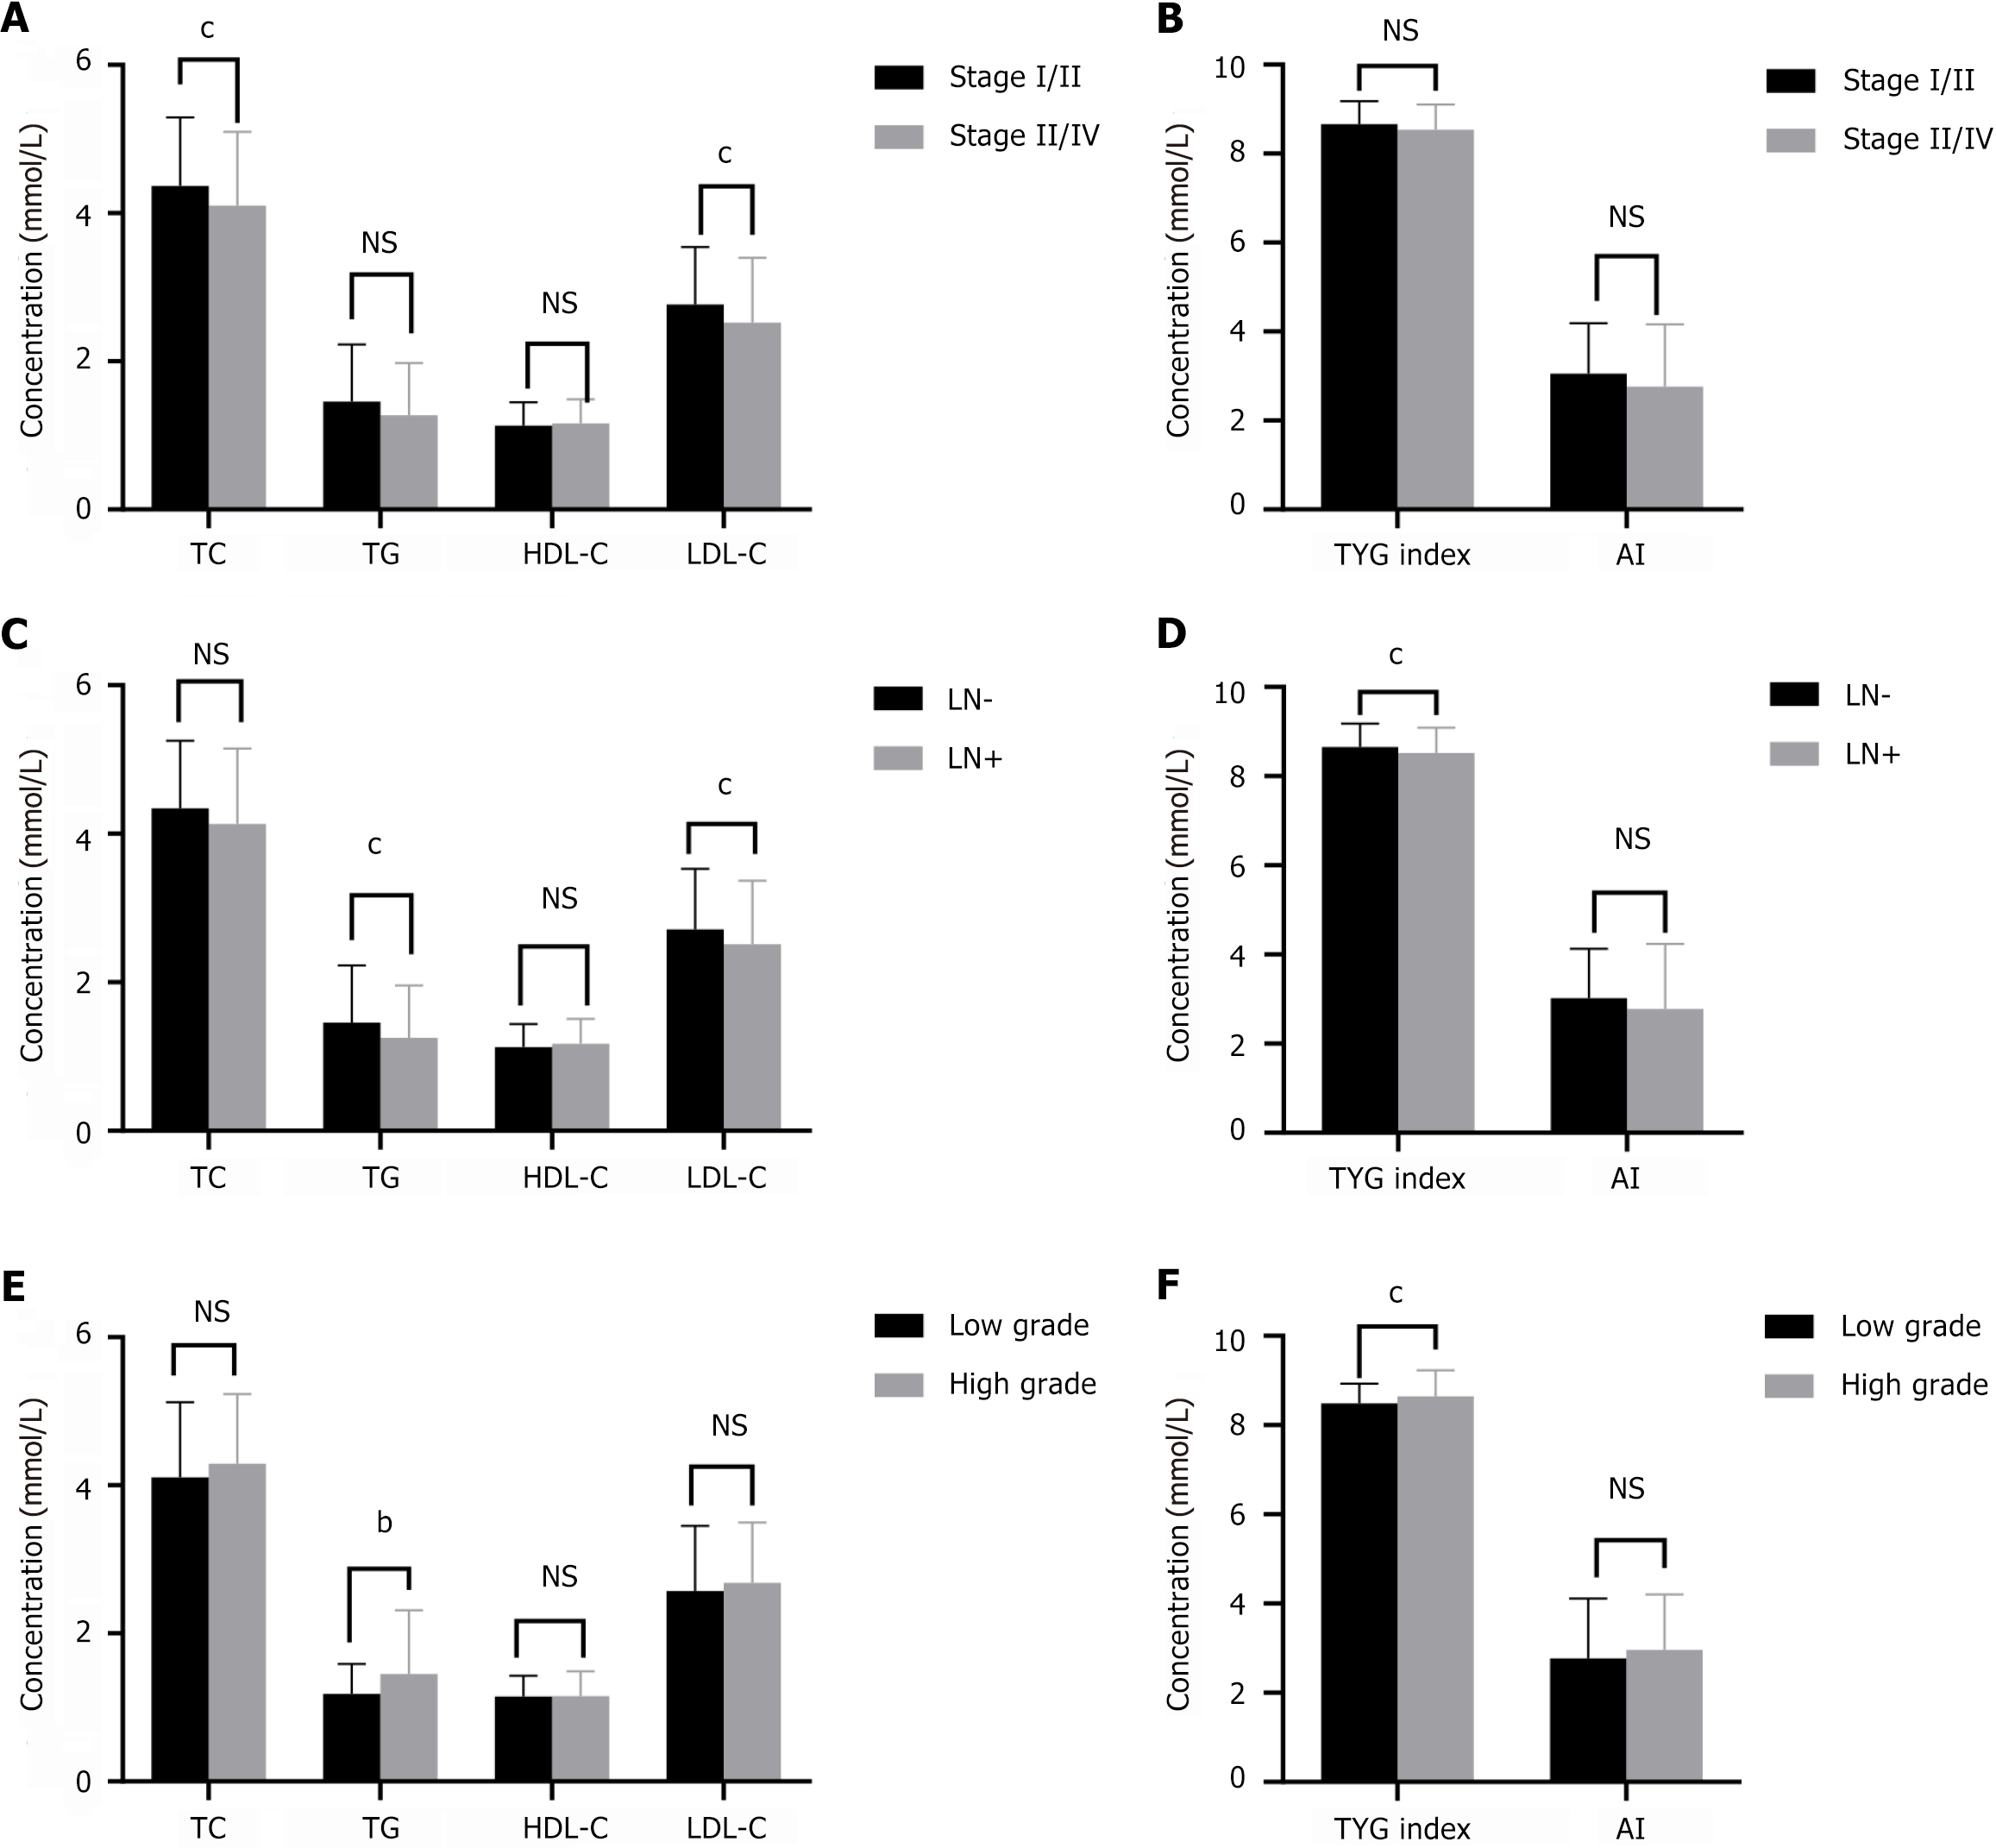
Figure 4 Relationships between serum lipid levels and the malignancy and invasiveness of colorectal cancer.
A and B: Serum lipids, triglyceride-glucose (TyG) index, and atherosclerotic index (AI) in different tumor stage of colorectal cancer (CRC); C and D: Serum lipids, TyG index, and AI in patients with CRC with or without with lymph node metastasis; E and F: Serum lipids, TyG index, and AI in patients with CRC with different differentiations. Data are presented as the mean ± standard deviation and analyzed by the Student’s t-test. aP < 0.05; bP < 0.01; cP < 0.001. HDL-C: High-density lipoprotein cholesterol; LDL-C: Low-density lipoprotein cholesterol; TC: Total cholesterol; TG: Triglyceride.
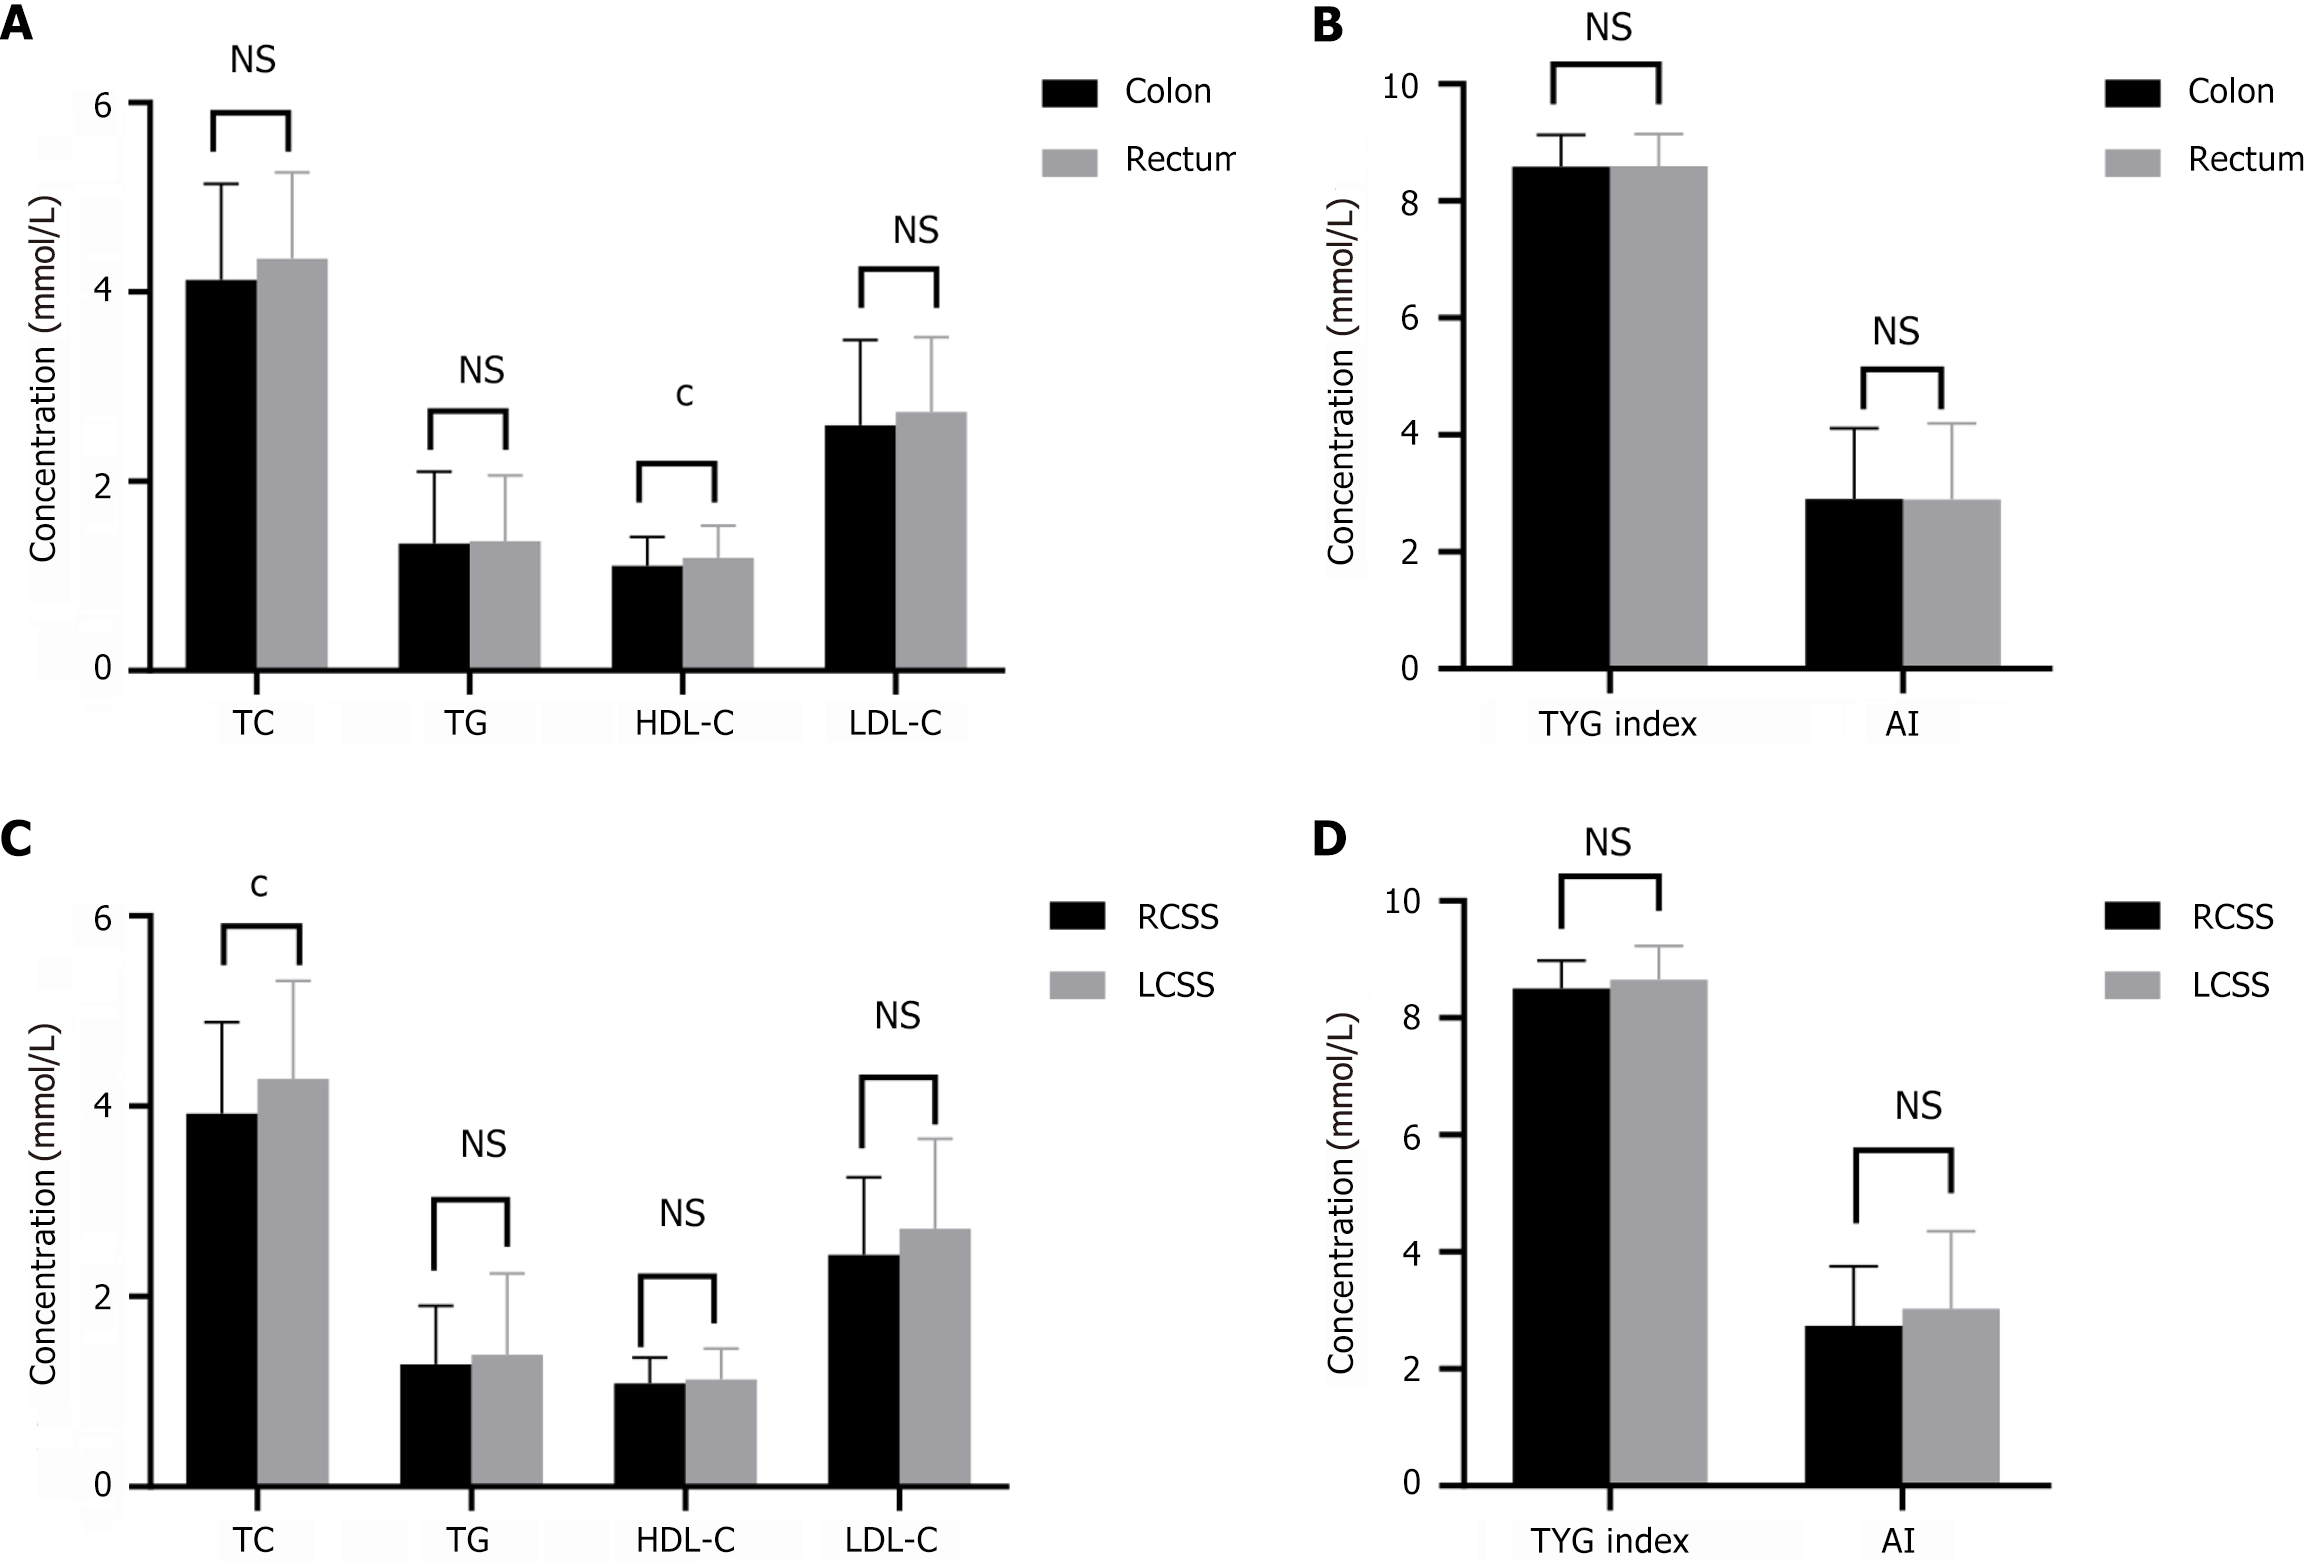
Figure 5 Relationships between serum lipid levels and tumor location.
A and B: Serum lipids, triglyceride-glucose (TyG) index, and atherosclerotic index (AI) in patients with colorectal cancer (CRC) and rectal cancer; C and D: Serum lipids, TyG index, and AI in patients with right-sided CRC (RCSS) and left-sided CRC (LCSS). Data are presented as the mean ± standard deviation and analyzed by the Student’s t-test. aP < 0.05; bP < 0.01; cP < 0.001. HDL-C: High-density lipoprotein cholesterol; LDL-C: Low-density lipoprotein cholesterol; TC: Total cholesterol; TG: Triglyceride.
Figure 6 Serum lipid levels in patients with colorectal cancer with normal carcinoembryonic antigen and carbohydrate antigen 19-9.
A and B: Serum lipids, triglyceride-glucose (TyG) index, and atherosclerotic index (AI) in patients with colorectal cancer (CRC) with normal carcinoembryonic antigen (CEA) and carbohydrate antigen 19-9 before propensity score matching (PSM); C and D: Serum lipids, TyG index, and AI in patients with CRC with normal CEA and CA19-9 after PSM. Data are presented as the mean ± standard deviation and analyzed by the Student’s t-test. aP < 0.05; bP < 0.01; cP < 0.001. HDL-C: High-density lipoprotein cholesterol; LDL-C: Low-density lipoprotein cholesterol; TC: Total cholesterol; TG: Triglyceride.
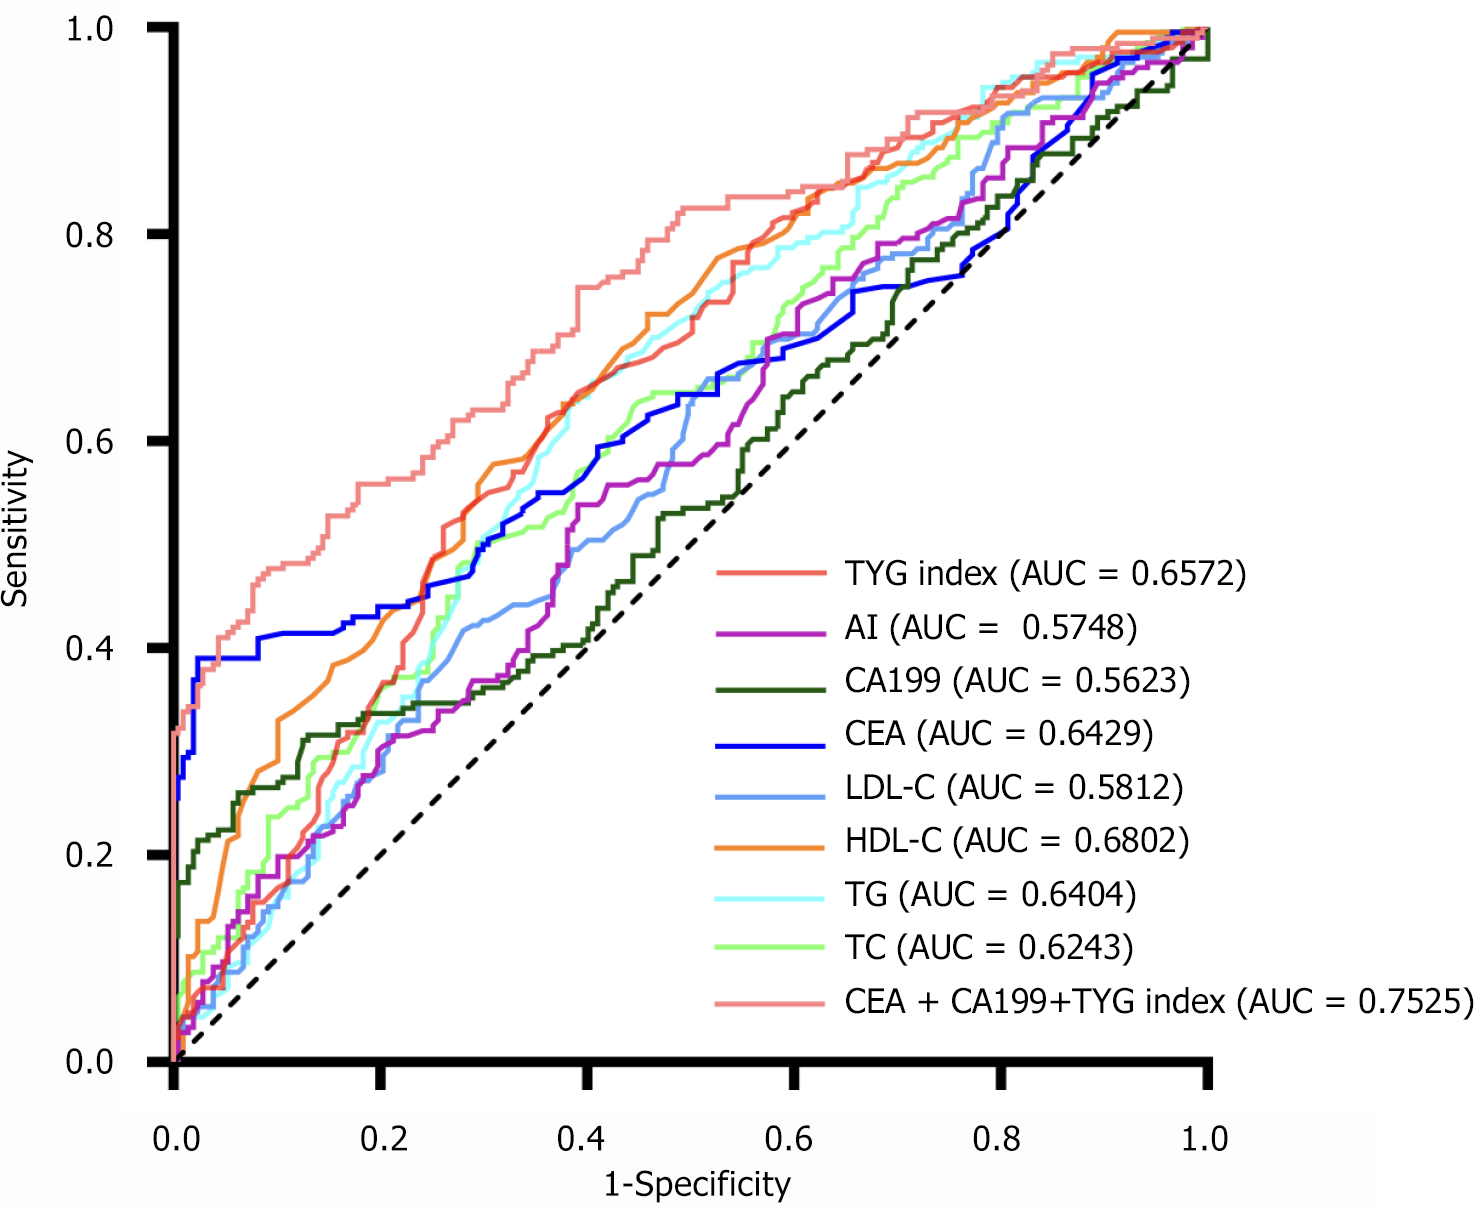
Figure 7 Various combined diagnostic indicators for patients with colorectal cancer.
AI: Atherosclerotic index; AUC: Area under the curve; CEA: Carcinoembryonic antigen; HDL-C: High-density lipoprotein cholesterol; LDL-C: Low-density lipoprotein cholesterol; TC: Total cholesterol; TG: Triglyceride; TyG: Triglyceride-glucose.
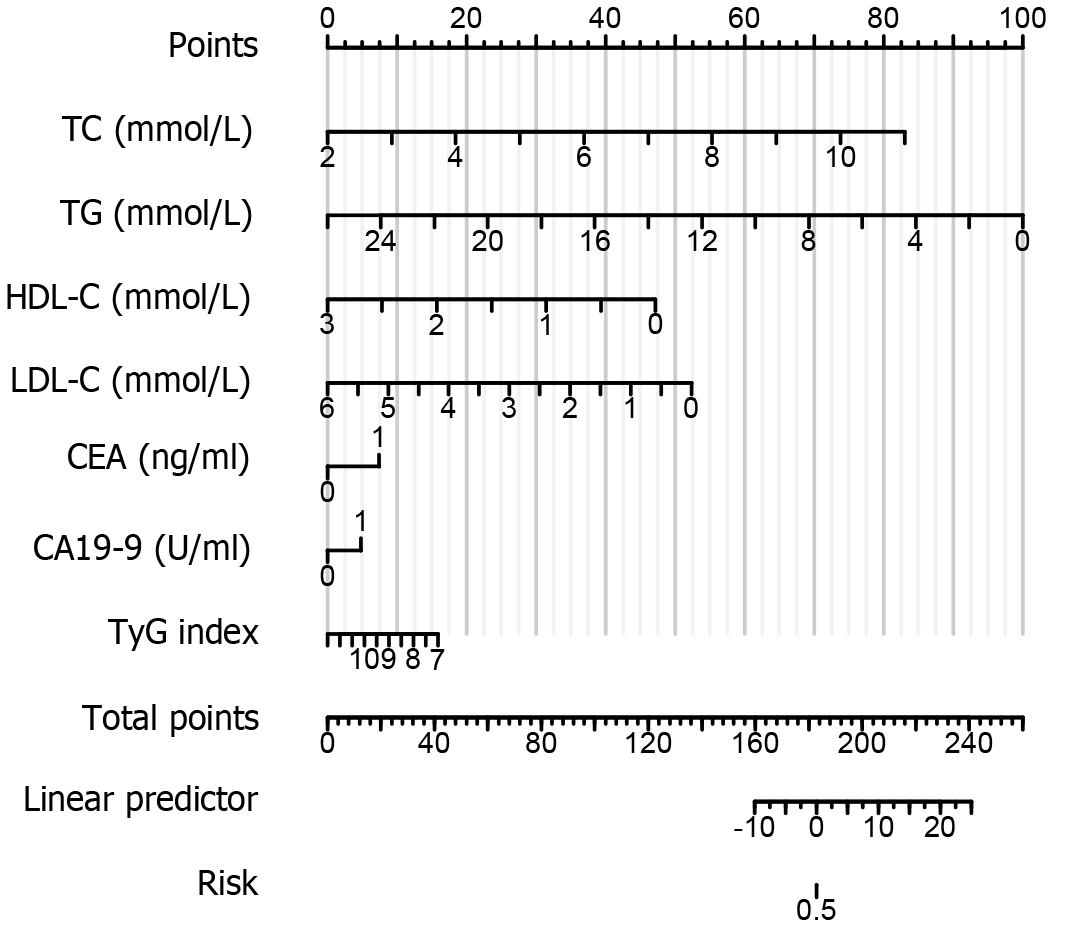
Figure 8 Nomogram for colorectal cancer diagnosis.
AUC: Area under the curve; CEA: Carcinoembryonic antigen; HDL-C: High-density lipoprotein cholesterol; LDL-C: Low-density lipoprotein cholesterol; TC: Total cholesterol; TG: Triglyceride; TyG: Triglyceride-glucose.
- Citation: Hu RH, Yan DY, Zhang KH, Zhang D, Cui XM, Jiang XH, Zhang S. Lipid levels and insulin resistance markers in patients with colorectal cancer: Propensity score matching analysis. World J Gastrointest Oncol 2025; 17(1): 100204
- URL: https://www.wjgnet.com/1948-5204/full/v17/i1/100204.htm
- DOI: https://dx.doi.org/10.4251/wjgo.v17.i1.100204


