Copyright
©The Author(s) 2024.
World J Gastrointest Oncol. Sep 15, 2024; 16(9): 4014-4027
Published online Sep 15, 2024. doi: 10.4251/wjgo.v16.i9.4014
Published online Sep 15, 2024. doi: 10.4251/wjgo.v16.i9.4014
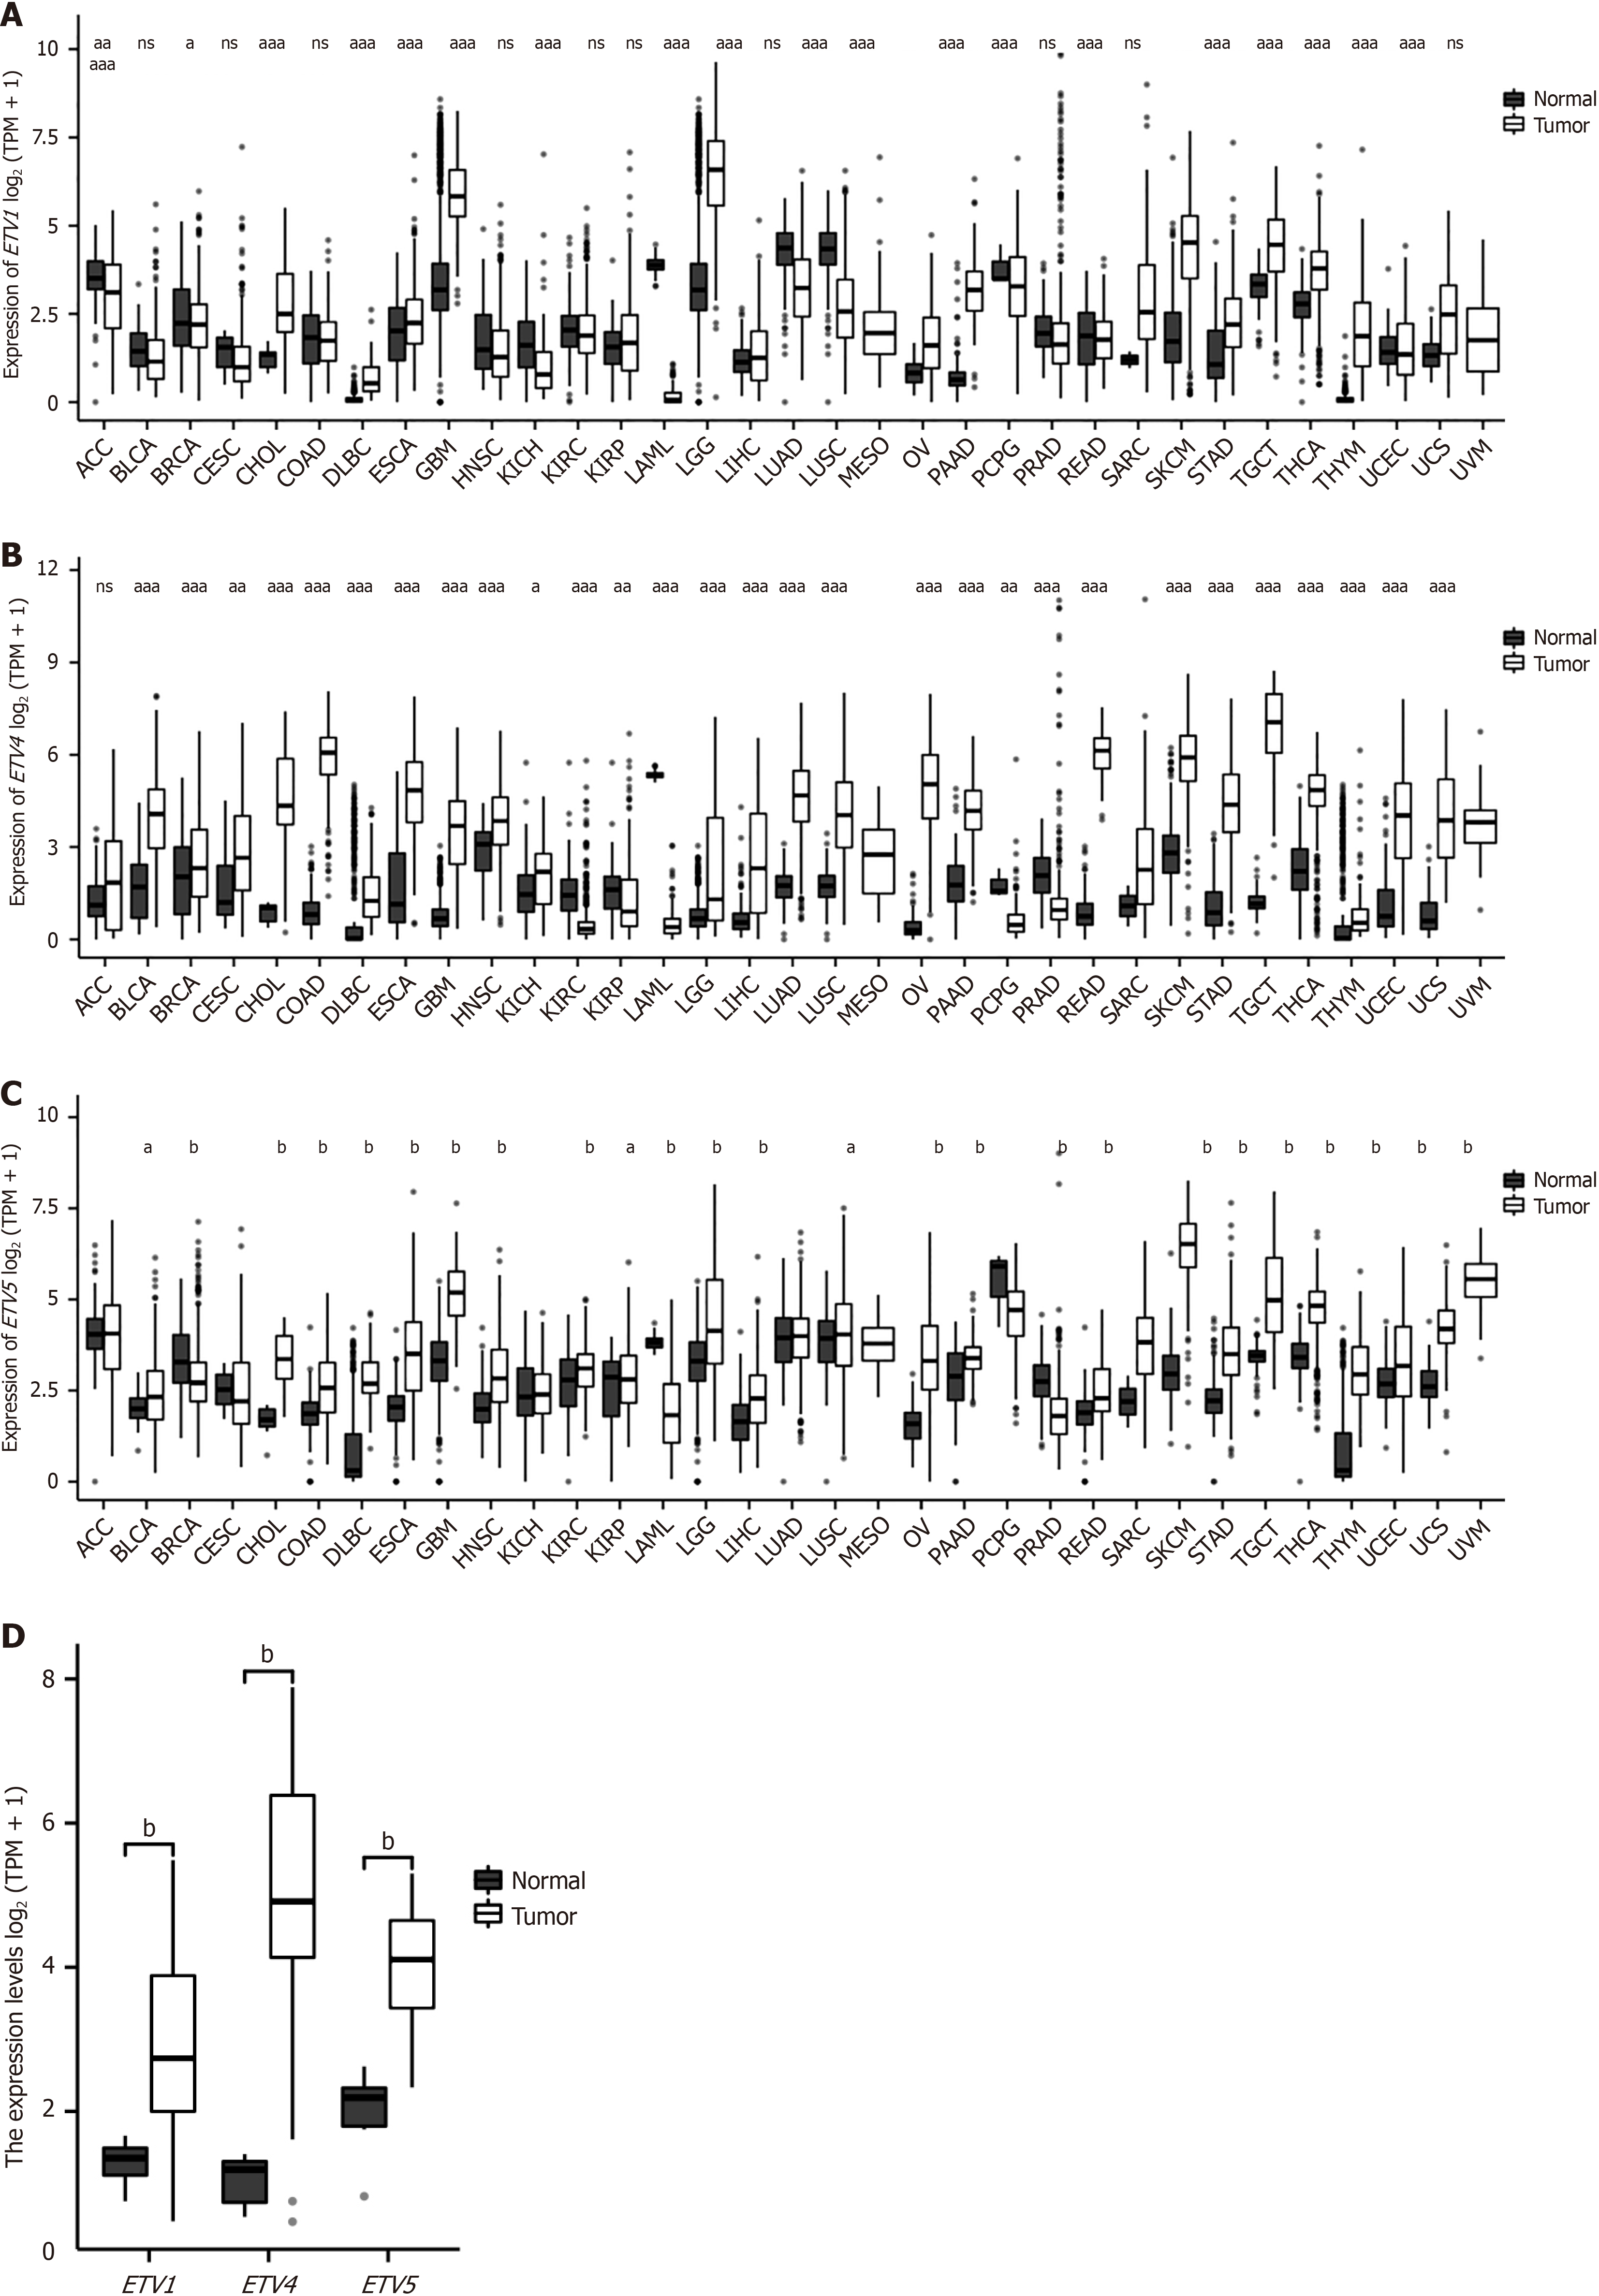
Figure 1 The expression of the PEA3 subfamily in patients with pan-cancer and cholangiocarcinoma.
A: The expression of ETV1 in pan-cancer; B: The expression of ETV4 in pan-cancer; C: The expression of ETV5 in pan-cancer; D: The boxplot of PEA3 subfamily expression in tumor and normal tissues. aP < 0.05. bP < 0.01. TPM: Transcripts per million; ACC: Adrenocortical carcinoma; BLCA: Bladder urothelial carcinoma; BRCA: Breast invasive carcinoma; CESC: Cervical squamous cell carcinoma and endocervical adenocarcinoma; CHOL: Cholangiocarcinoma; COAD: Colon adenocarcinoma; DLBC: Lymphoid neoplasm diffuse large B-cell lymphoma; ESCA: Esophageal carcinoma; GBM: Glioblastoma multiforme; HNSC: Head and neck squamous cell carcinoma; KICH: Kidney chromophobe; KIRC: Kidney renal clear cell carcinoma; KIRP: Kidney renal papillary cell carcinoma; LAML: Acute myeloid leukemia; LGG: Brain lower grade glioma; LIHC: Liver hepatocellular carcinoma; LUAD: Lung adenocarcinoma; LUSC: Lung squamous cell carcinoma; MESO: Mesothelioma; OV: Ovarian serous cystadenocarcinoma; PAAD: Pancreatic adenocarcinoma; PCPG: Pheochromocytoma and paraganglioma; PRAD: Prostate adenocarcinoma; READ: Rectum adenocarcinoma; SARC: Sarcoma; SKCM: Skin cutaneous melanoma; STAD: Stomach adenocarcinoma; TGCT: Testicular germ cell tumors; THCA: Thyroid carcinoma; THYM: Thymoma; UCEC: Uterine corpus endometrial carcinoma; UCS: Uterine carcinosarcoma; UVM: Uveal melanoma.
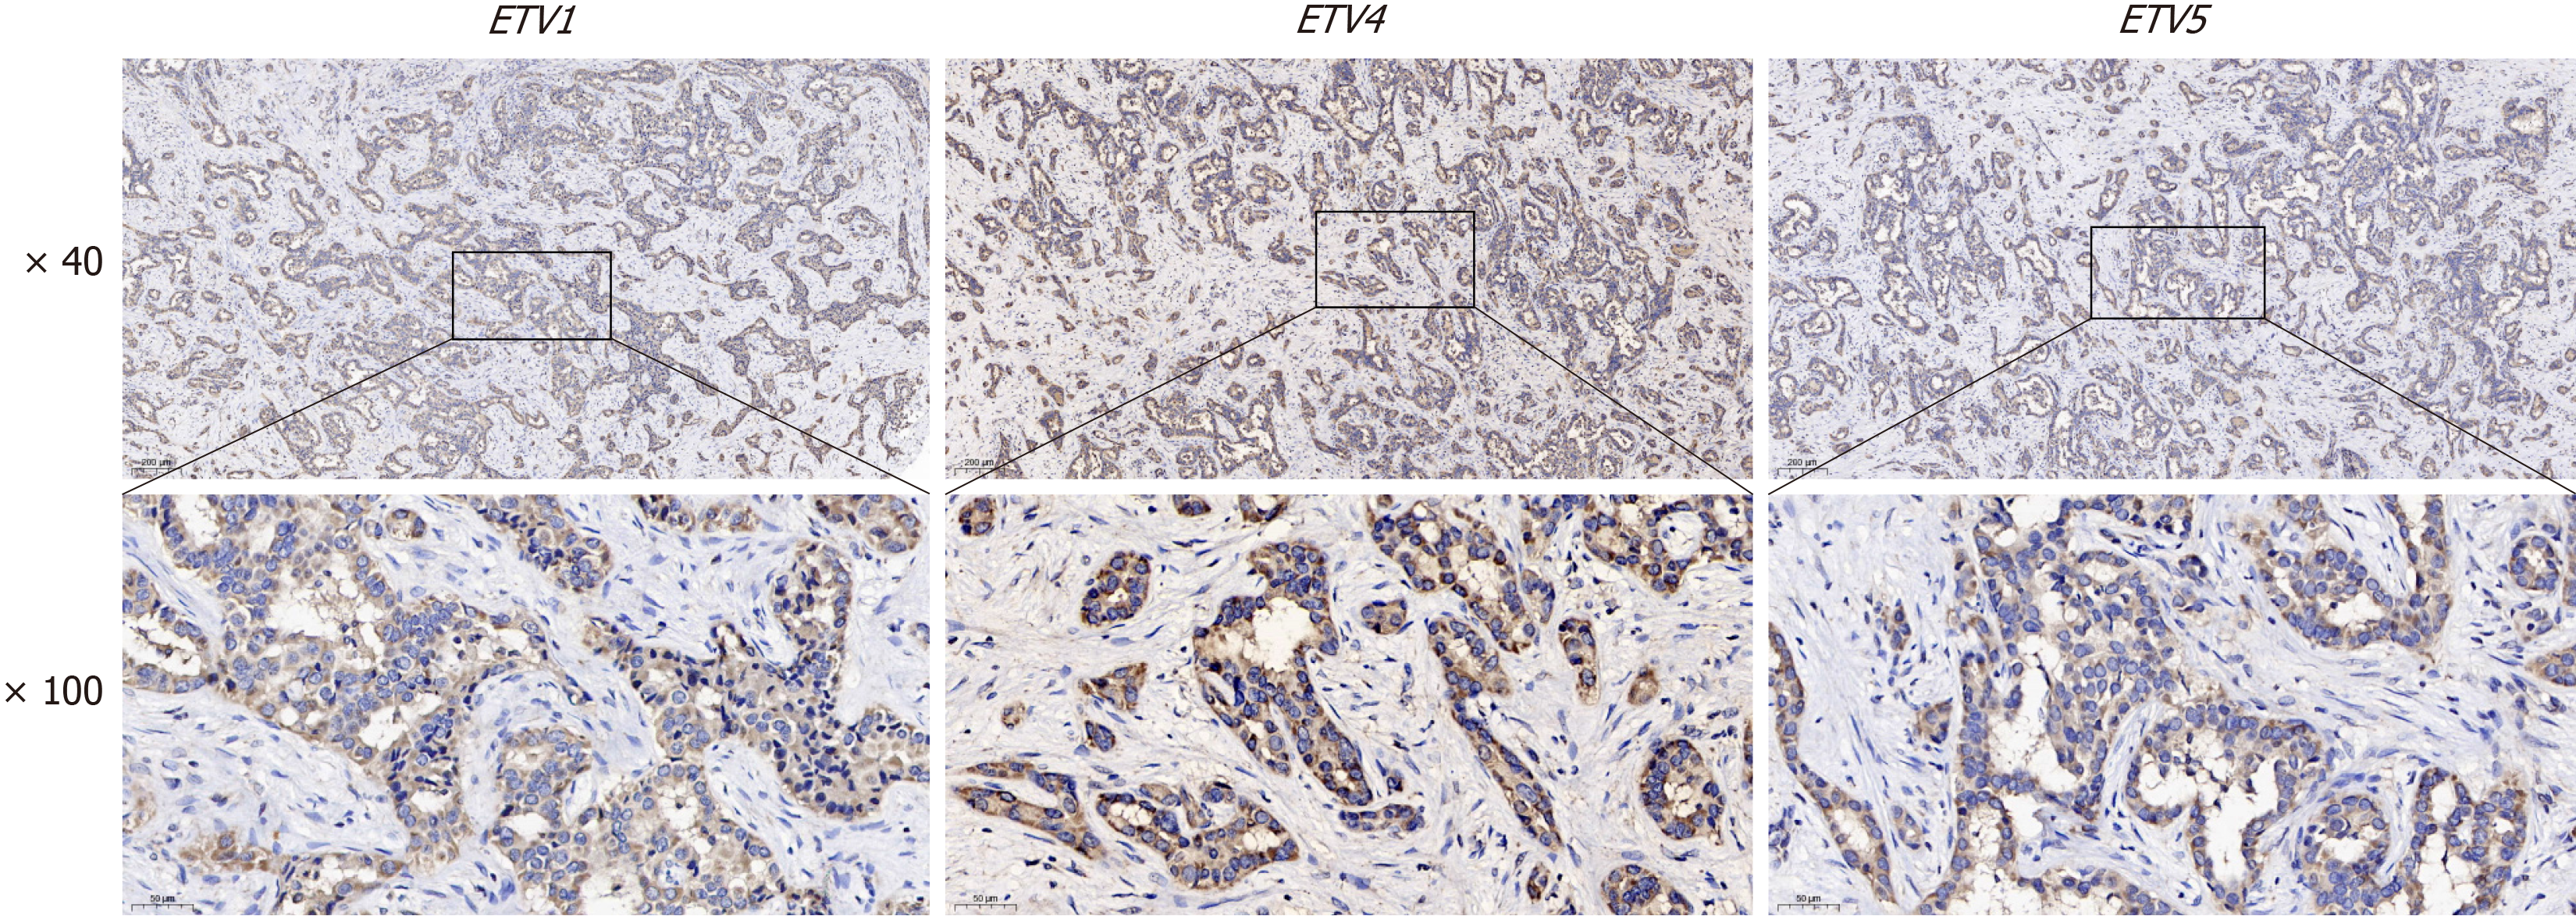
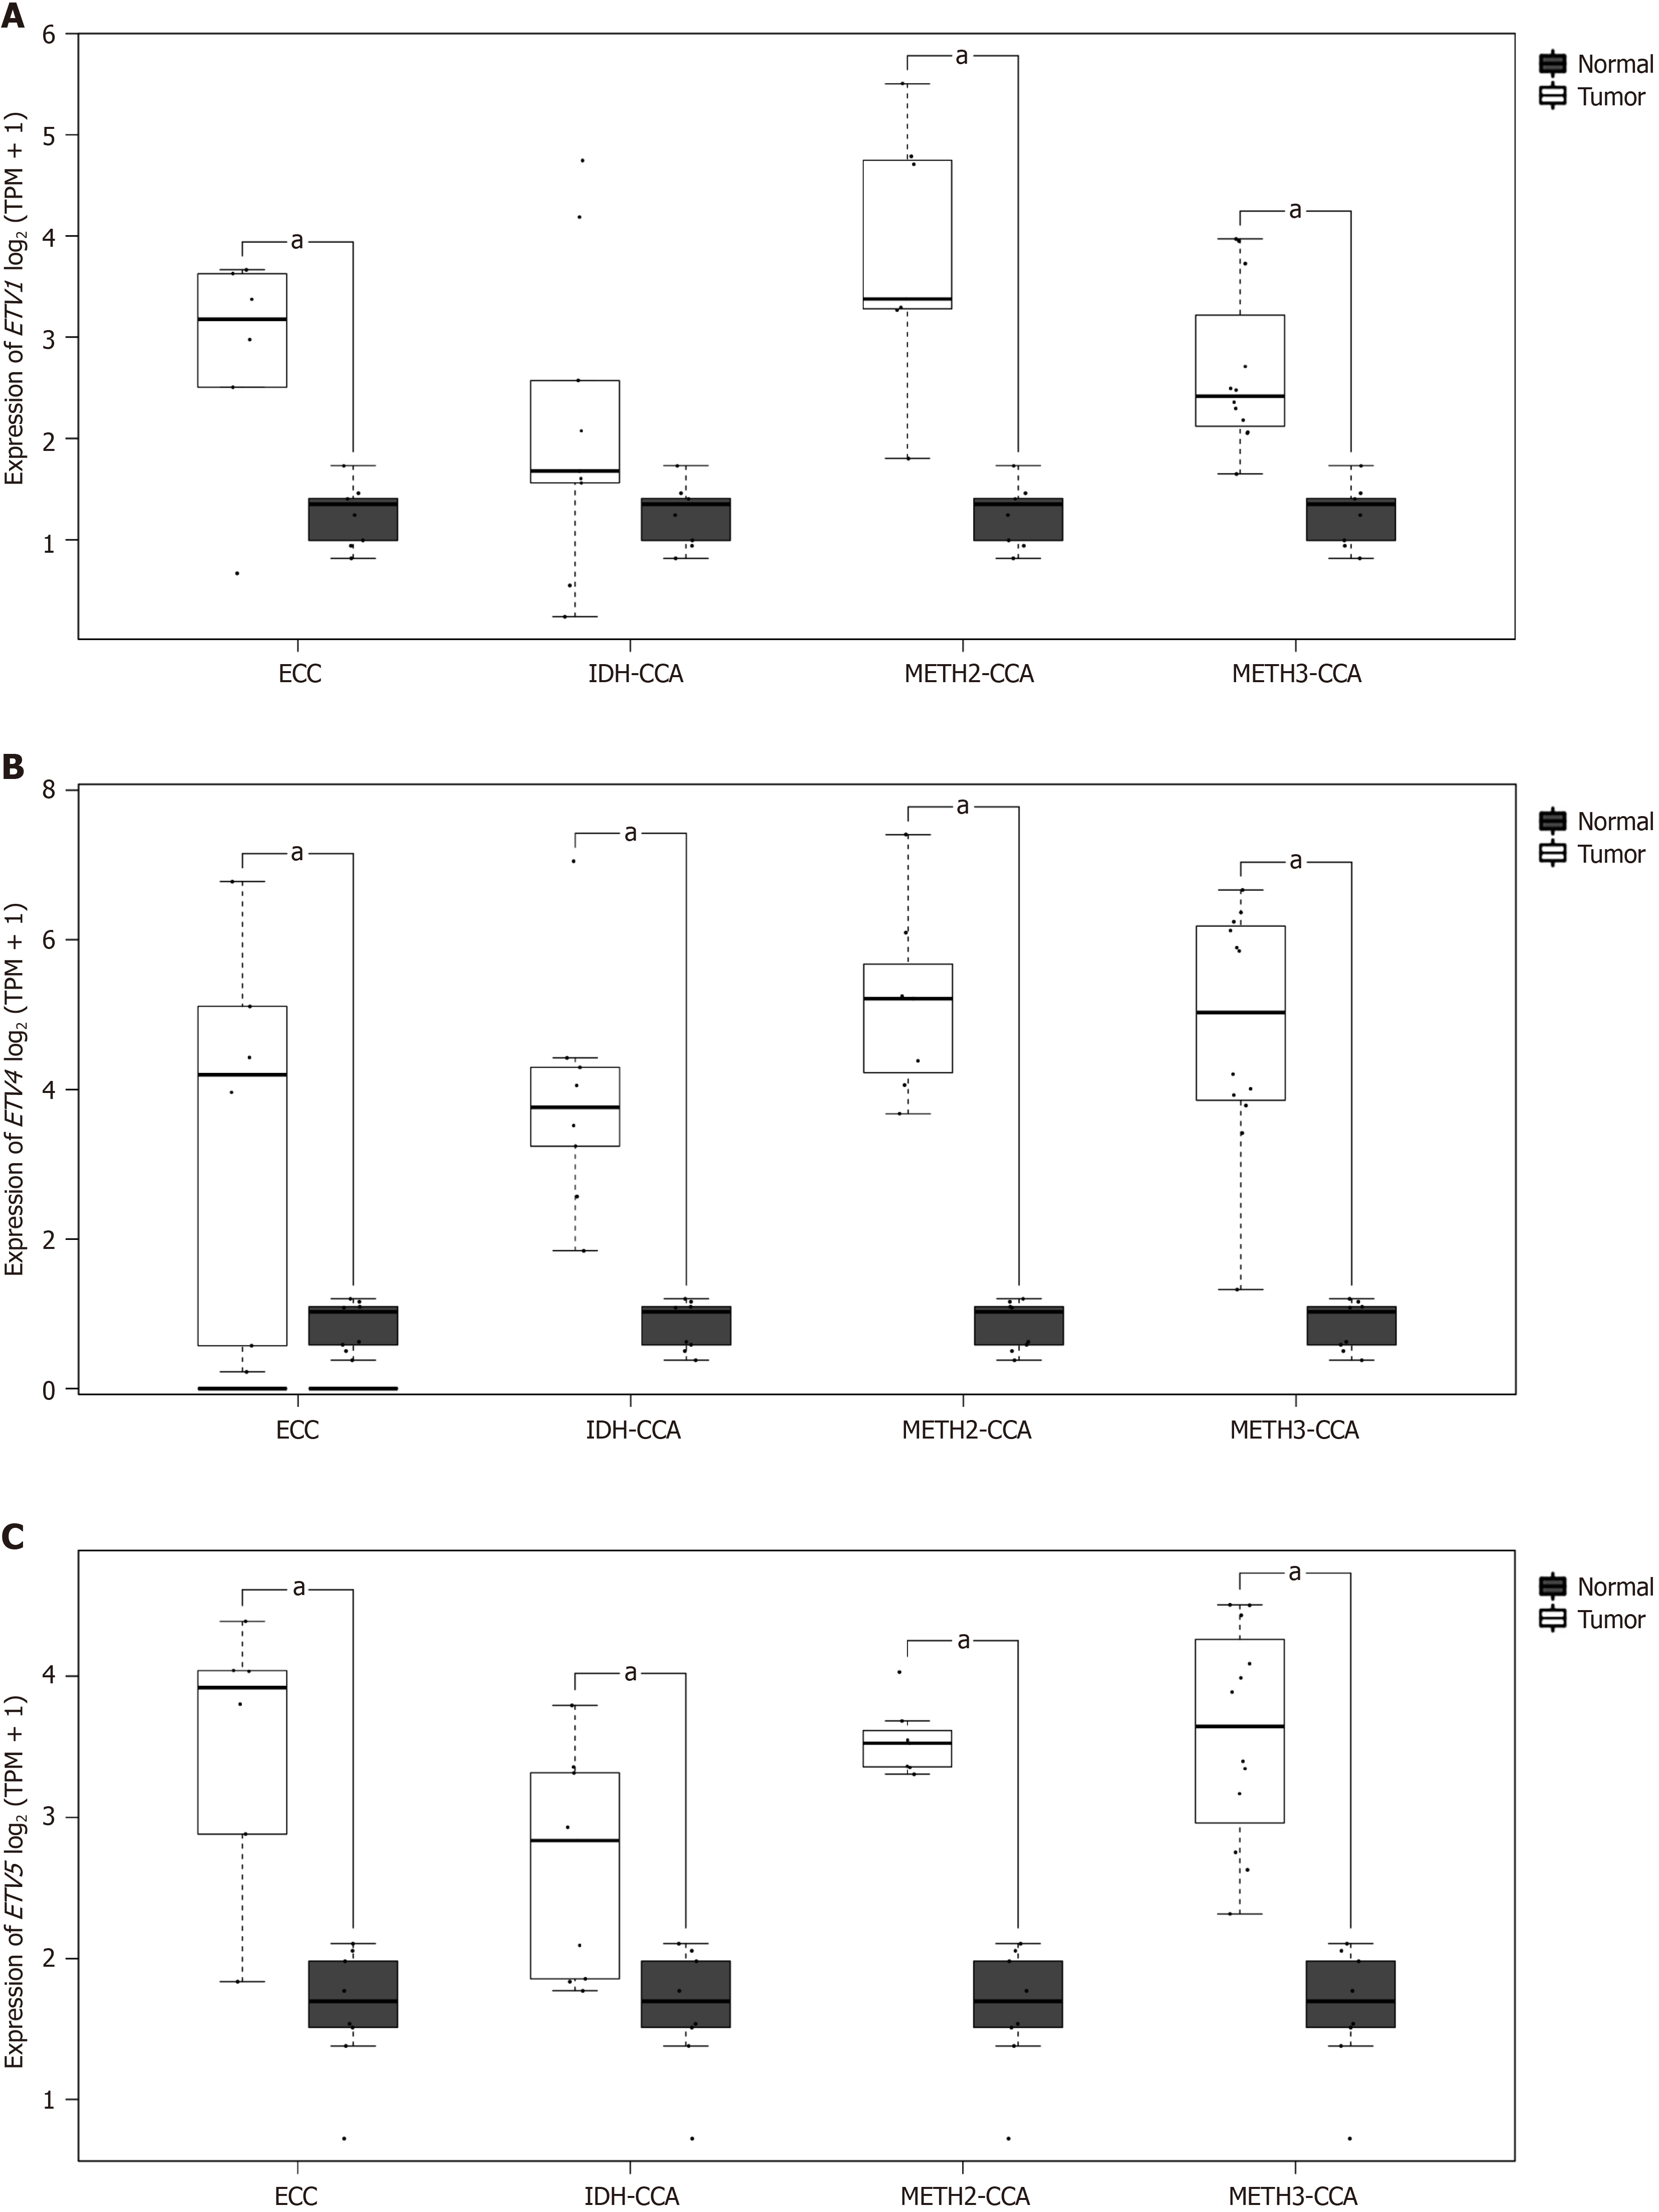
Figure 2 PEA3 subfamily expression in cholangiocarcinoma.
A: The expression of ETV1 in different subtypes of cholangiocarcinoma (CCA) was significantly higher than that in normal group; B: The expression of ETV4 in different subtypes of CCA was significantly higher than that in normal group; C: The expression of ETV5 in different subtypes of CCA was significantly higher than that in normal group.
Figure 3 Box plots of normal and tumor differential expression of PEA3 subfamily members in different subtypes of cholangiocarcinoma.
aP < 0.05. TPM: Transcripts per million; ECC: Extrahepatic cholangiocarcinoma; IDH-CCA: Isocitrate dehydrogenase cholangiocarcinoma; METH2-CCA: Methylation cluster 2 cholangiocarcinoma; METH3-CCA: Methylation cluster 3 cholangiocarcinoma.
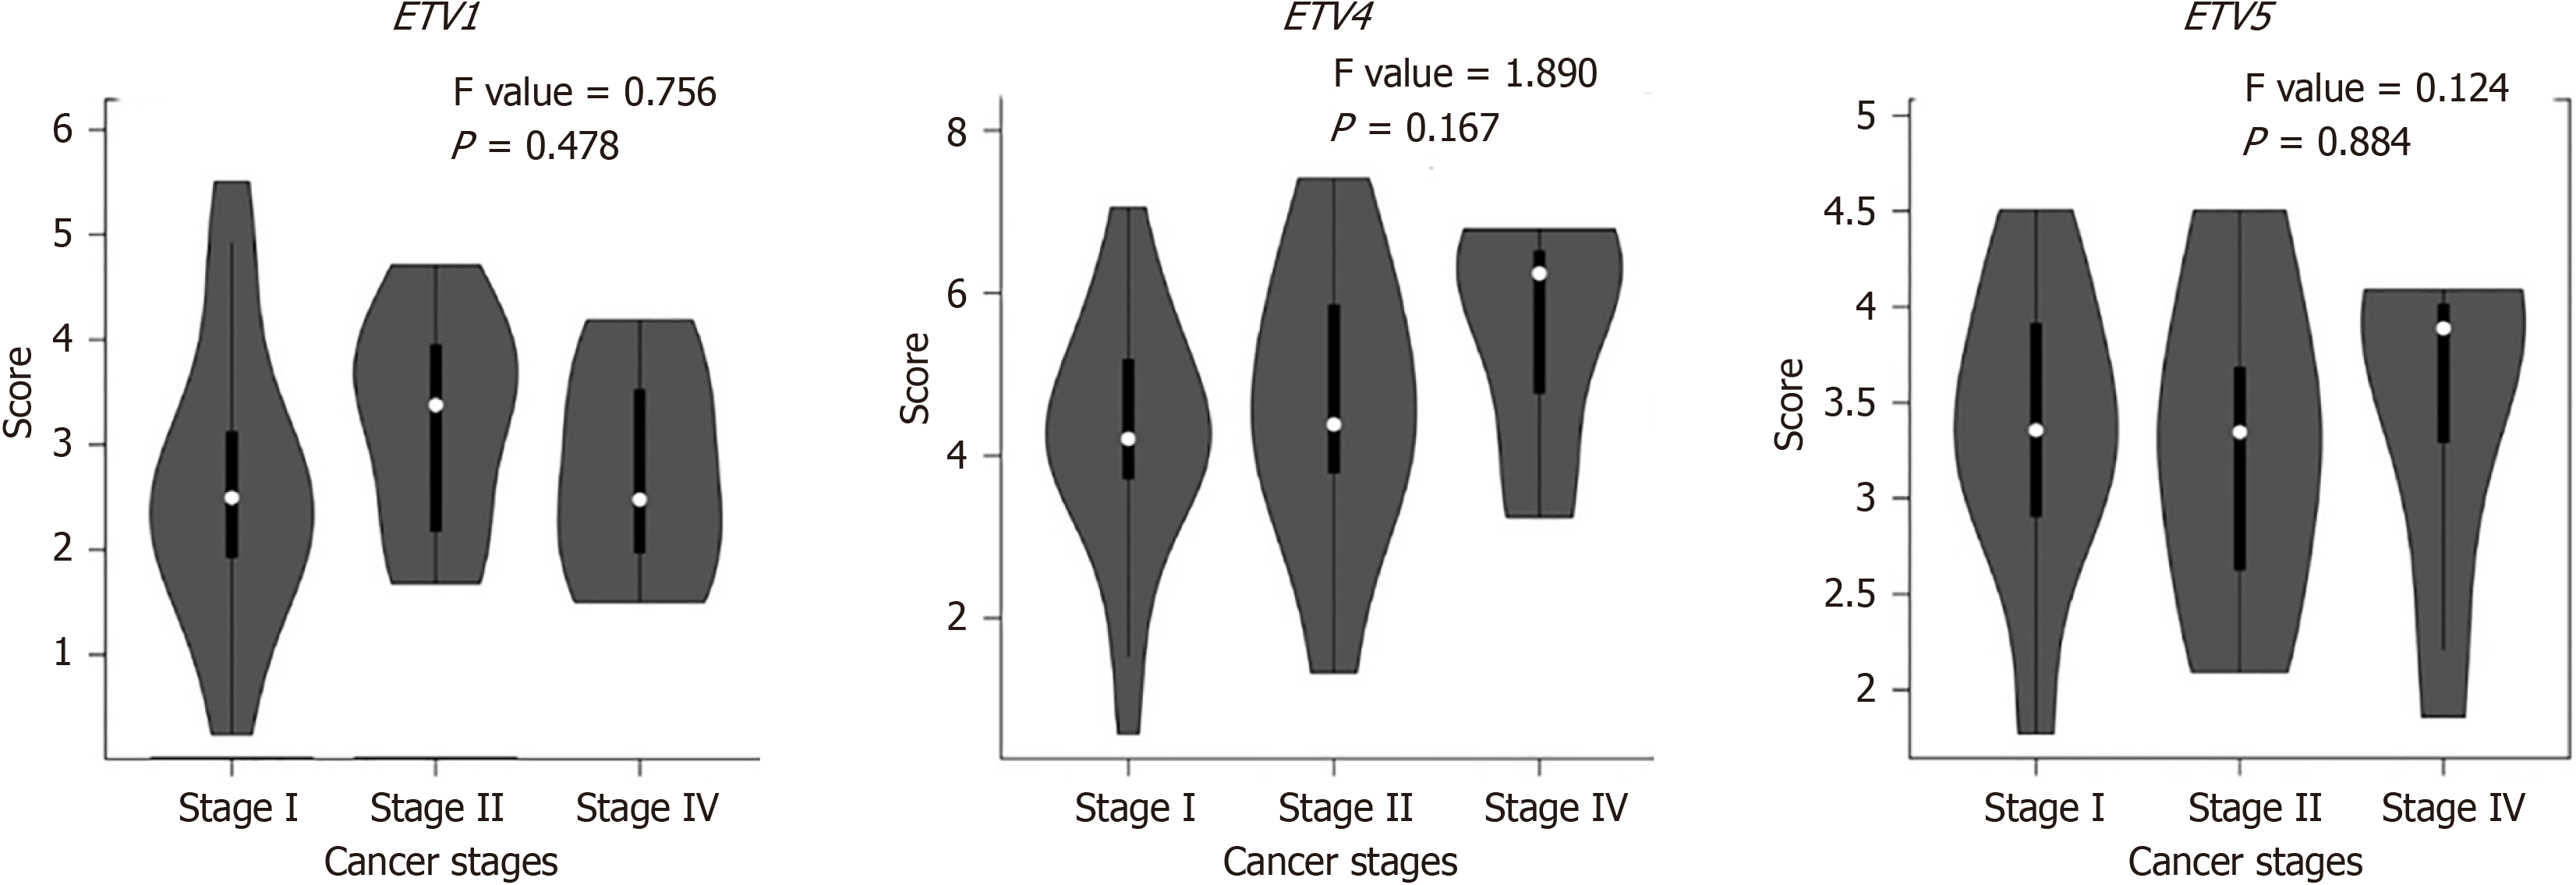
Figure 4
Relationship between expression of distinct PEA3 subfamily family members and individual cancer stages of cholangiocar
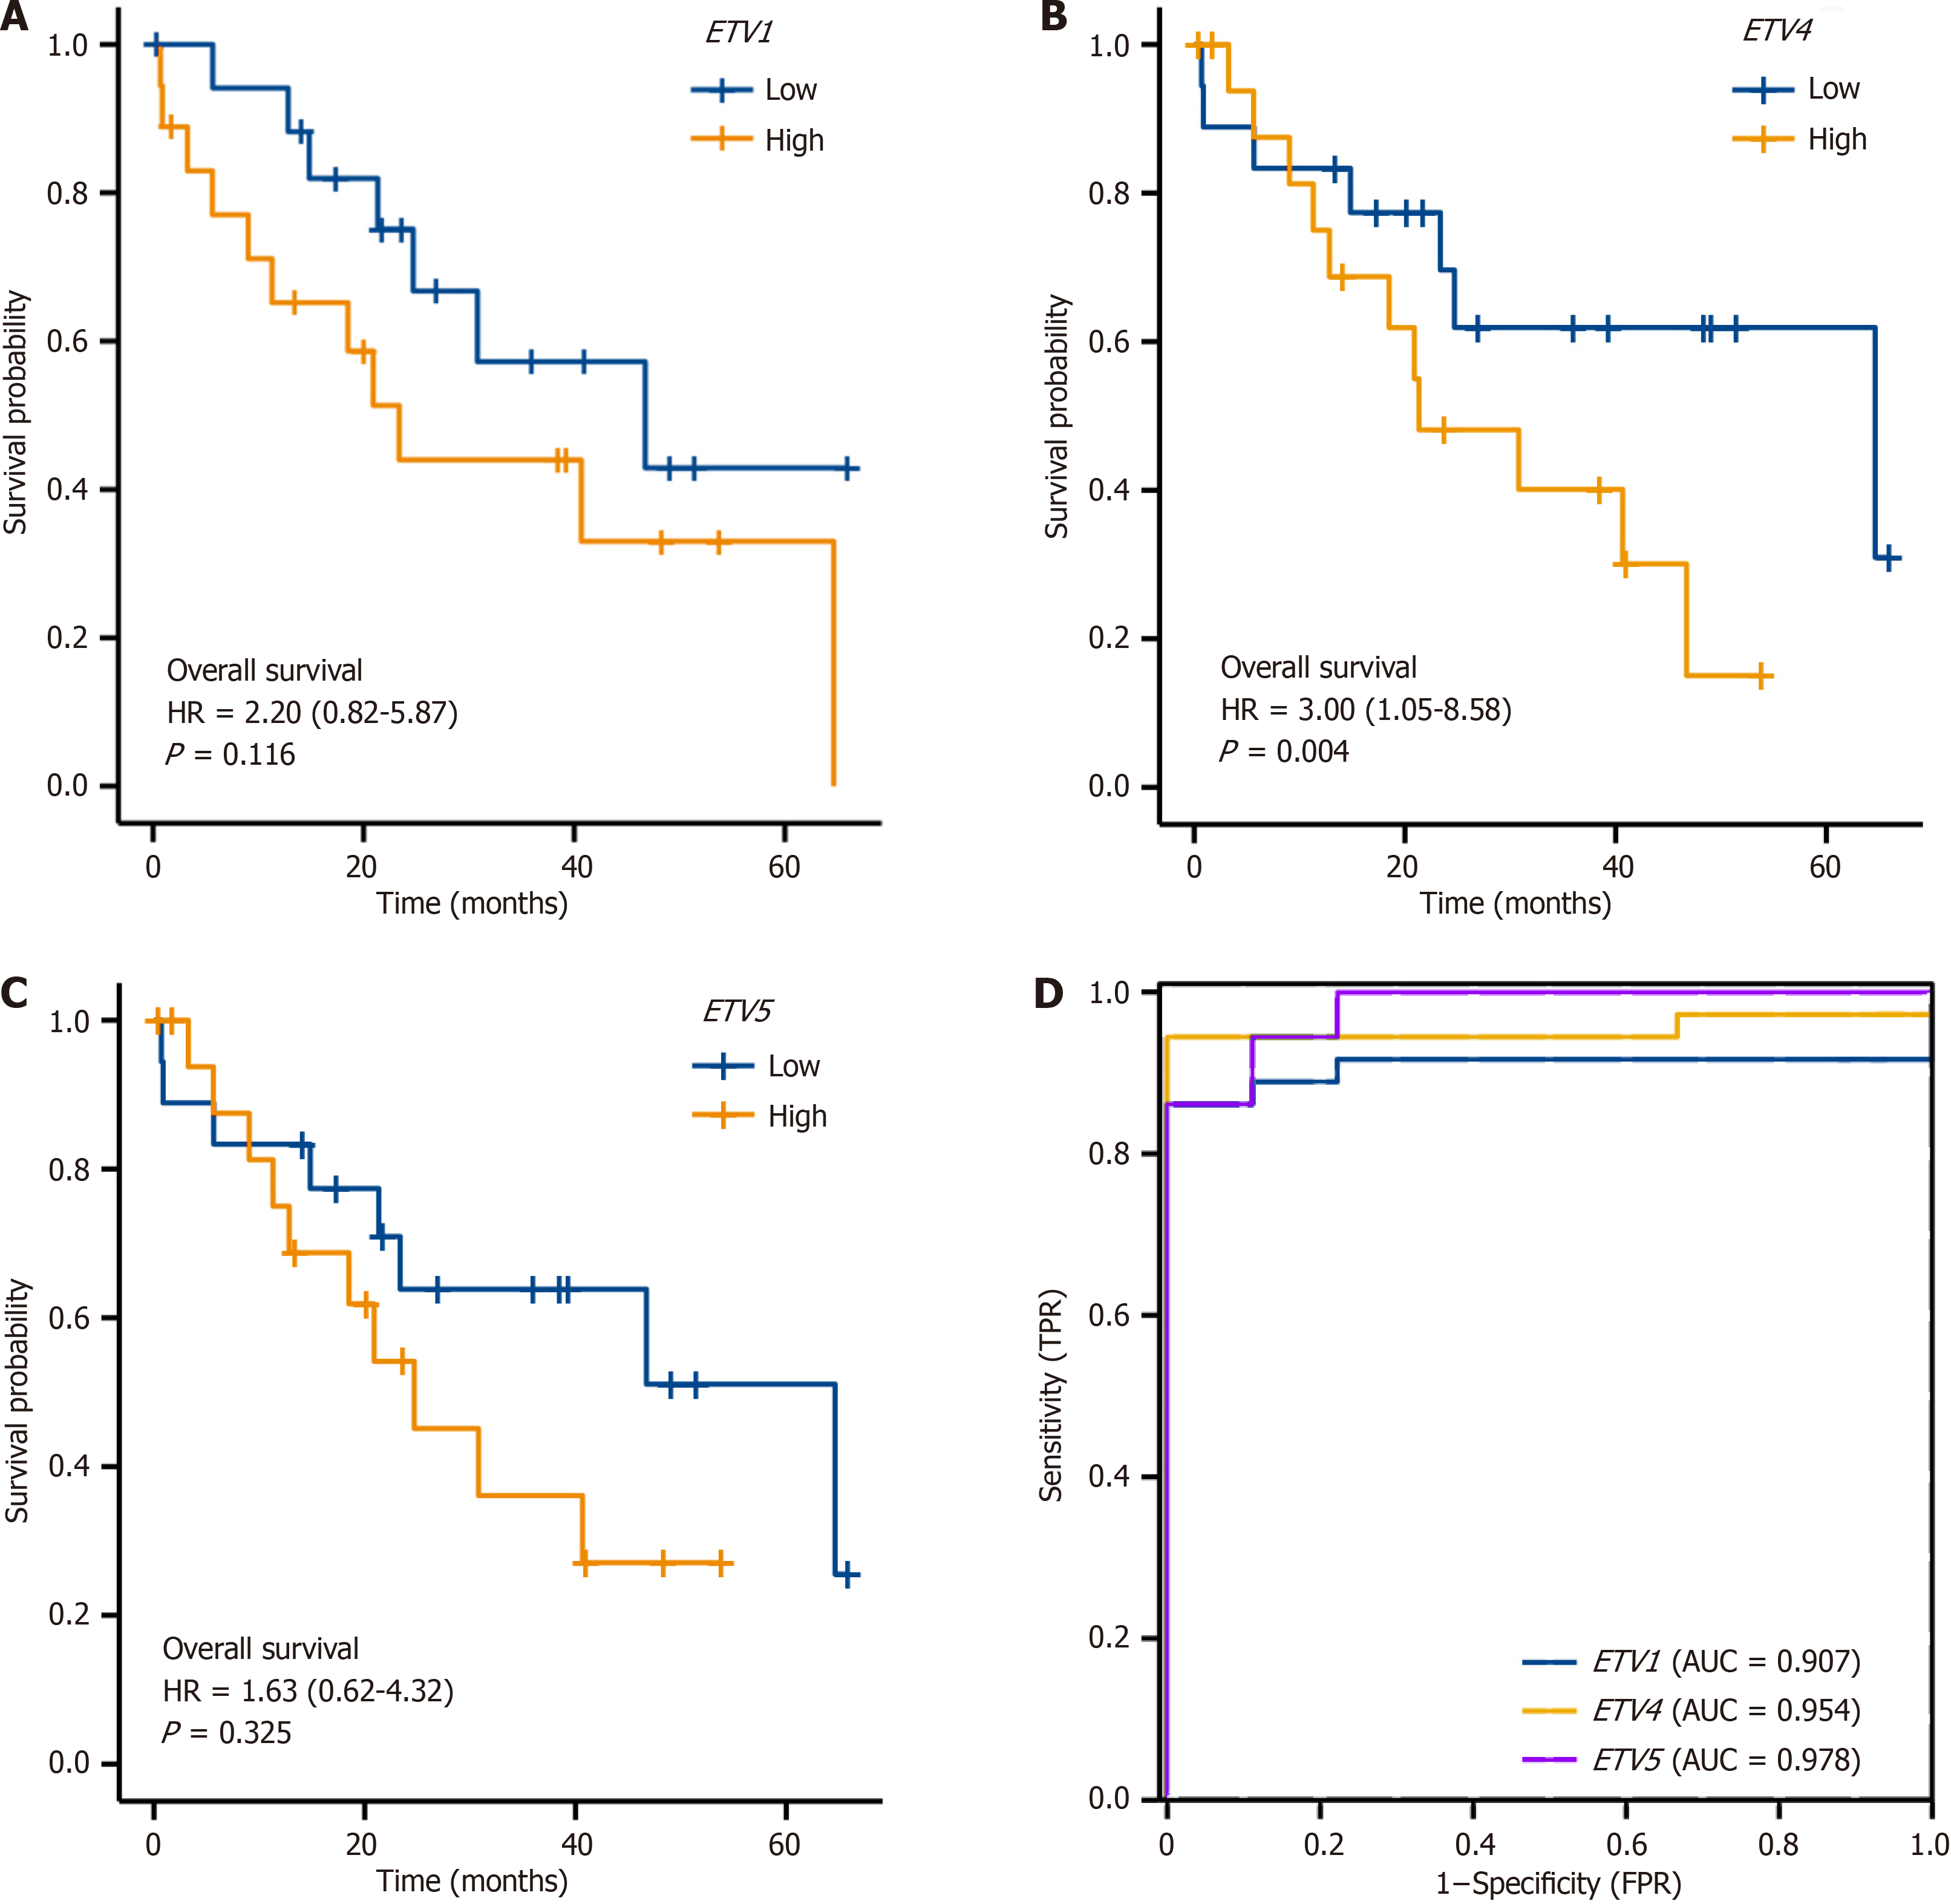
Figure 5 Prognostic value of expression of distinct PEA3 subfamily members in cholangiocarcinoma patients.
A: ETV1 expression showed no correlation with prognosis in cholangiocarcinoma (CCA) patients B: Higher expressions of ETV4 were significantly associated with shorter overall survival of CCA patients; C: ETV5 expression showed no correlation with prognosis in CCA patients; D: ETV1, ETV4, and ETV5 has high accuracy in predicting tumors (area under curve = 0.907, 0.954, 0.978). HR: Hazard ratio; FPR: False positive rate; TPR: True positive rate.
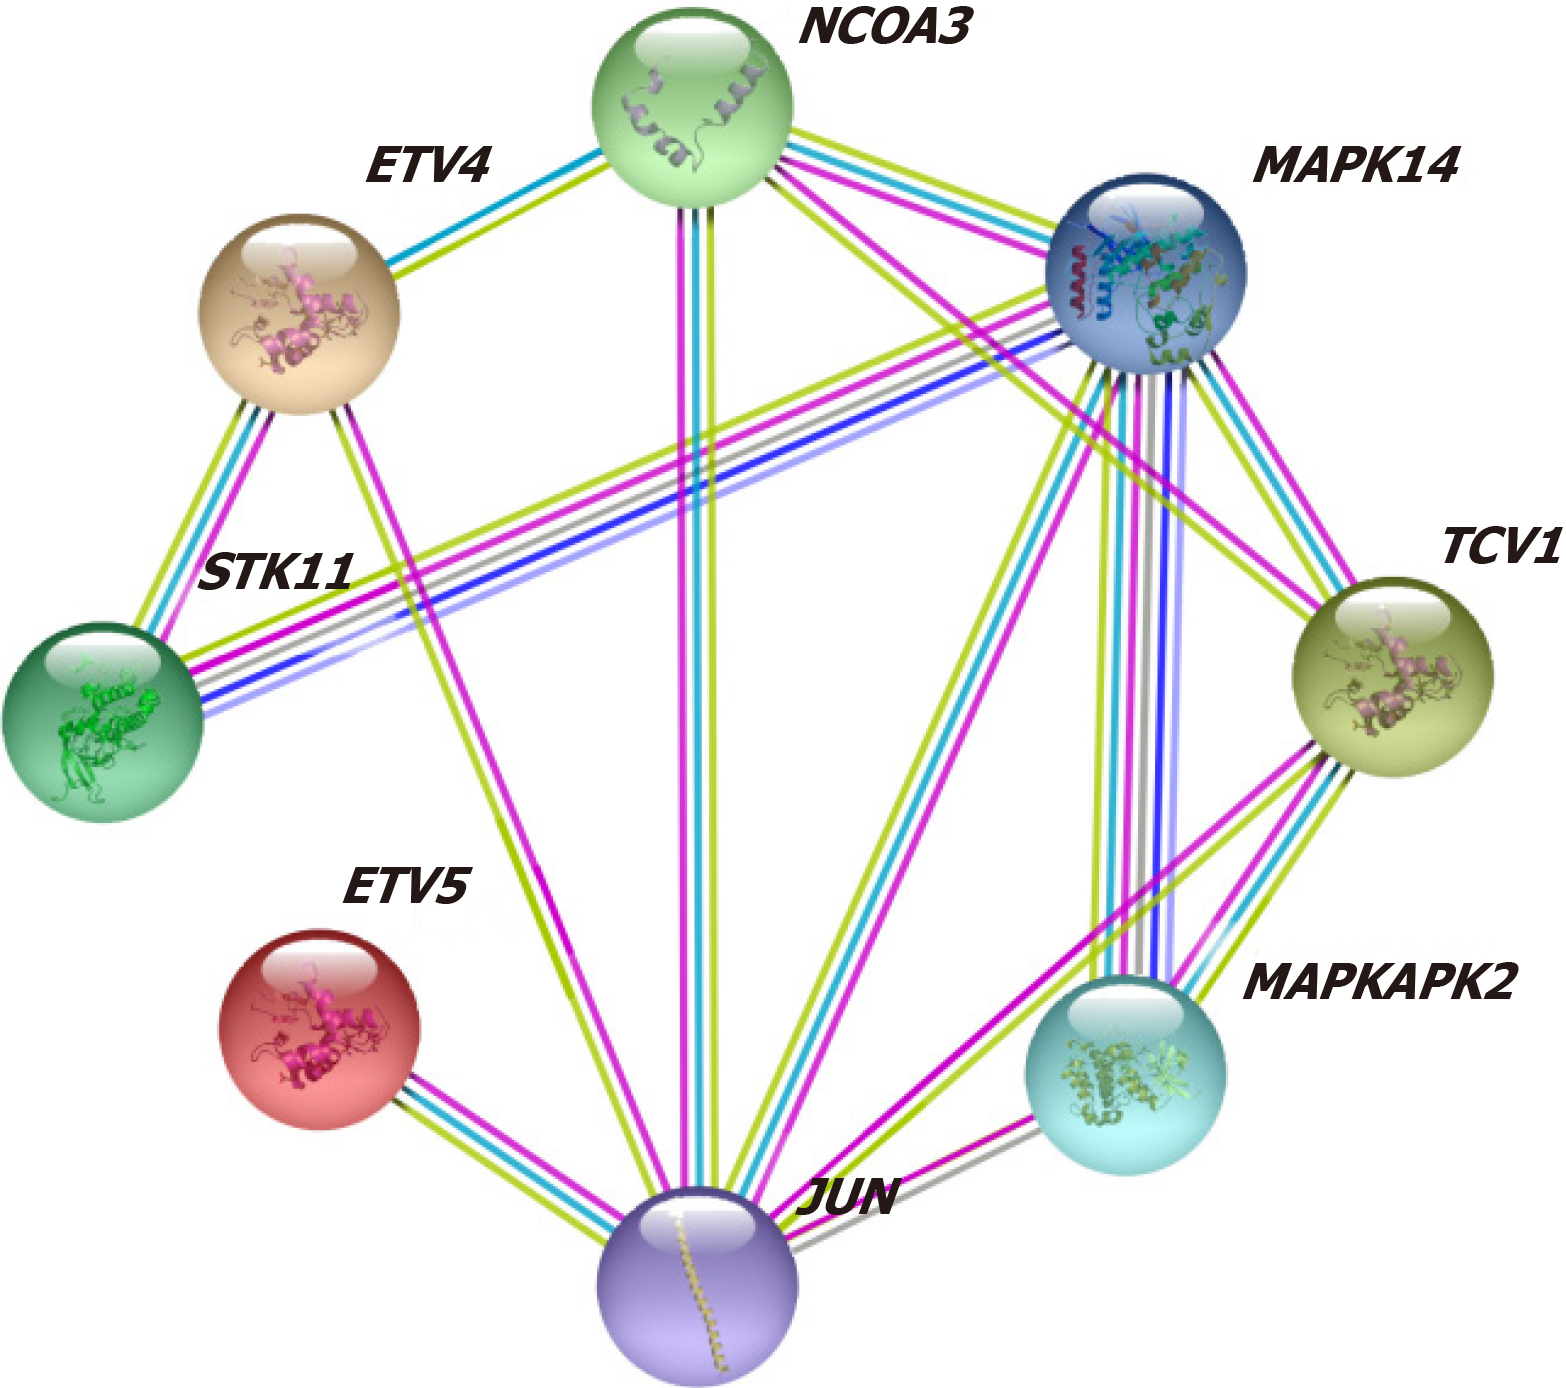
Figure 6
The network of splice isoforms or post-translational modifications for PEA3 subfamily function.
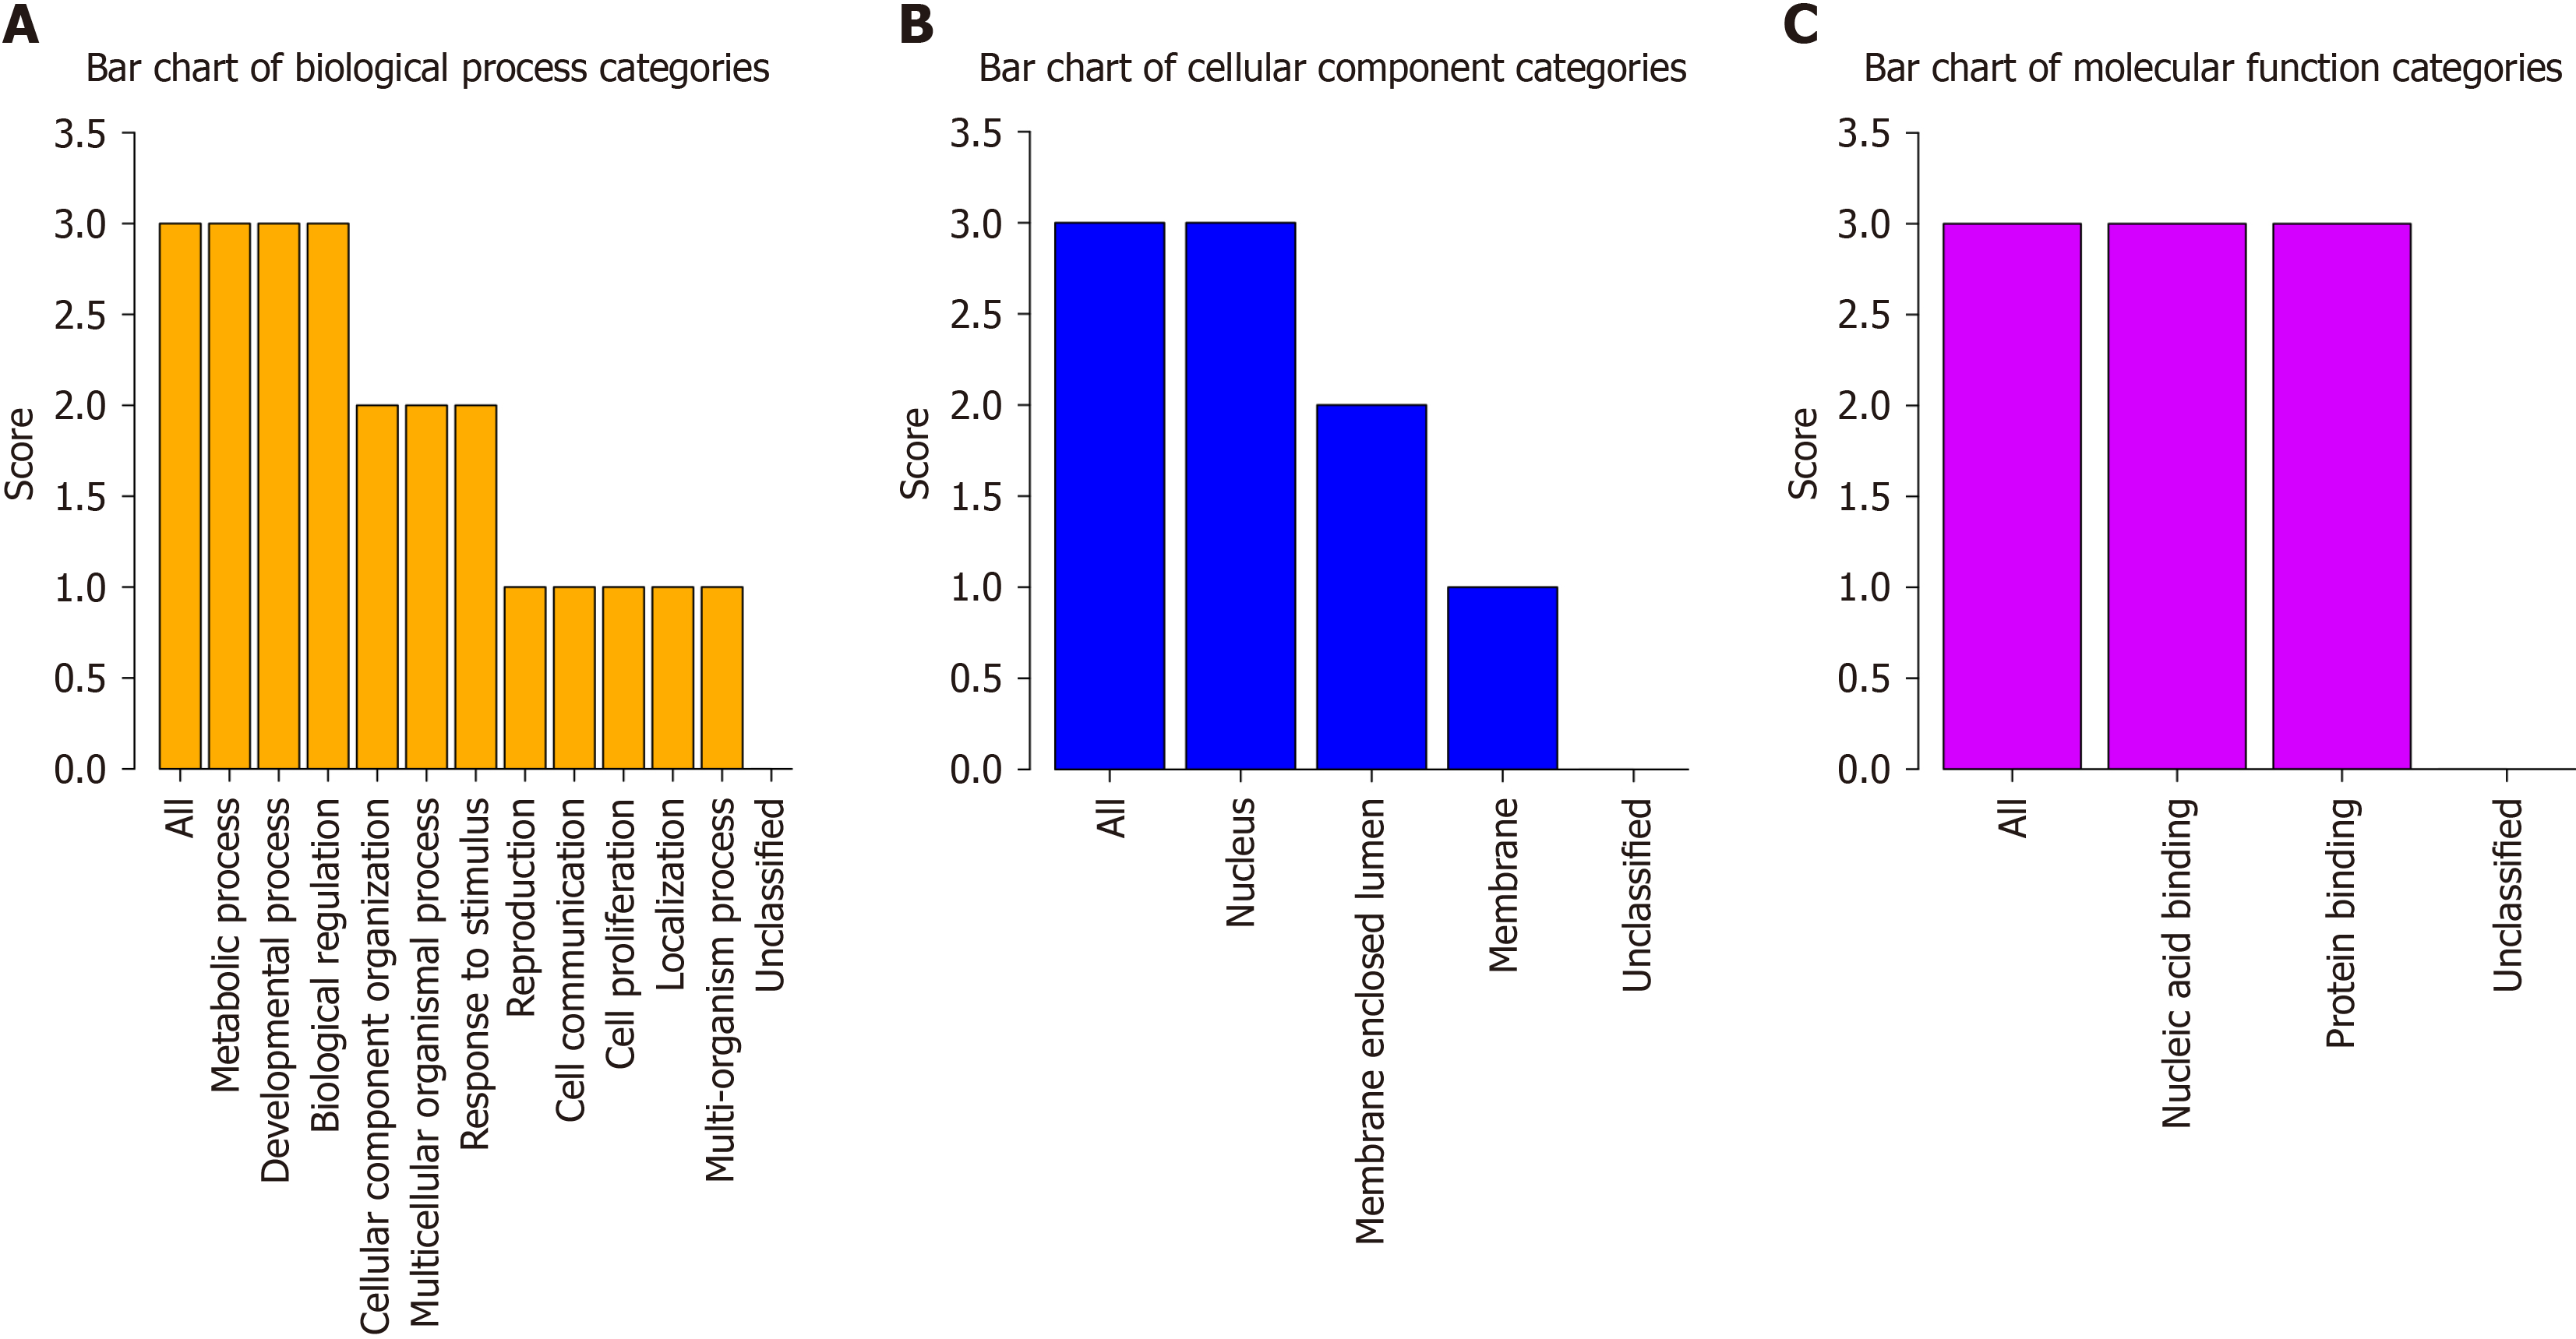
Figure 7 Gene-annotation enrichment analysis of PEA3 subfamily for gene ontology.
A: Biological process; B: Cellular component; C: Molecular function.
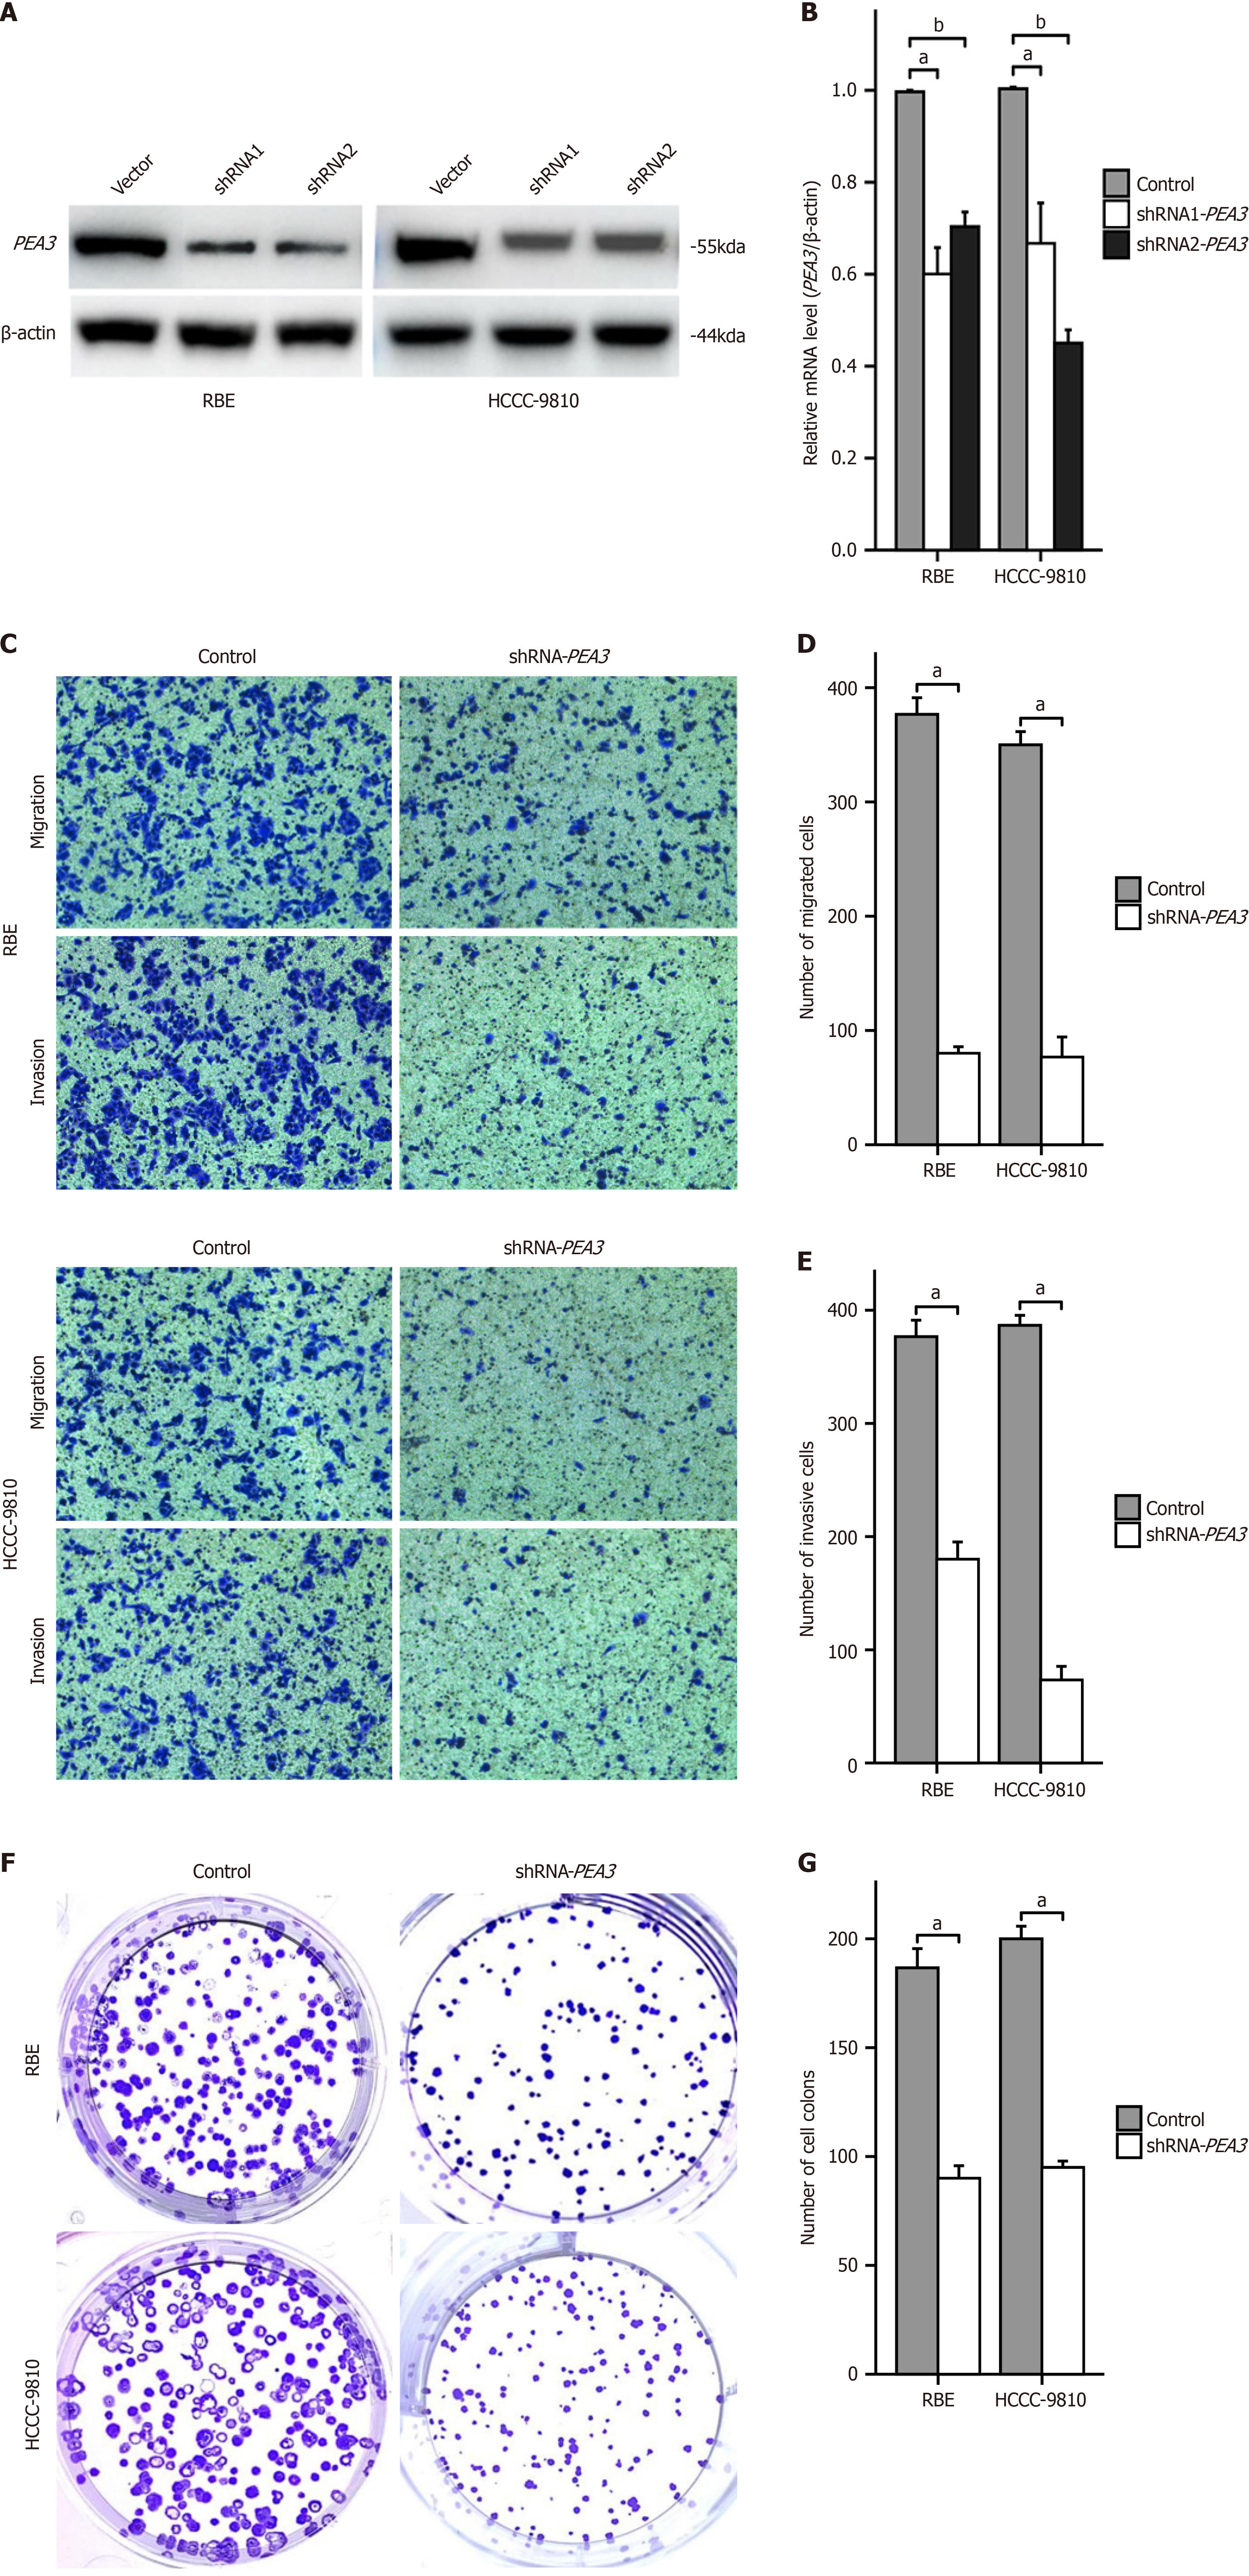
Figure 8 Inhibition of cholangiocarcinoma cell function after transfection with shRNA-PEA3 in vitro.
A: PEA3 expression was considerably decreased in Rihoku bile duct epithelial (RBE) and human cholangiocarcinoma cells-9810 followed transfection with shRNA-PEA3; B: Statistics of the relative mRNA level; C: Transwell analysis showed the migration and invasion ability of RBE cells transfected with shRNA-PEA3; D: Statistics of the number of migrated cells; E: Statistics of the number of invading cells; F: Colony formation assay showing the proliferative capacity of RBE cells after transfection with shRNA-PEA3; G: Statistics of the number of colon cells. aP < 0.05. bP < 0.01. RBE: Rihoku bile duct epithelial; HCCC-9810: Human cholangiocarcinoma cells-9810.
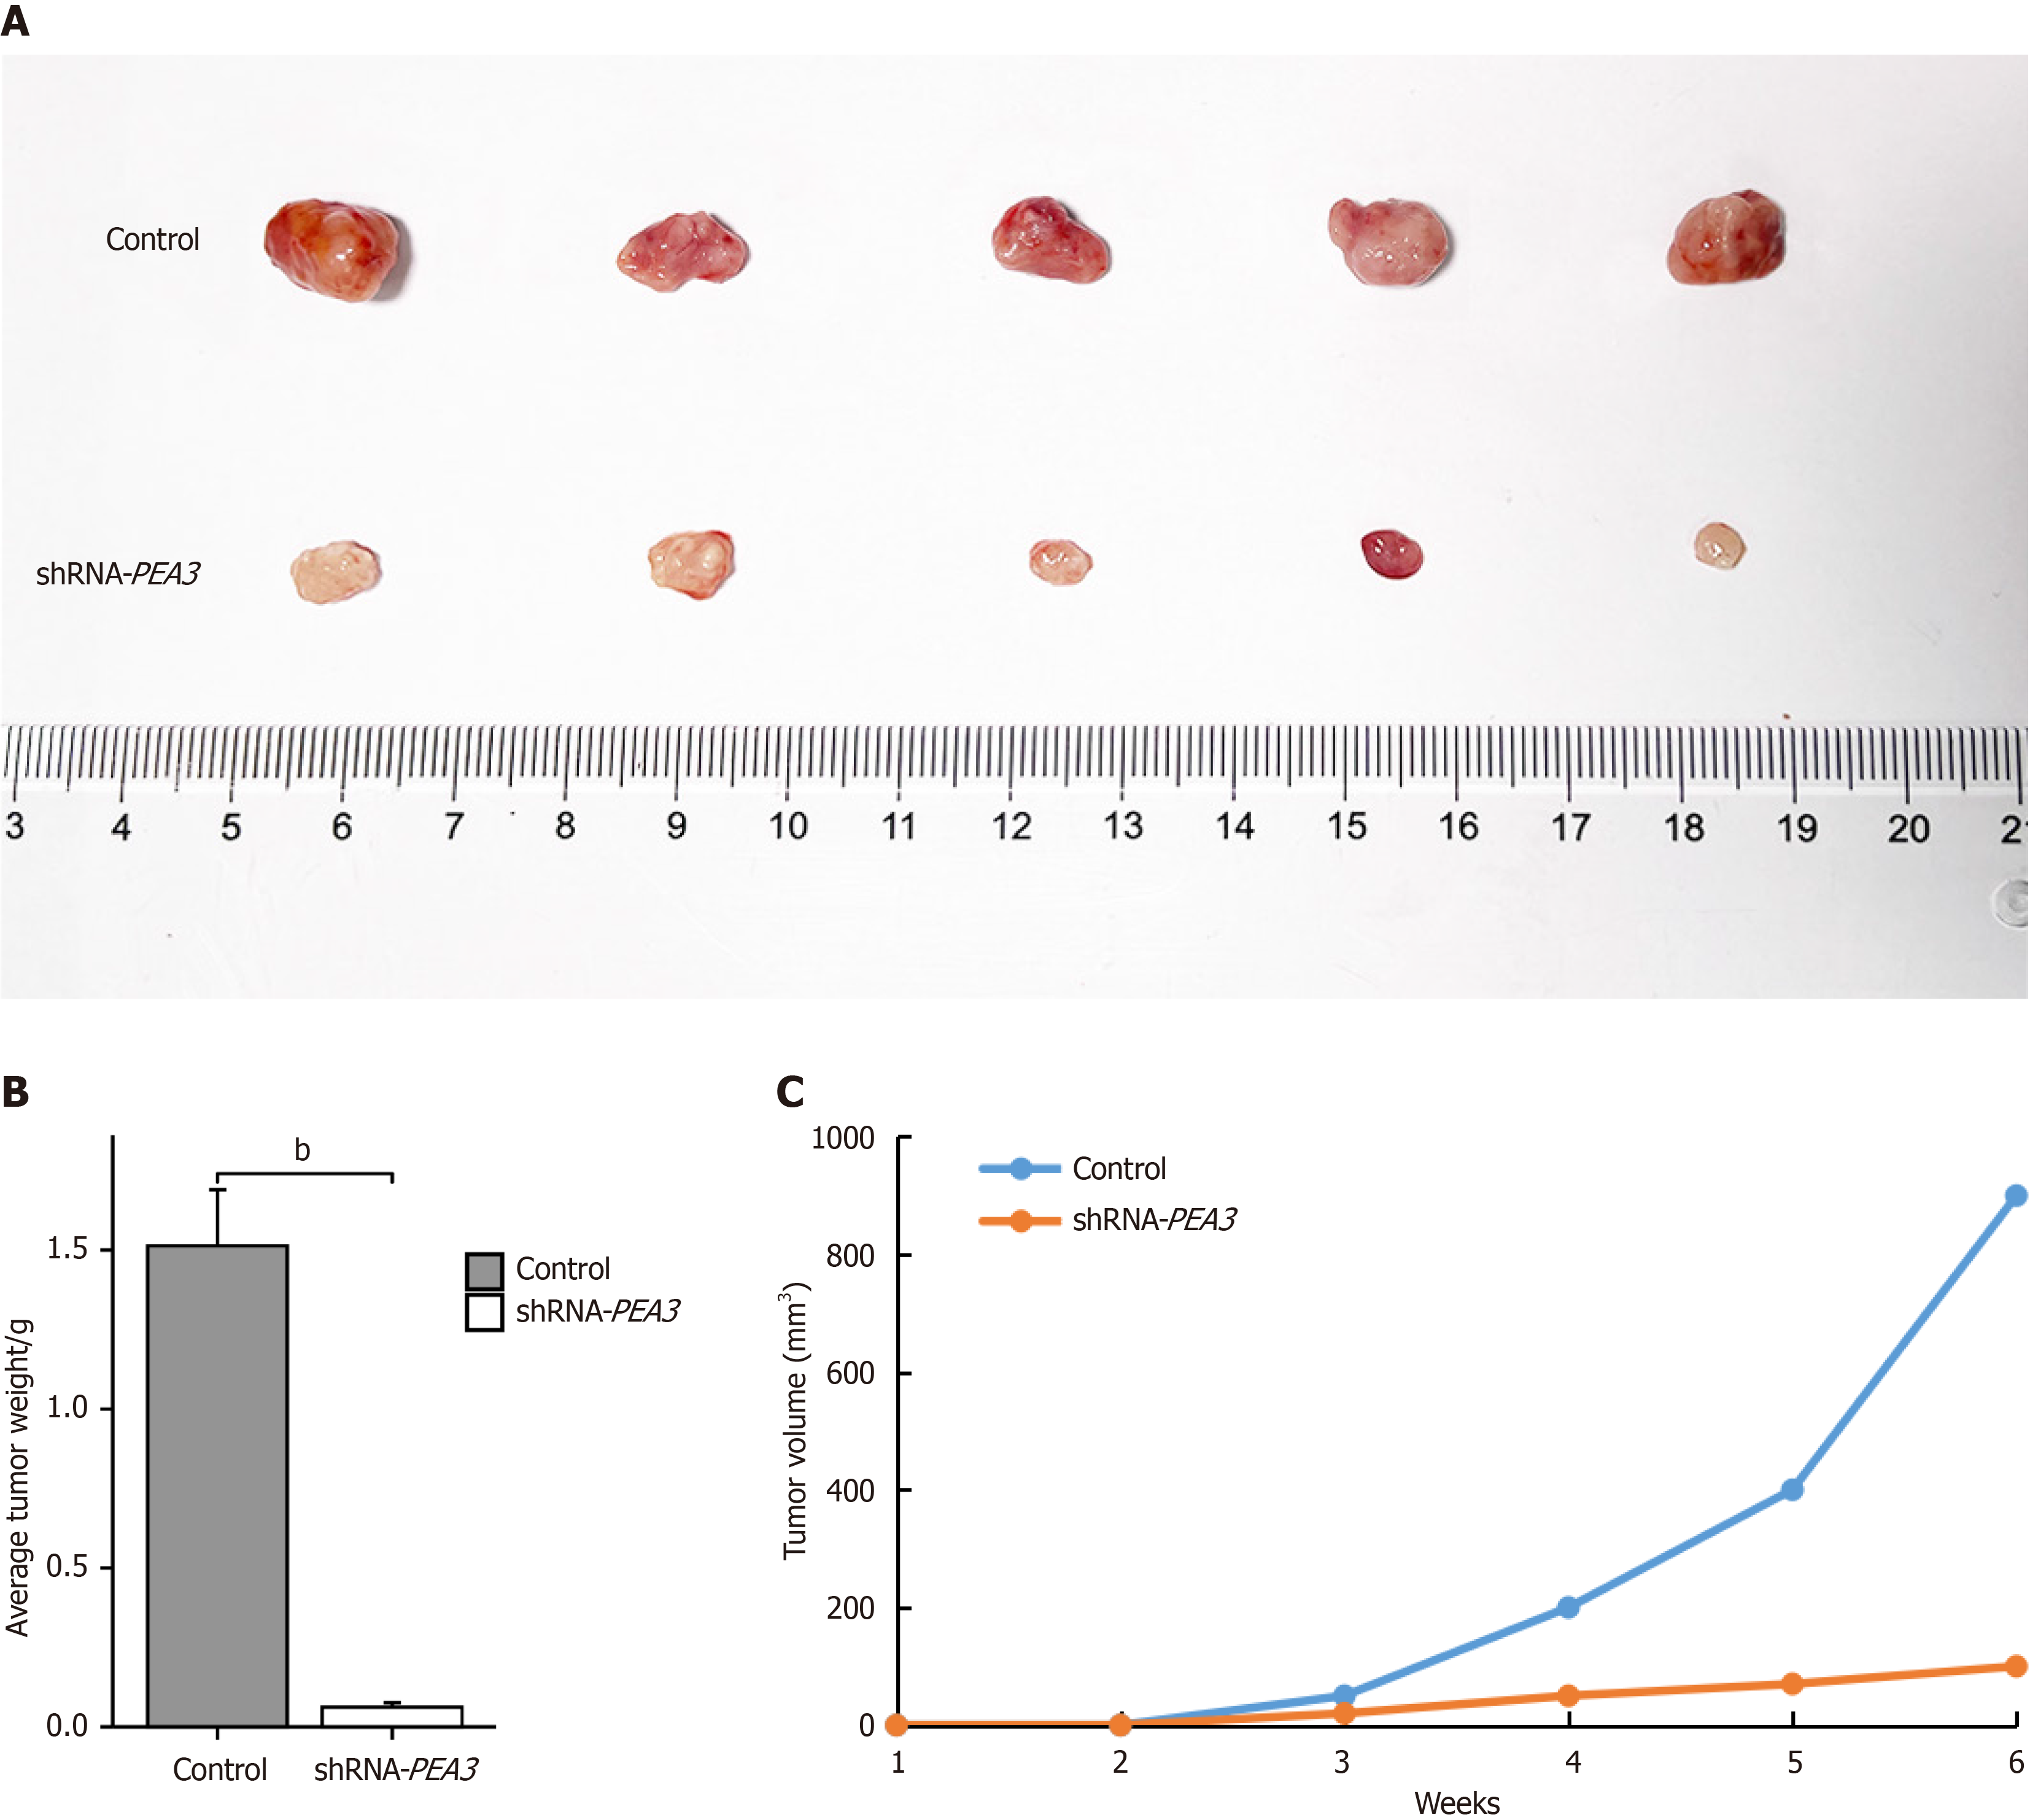
Figure 9 Inhibition of cholangiocarcinoma cell function after transfection with shRNA-PEA3 in vivo.
A: Comparison of subcutaneous tumor weight; B: Statistics of subcutaneous tumor weight; C: The growth rate of subcutaneous tumor volume. bP < 0.01.
- Citation: Wang L, Zhang Z, Ma HZ. Prognostic value of PEA3 subfamily gene expression in cholangiocarcinoma. World J Gastrointest Oncol 2024; 16(9): 4014-4027
- URL: https://www.wjgnet.com/1948-5204/full/v16/i9/4014.htm
- DOI: https://dx.doi.org/10.4251/wjgo.v16.i9.4014


