Copyright
©The Author(s) 2024.
World J Gastrointest Oncol. Sep 15, 2024; 16(9): 3932-3954
Published online Sep 15, 2024. doi: 10.4251/wjgo.v16.i9.3932
Published online Sep 15, 2024. doi: 10.4251/wjgo.v16.i9.3932
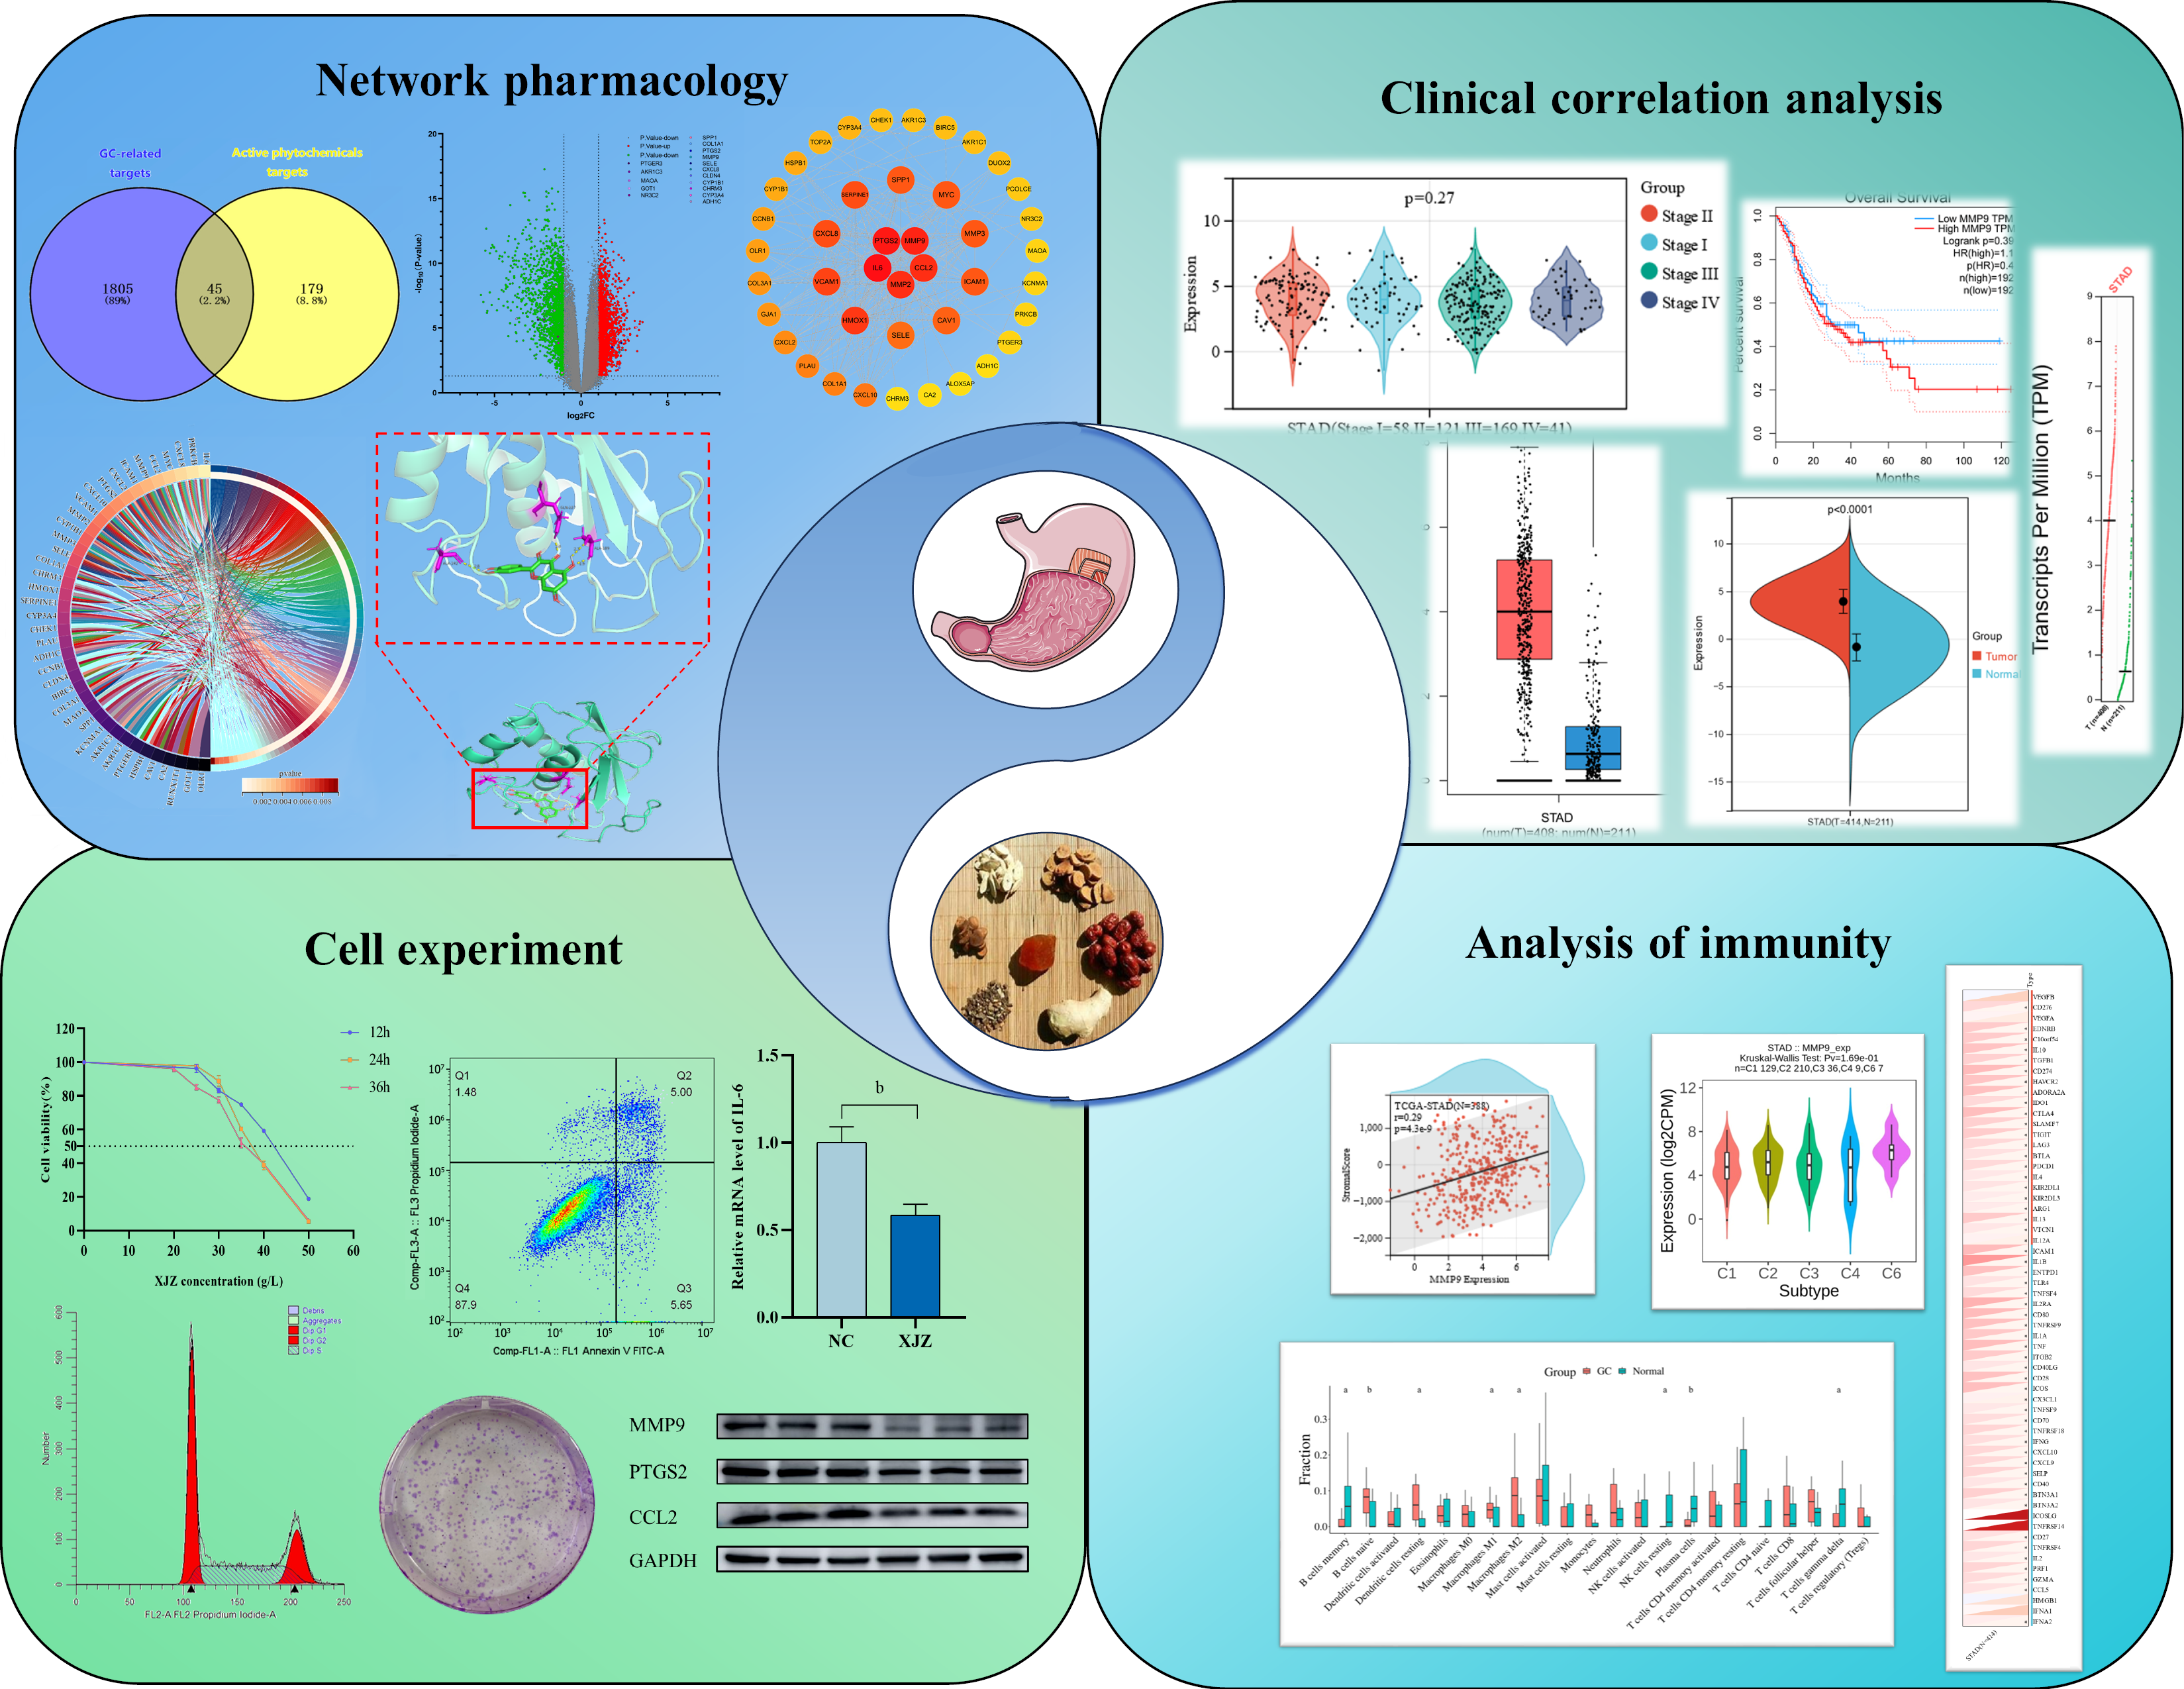
Figure 1 Flow chart of the study.
aP < 0.05, bP < 0.01.
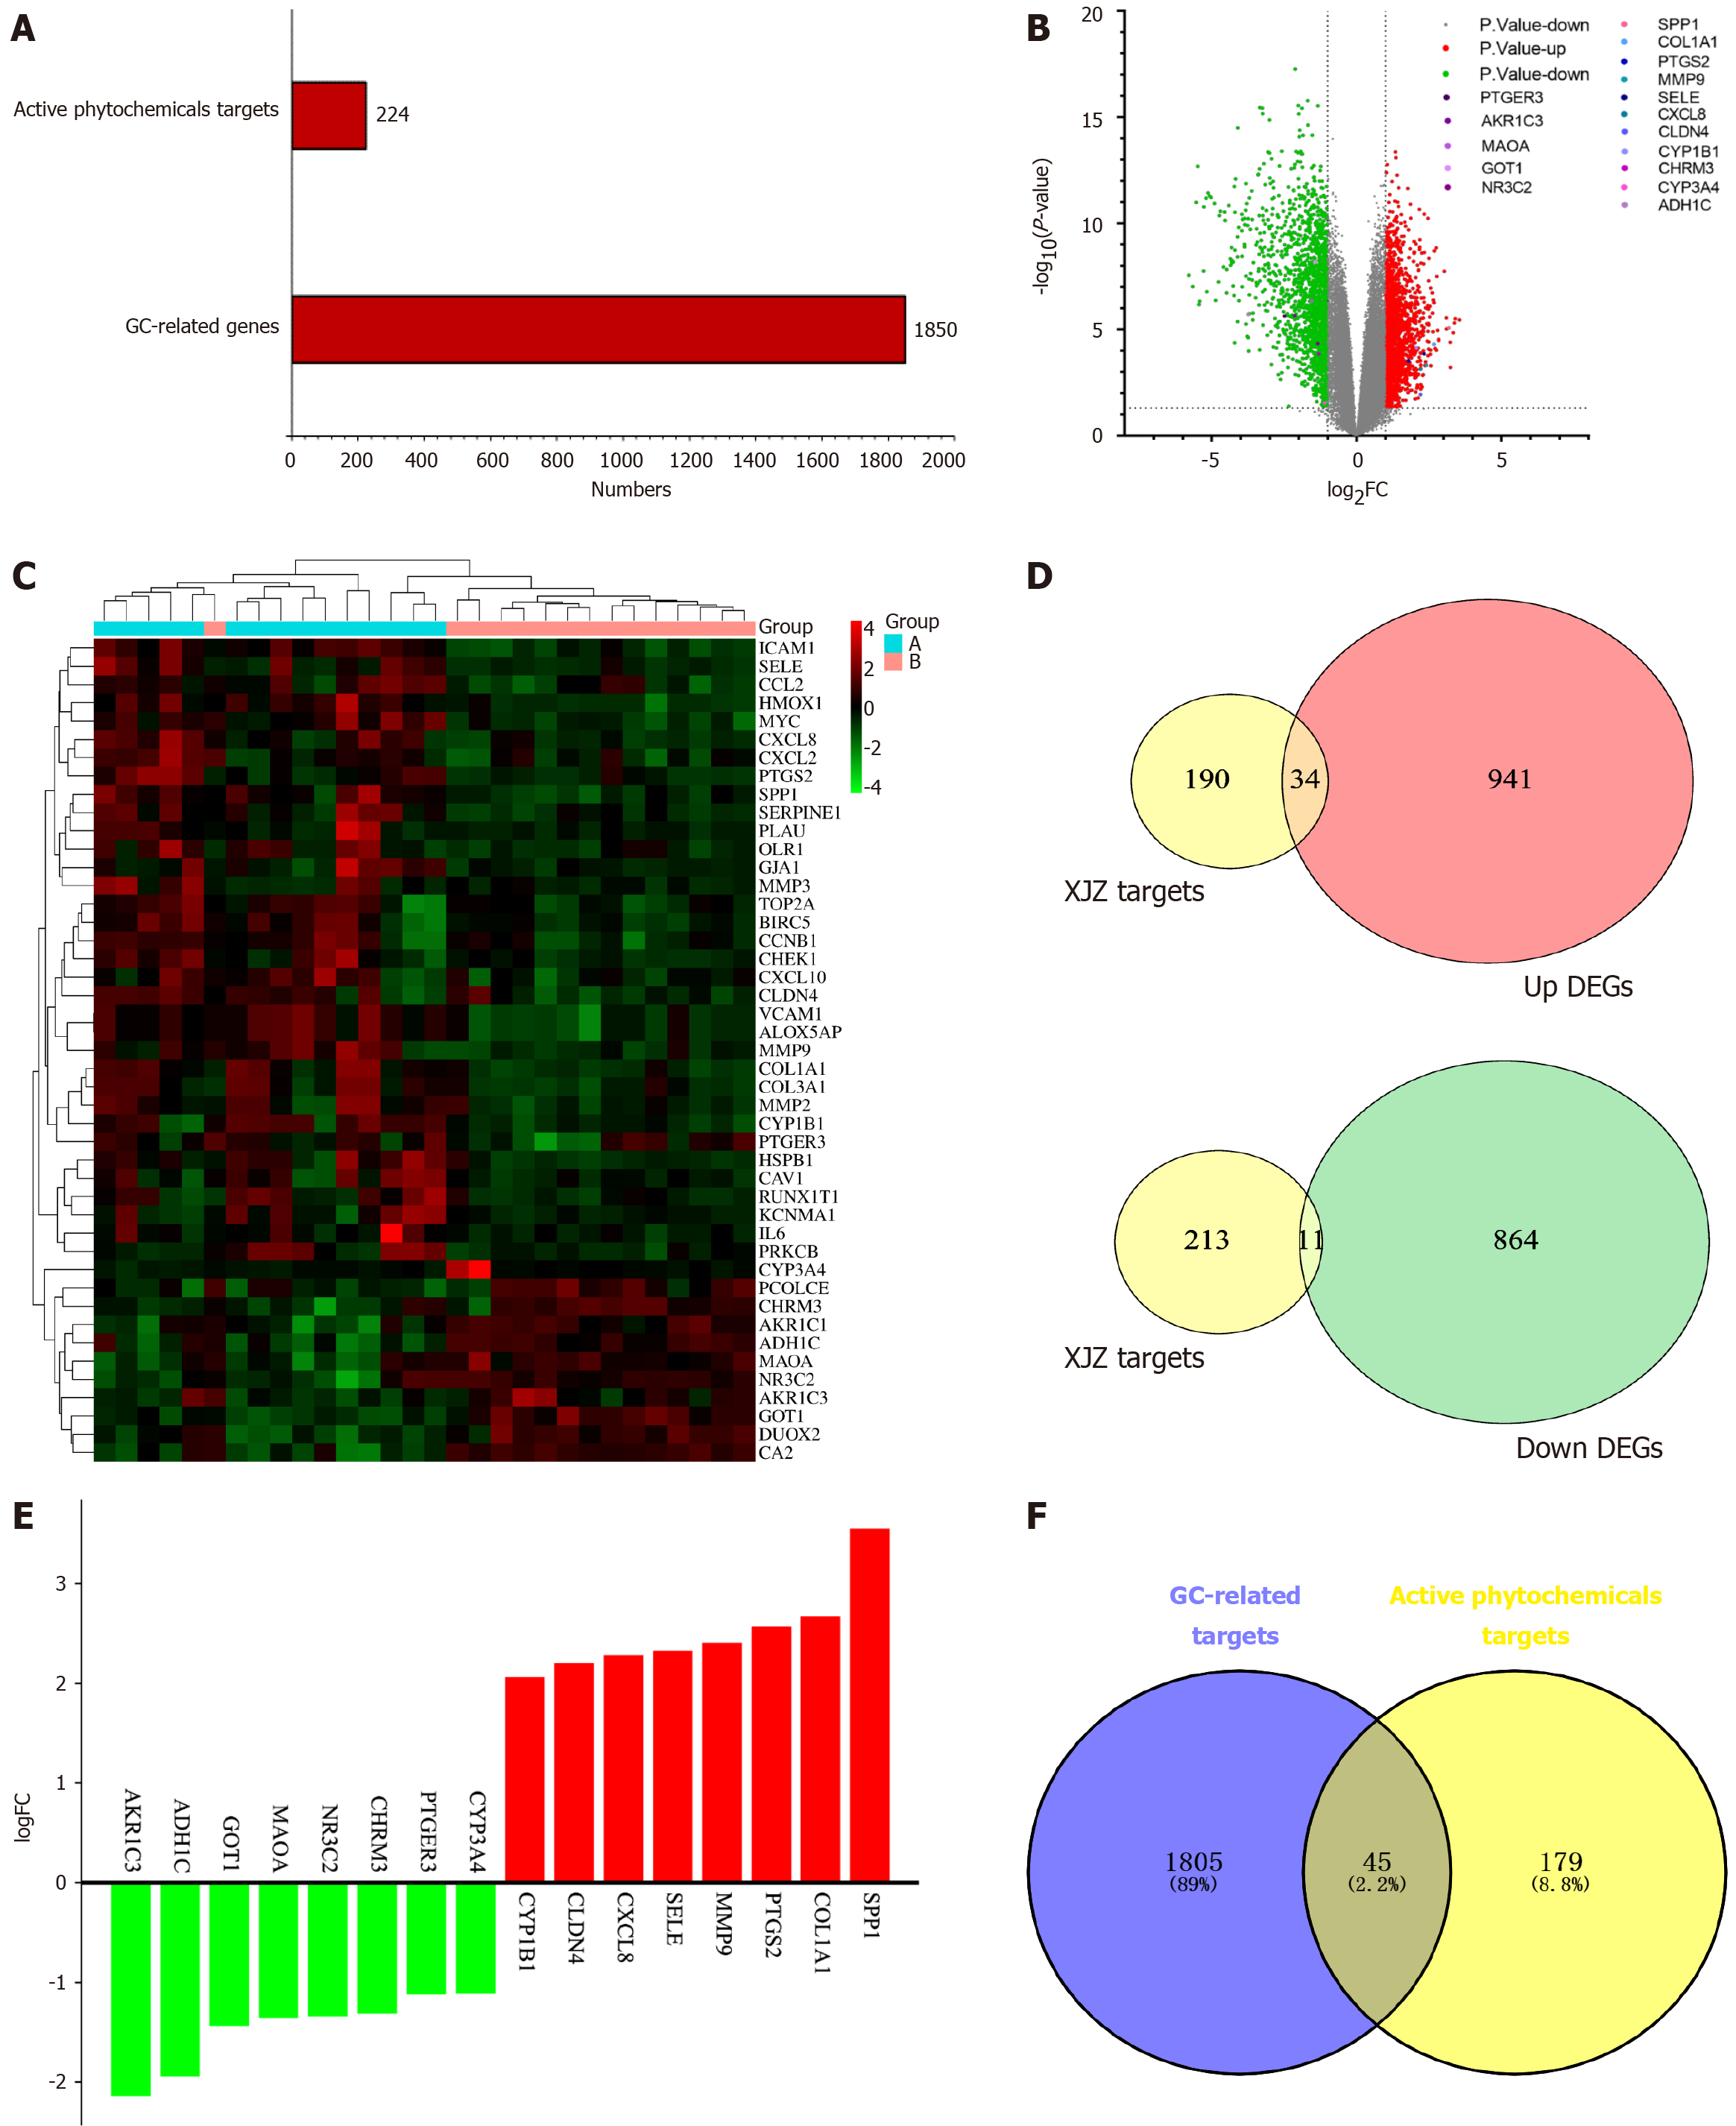
Figure 2 Targets of Xiaojianzhong decoction active ingredients and differentially expressed genes in gastric cancer.
A: All genes related to gastric cancer and the number of targets of Xiaojianzhong decoction (XJZ) active ingredients; B: Volcano plot of differentially expressed genes identified based on GSE118916. Green represents down-regulated genes, red represents up-regulated genes, and gray indicates non-differentially expressed genes; C: Heatmap of intersecting targets. Blue and pink represent the normal group and tumor group, respectively; D: Intersection of up- and down-regulated genes associated with GC and targets of XJZ. Yellow represents the targets of the compound, and red and green represent the up- and down-regulated genes, respectively; E: LogFC values of the top 8 up- and down-regulated genes in the intersection targets, where red and green represent up- and down-regulated genes, respectively; F: Intersection plot of XJZ and gastric cancer (GC) targets. Blue areas represent GC targets and yellow areas represent XJZ targets. XJZ: Xiaojianzhong decoction; GC: Gastric cancer.
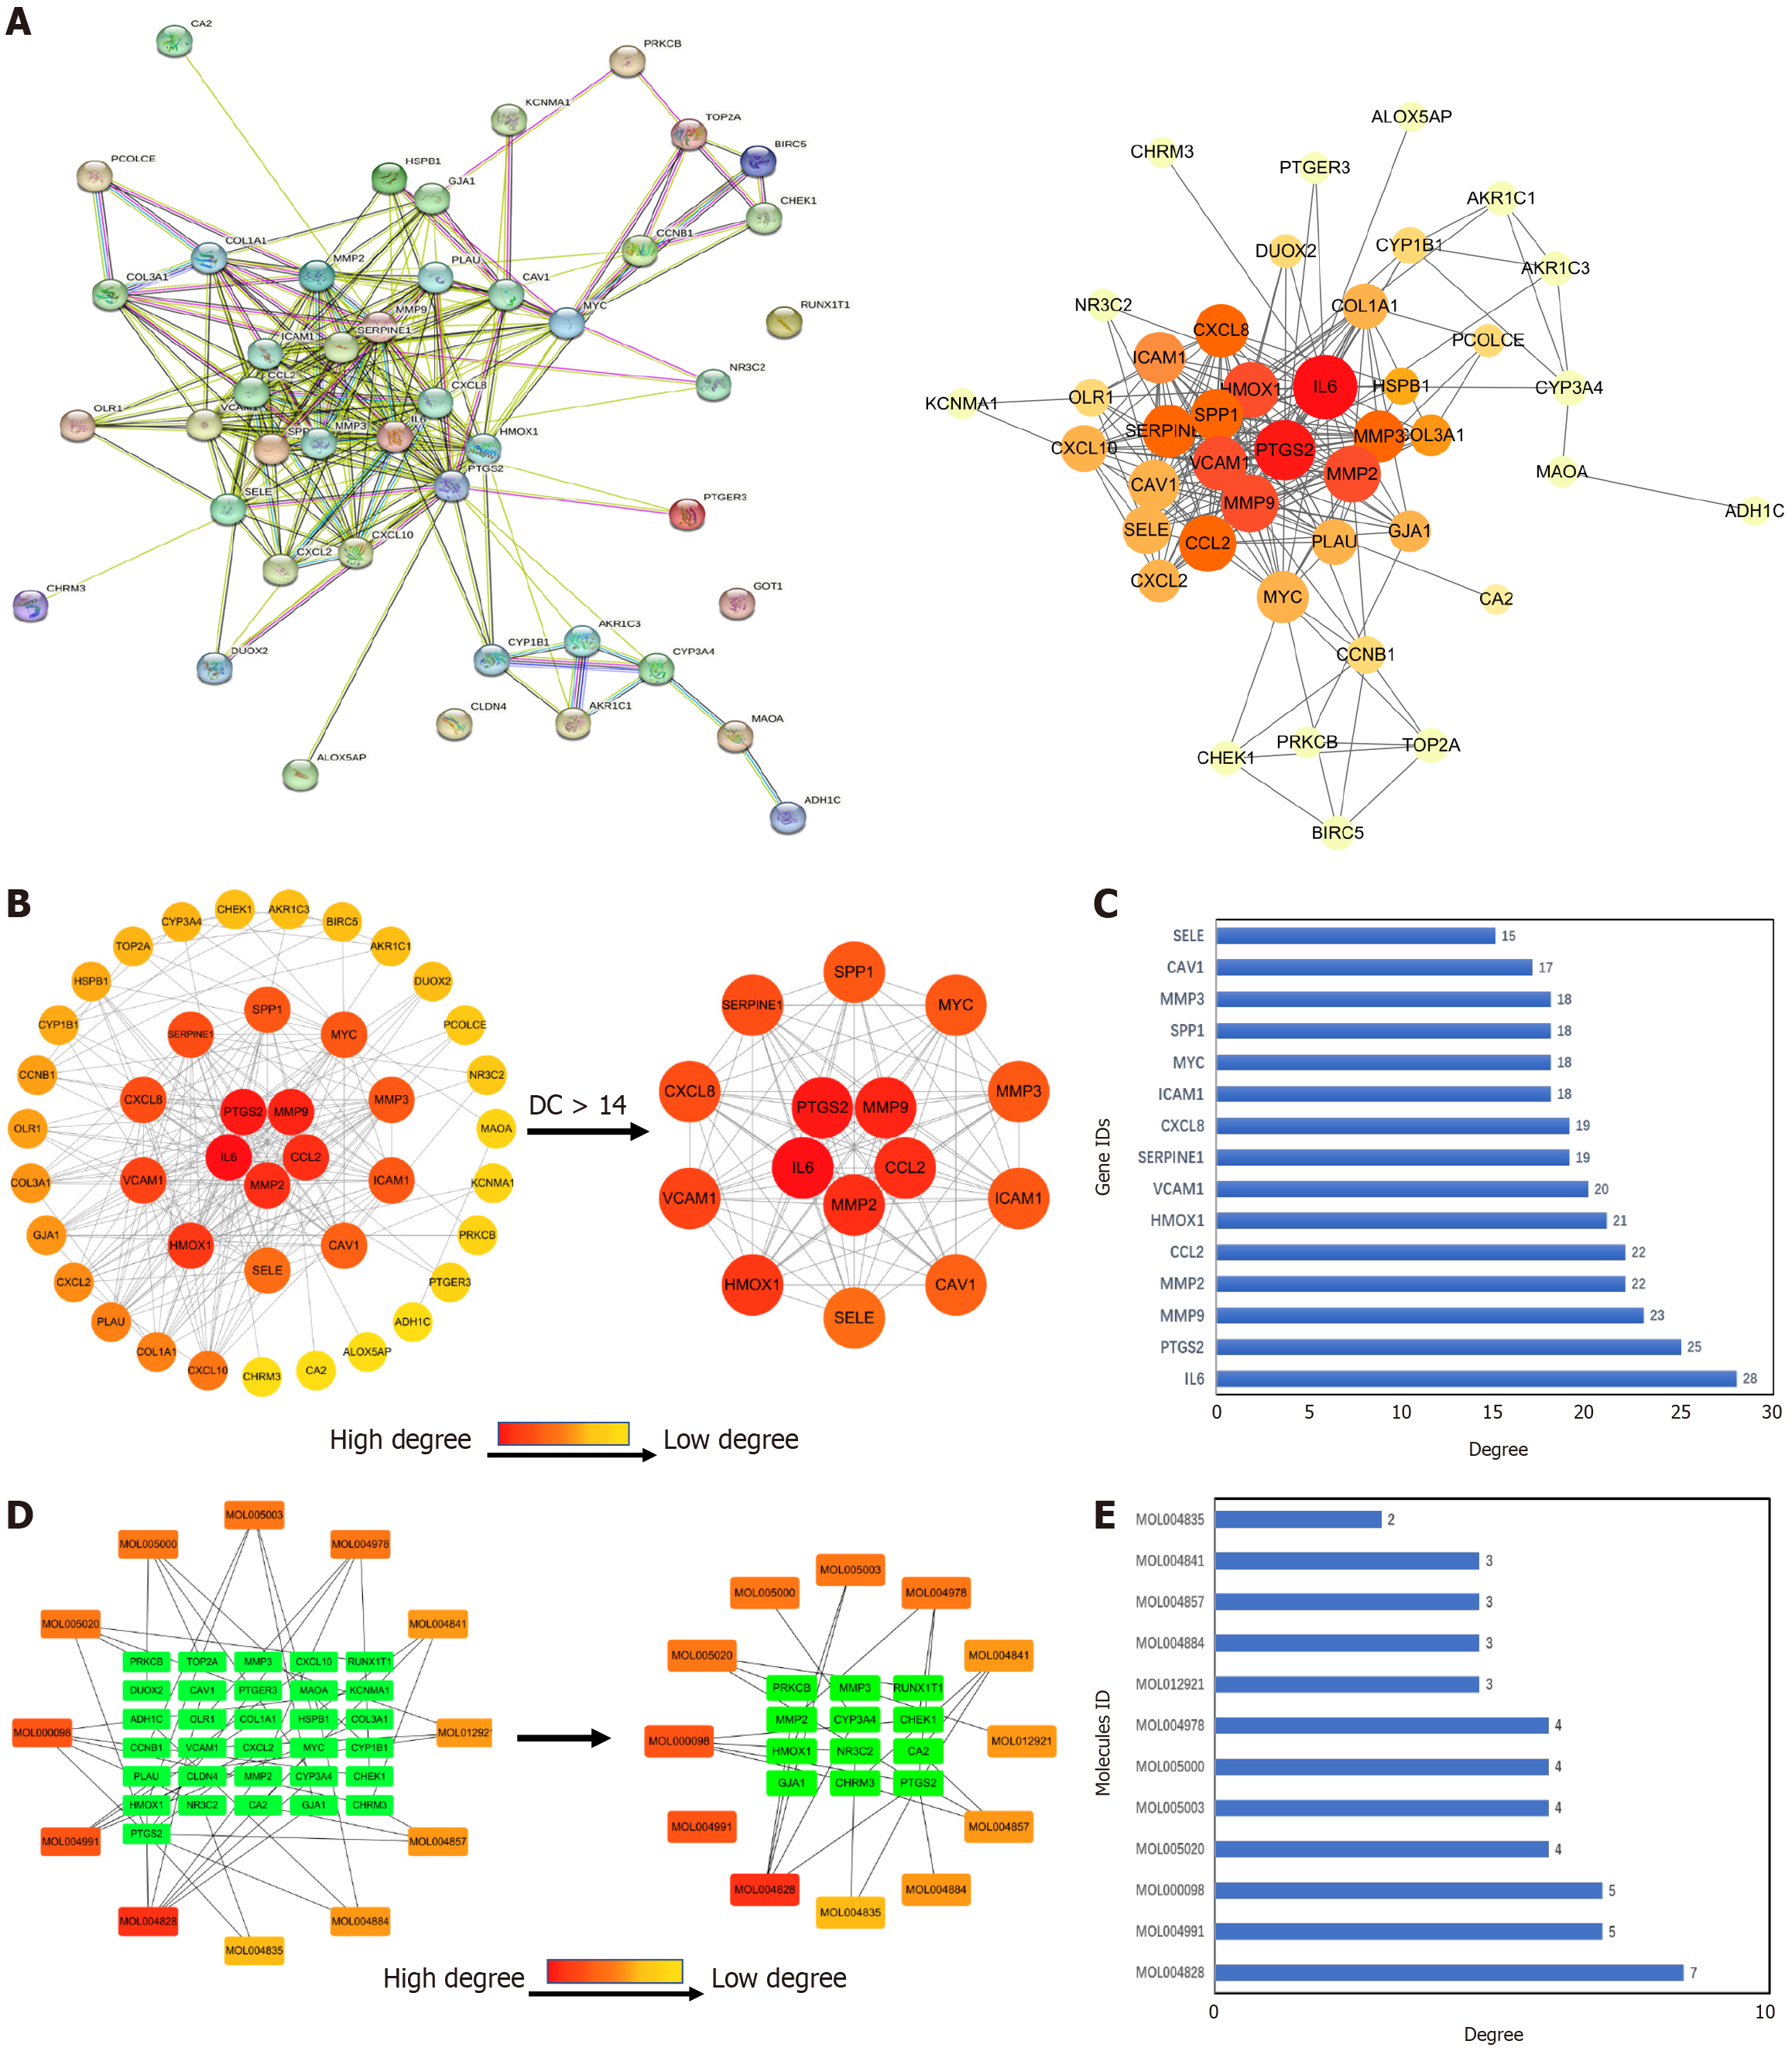
Figure 3 Screening of core components and targets.
A: Protein-protein interaction (PPI) network diagram obtained by entering intersecting targets into the string database; B: PPI network diagram sorted according to degree value. Core targets were filtered based on a degree value greater than 14. The darker the red color, the larger the value of degree; C: Degree values of core targets; D: Network diagram of Xiaojianzhong decoction (XJZ) core ingredients with their corresponding core targets. The inner green color indicates the core targets and the outer orange-red color indicates the core ingredients. The darker the red color, the larger degree the value; E: Degree values of XJZ core ingredients.
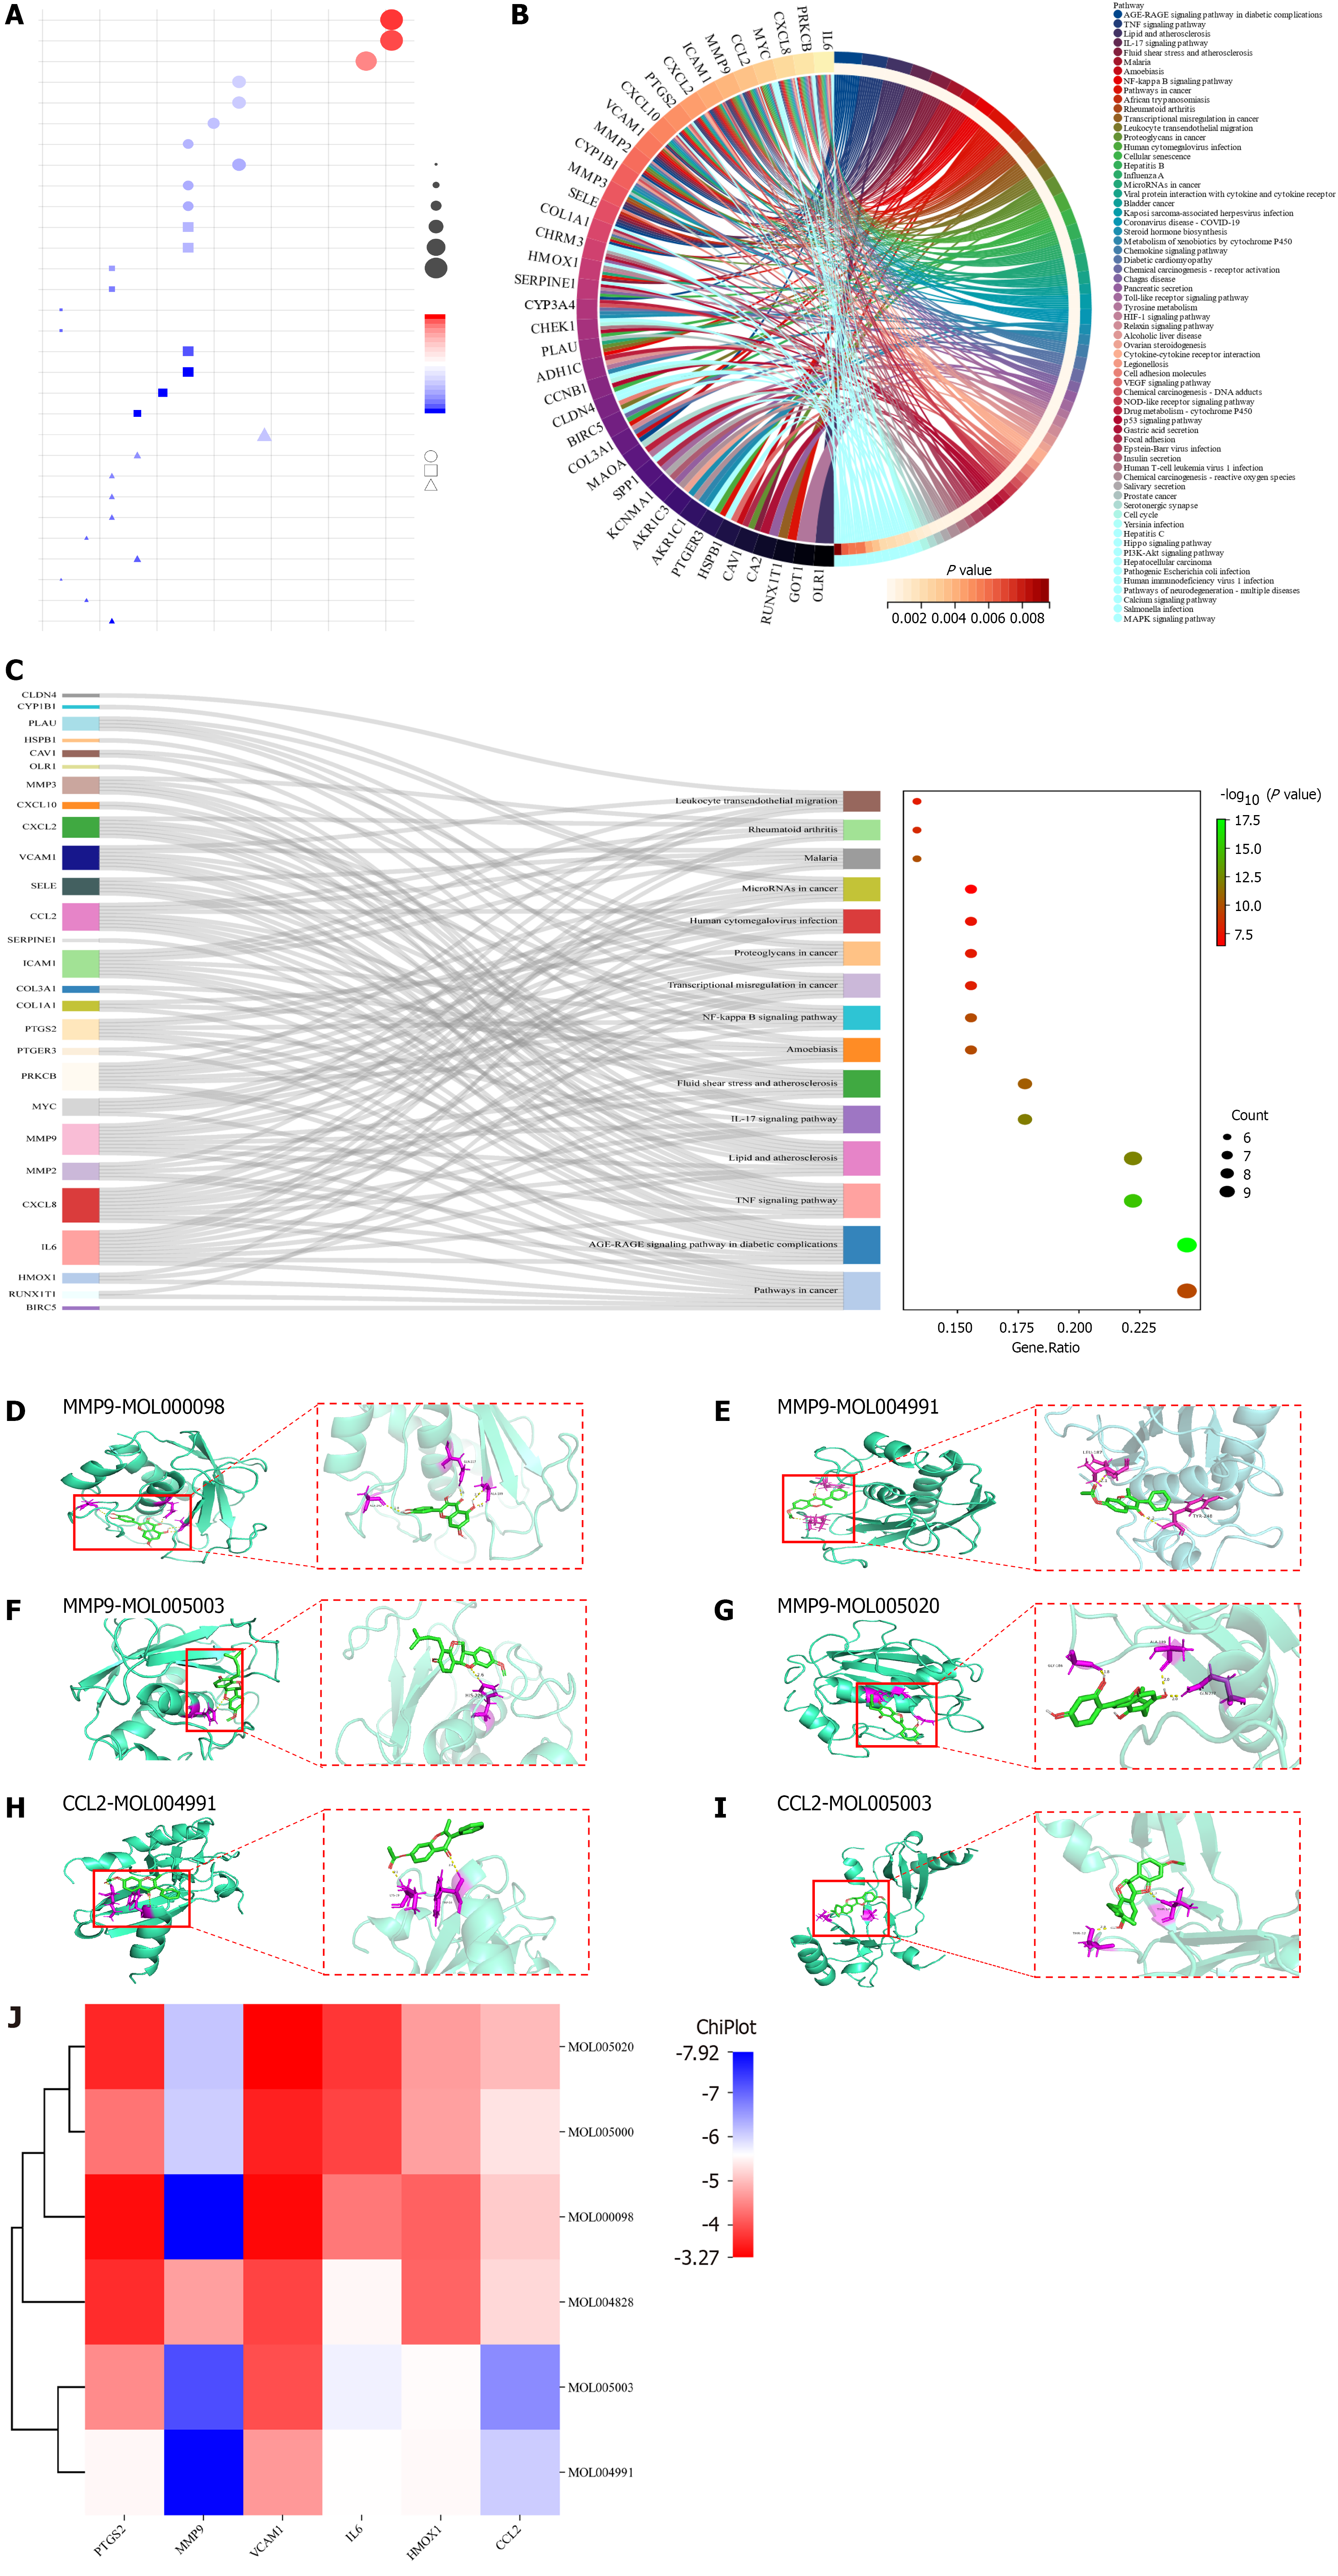
Figure 4 Enrichment analysis of core targets and molecular docking.
A: Gene ontology analysis of intersecting genes. Circles, squares, and triangles denote biological processes, cellular compositions, and molecular functions, respectively. The size of the shape indicates the number of targets enriched; the larger the shape, the more the enriched targets. The redder the color, the more significant the enriched pathway; B: Kyoto encyclopedia of genes and genomes (KEGG) circle diagram of intersecting targets. The outermost left side of the circle represents the intersection target, the outermost right side color represents the pathway, and the color of the innermost right side of the circle represents the P value of the enriched pathway; the lighter the color, the more significant the enriched pathway; C: Ranking of the front KEGG Sankey diagram. The left side represents the intersection target, the middle side represents the pathway, the curve indicates the correlation between the two, and the rightmost bubble graph represents the result of KEGG enrichment; the larger the circle, the redder the color, the more significant the enriched pathway; D-I: Visual demonstration of partial molecular docking; D-G: Molecular docking of MMP9 with quercetin, 7-acetoxy-2-methylisoflavone, licoagrocarpin, and dehydroglyasperins C; H and I: Molecular docking of CCL2 with 7-acetoxy-2-methylisoflavone and licoagrocarpin; J: Heat map of molecular docking binding energy of core genes and core active ingredients.
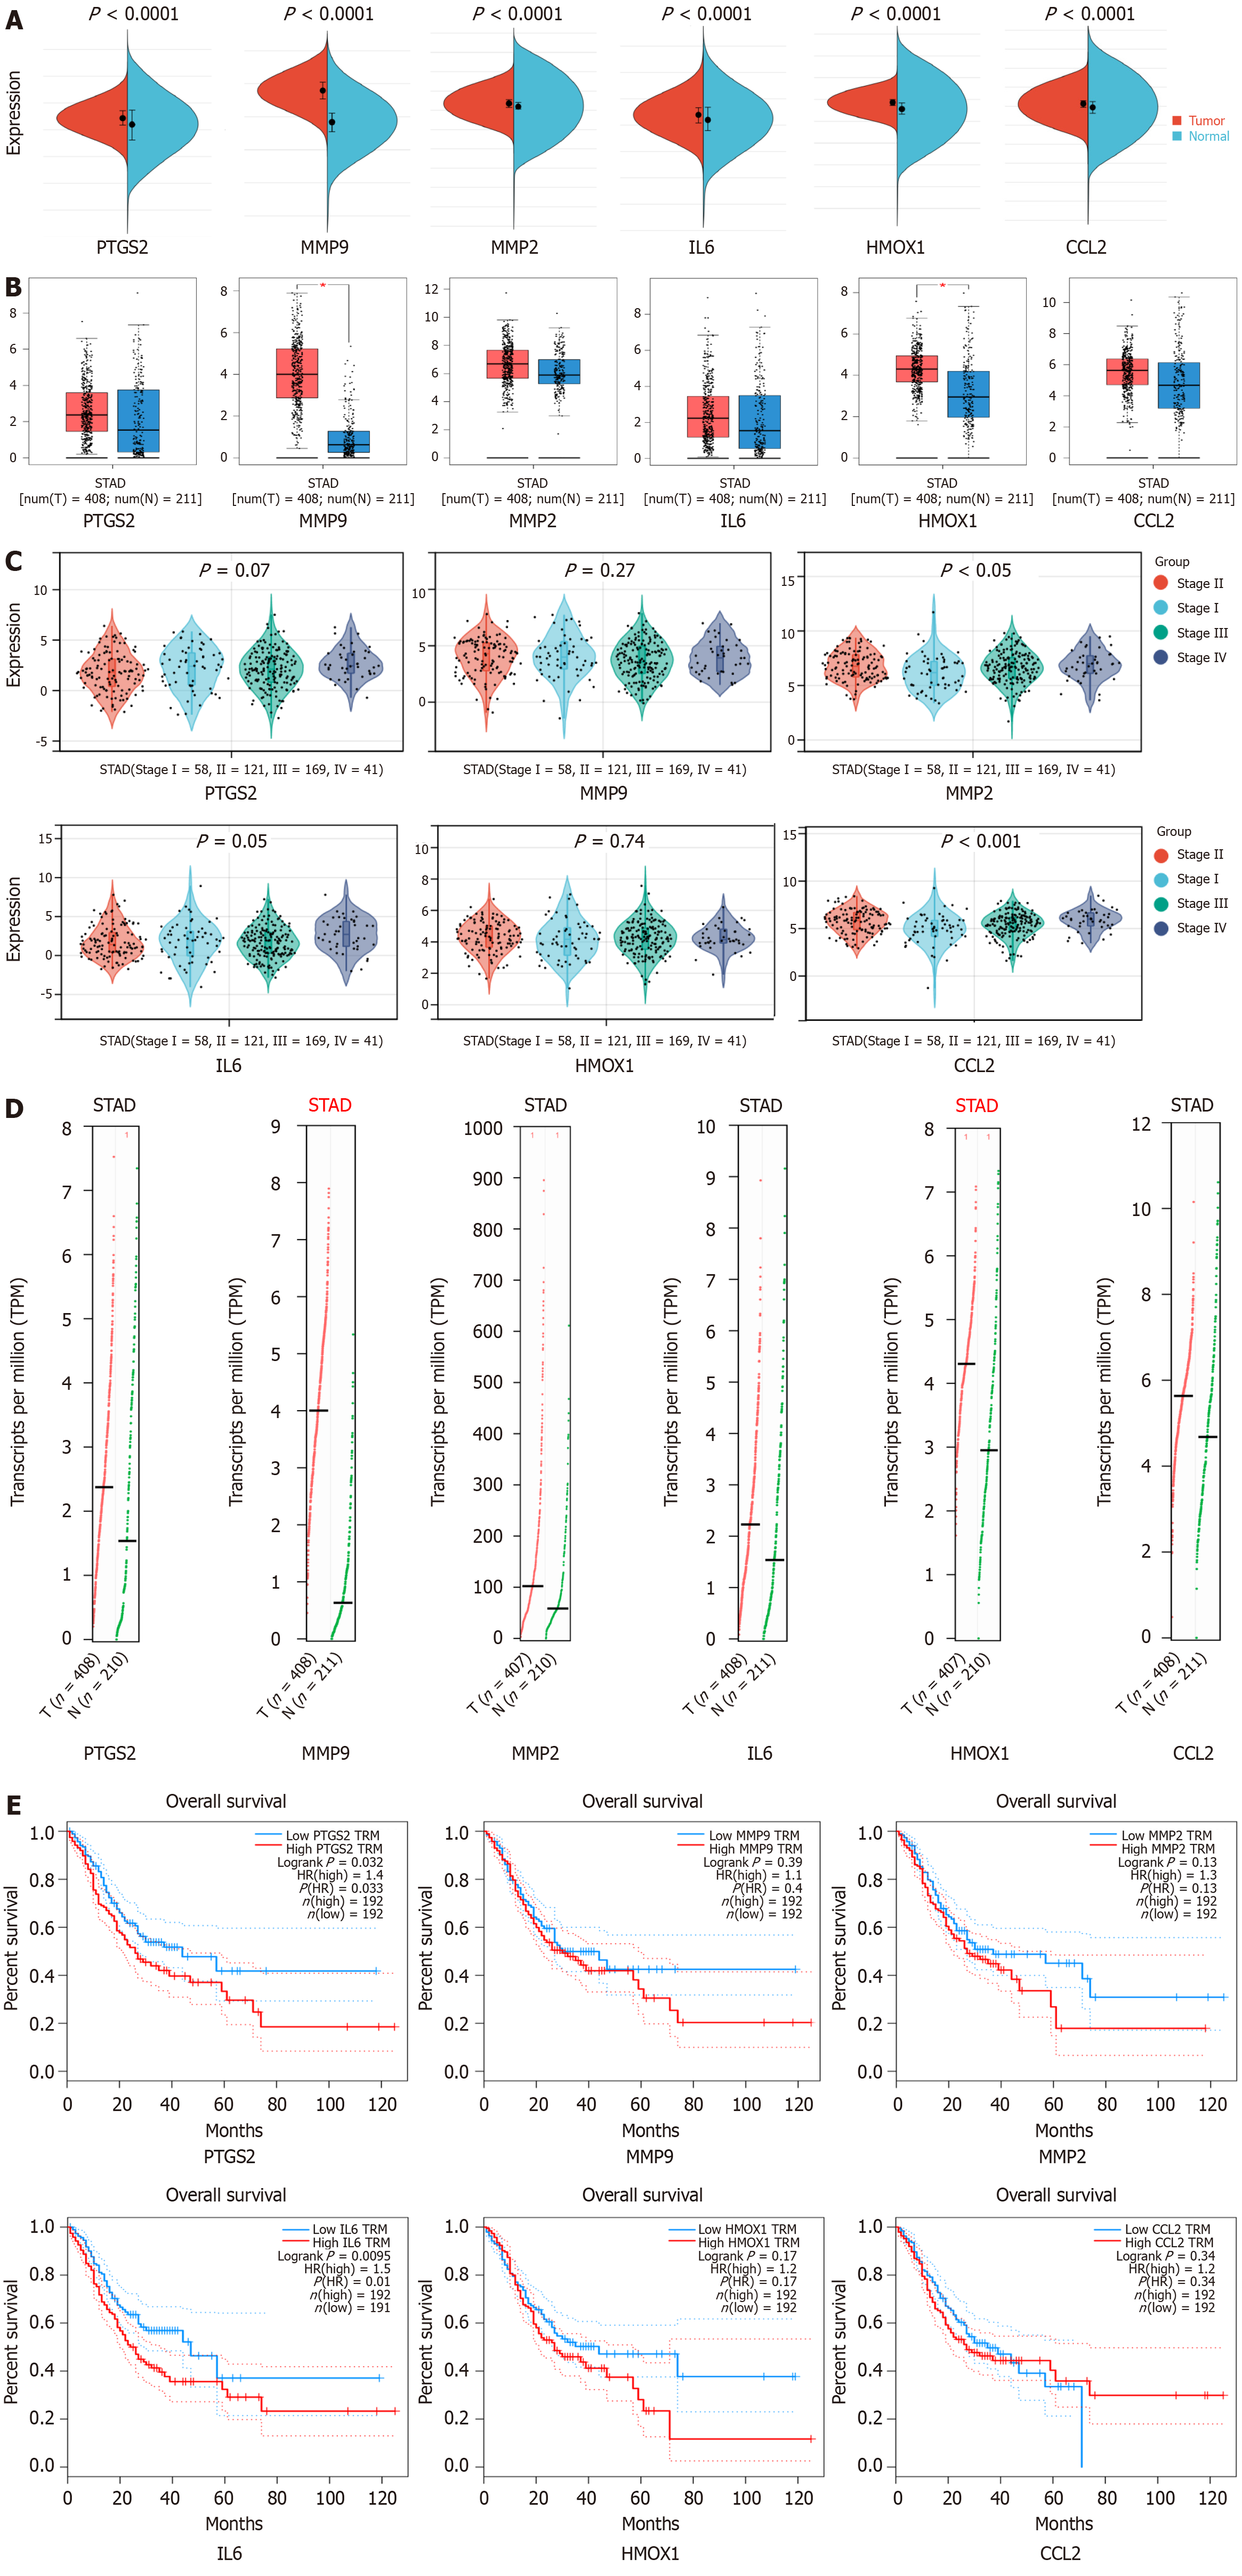
Figure 5 Clinical correlation analysis of hub genes in gastric cancer.
A: Expression levels of hub gene mRNA: Red represents the tumor group and blue represents the normal group; B: Expression levels of hub genes in tumor and normal tissues. Red represents the tumor group and blue represents the normal group; C: Correlation between hub genes and clinical stage of gastric cancer; D: Hub gene copy number. Red represents the tumor group and green represents the normal group; E: Survival analysis of the hub genes in gastric cancer patients.
Figure 6 Immunoanalysis of hub genes in gastric cancer.
A: Immune cell infiltration in gastric cancer was calculated using CIBERSORT. aP < 0.05, bP < 0.01; B: Distribution of hub gene expression in immune subtypes of gastric cancer; C: Scatter plot of stromal, immune, and ESTIMATE scores; D: Heatmap of correlation between hub genes and immune checkpoints. Blue color represents negative correlation and red color represents positive correlation. aP < 0.05, bP < 0.01; GC: Gastric cancer.
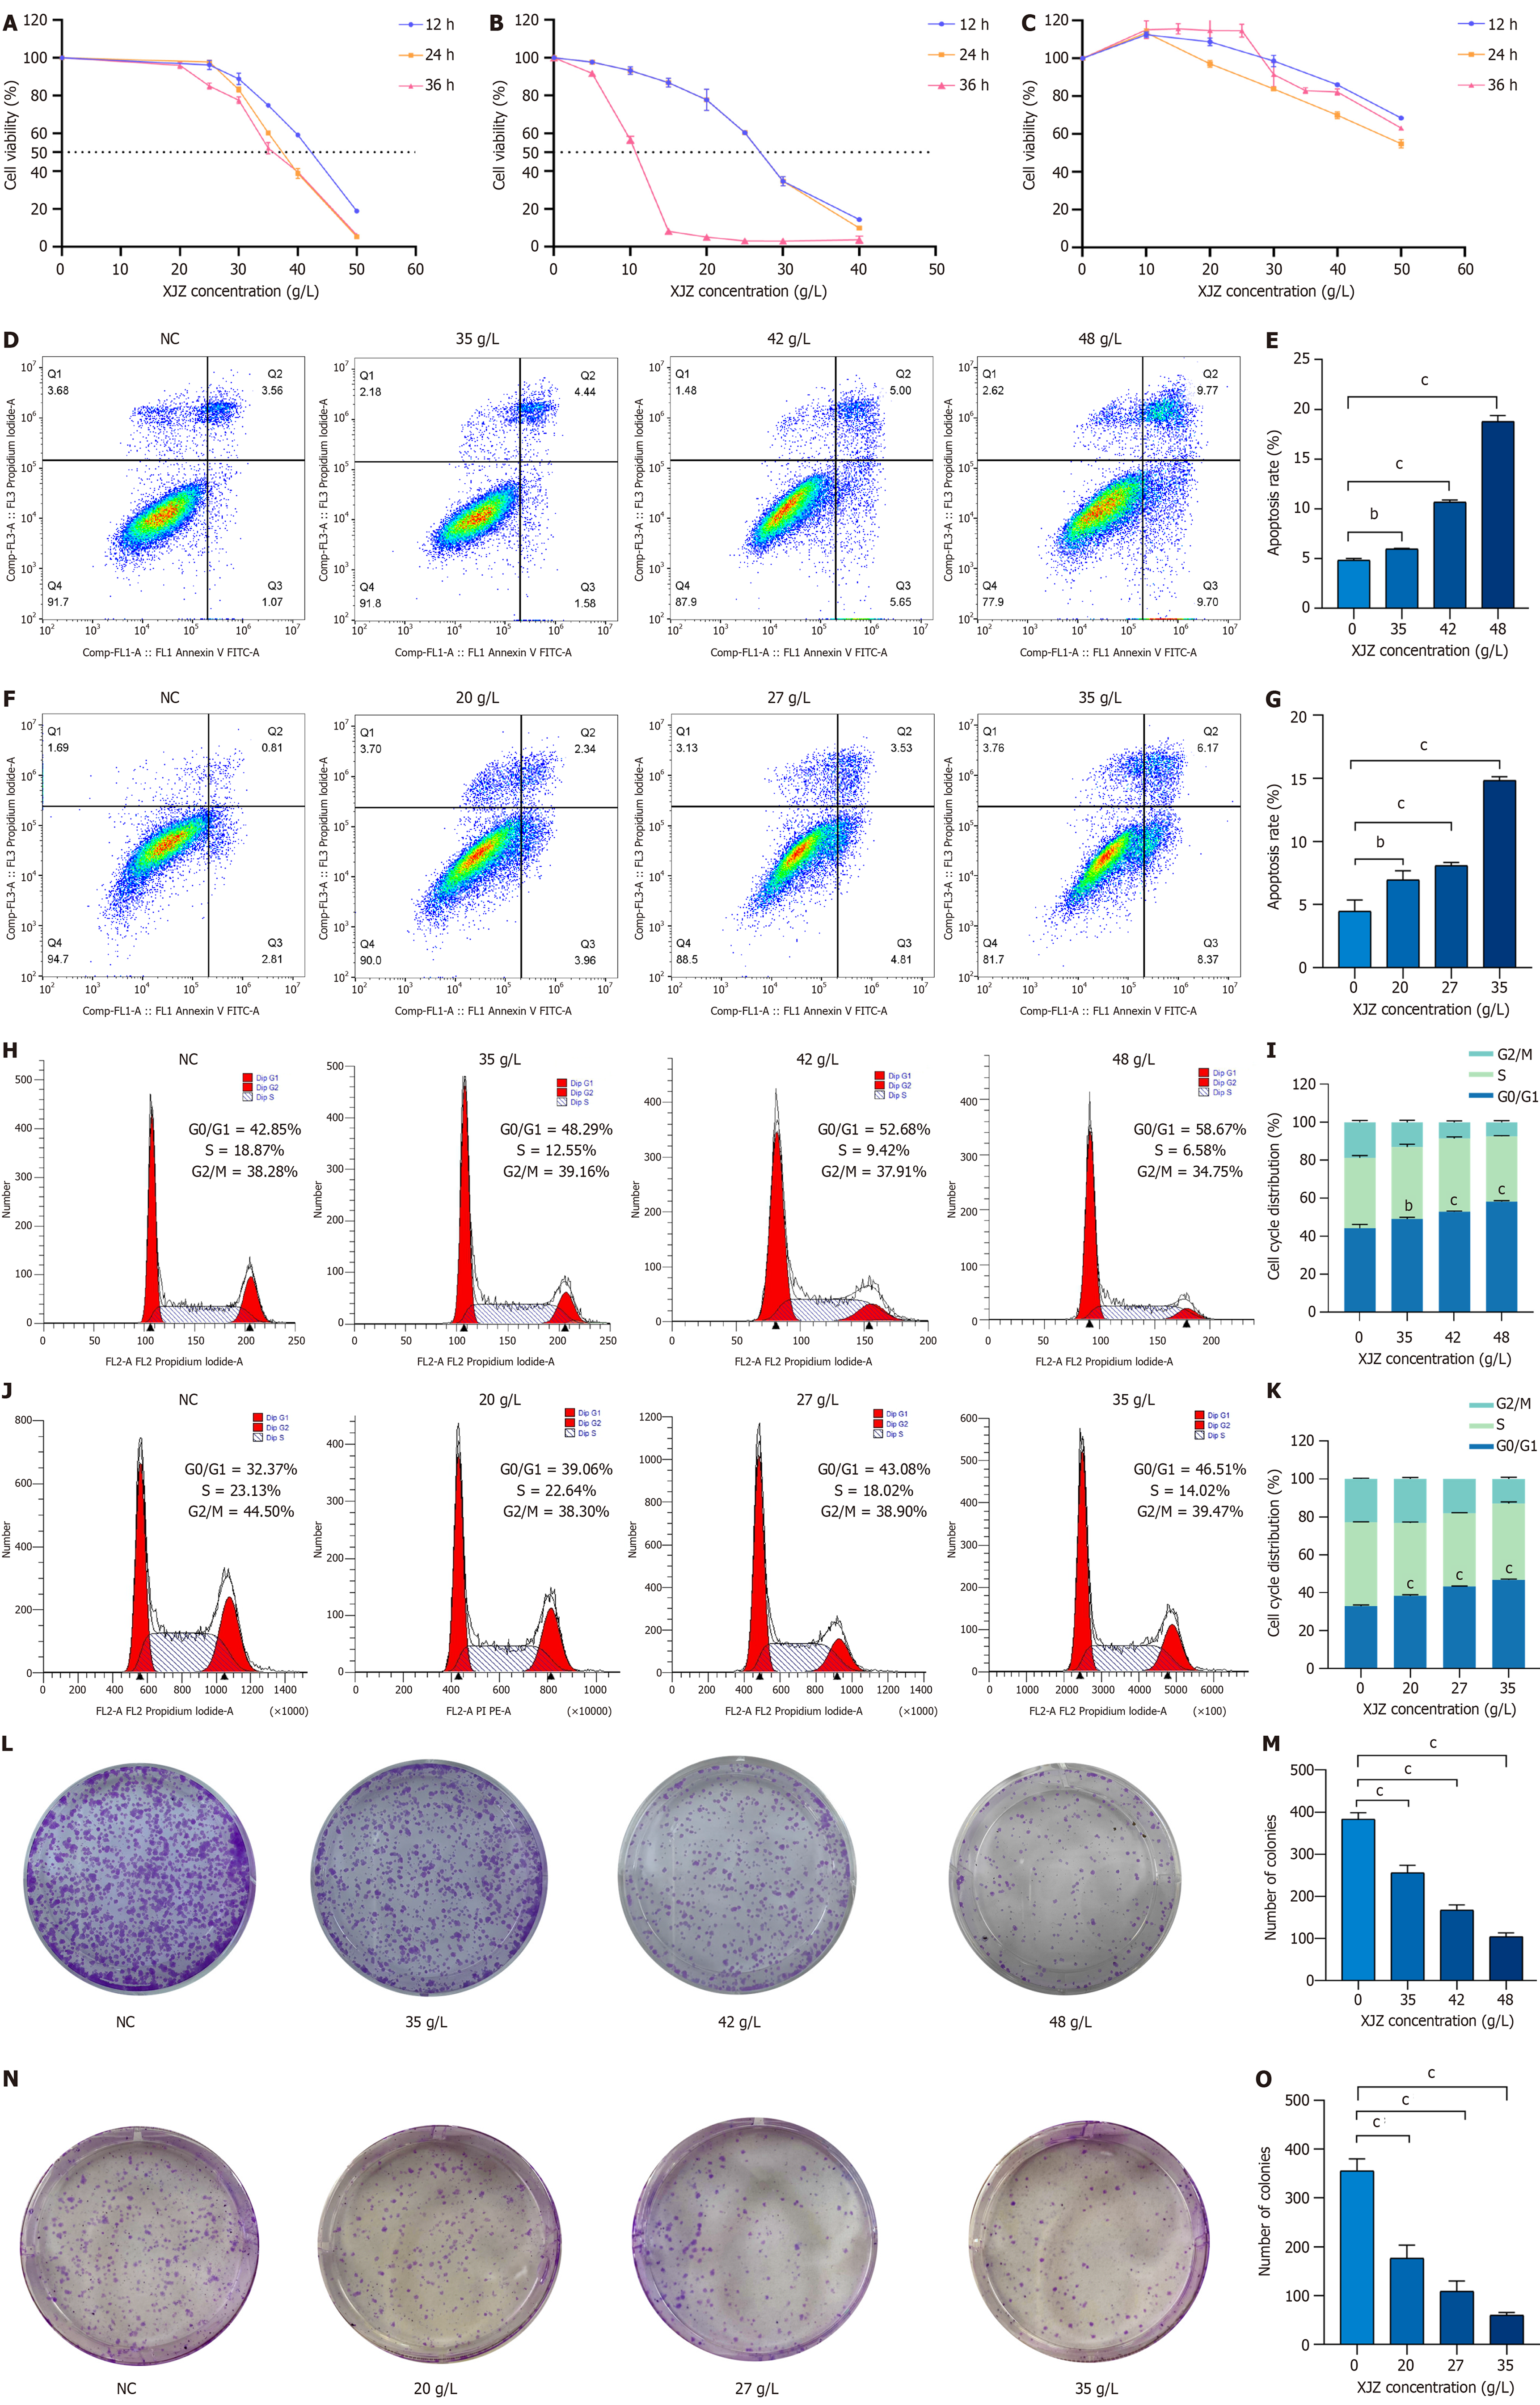
Figure 7 Effect of Xiaojianzhong decoction on phenotype of gastric cancer cells.
A-C: Viability of AGS, HGC-27, and GES-1 cells determined by CCK8 assay after Xiaojianzhong decoction (XJZ) treatment for 12, 24 and 36 h; D and E: Effect of XJZ on apoptosis of AGS cells detected by flow cytometry; F and G: Effect of XJZ on apoptosis of HGC-27 cells detected by flow cytometry; H and I: Effect of XJZ on cell cycle progression of AGS cells detected by flow cytometry; J and K: Effect of XJZ on cell cycle progression of HGC-27 GC detected by flow cytometry; L and M: Effects of XJZ on clone-forming ability of AGS cells; N and O: Effects of XJZ on clone-forming ability of HGC-27 cells. All experiments were repeated three times and the data are expressed as the mean ± SD, bP < 0.01, cP < 0.001; XJZ: Xiaojianzhong decoction; GC: Gastric cancer; NC: Negative control.
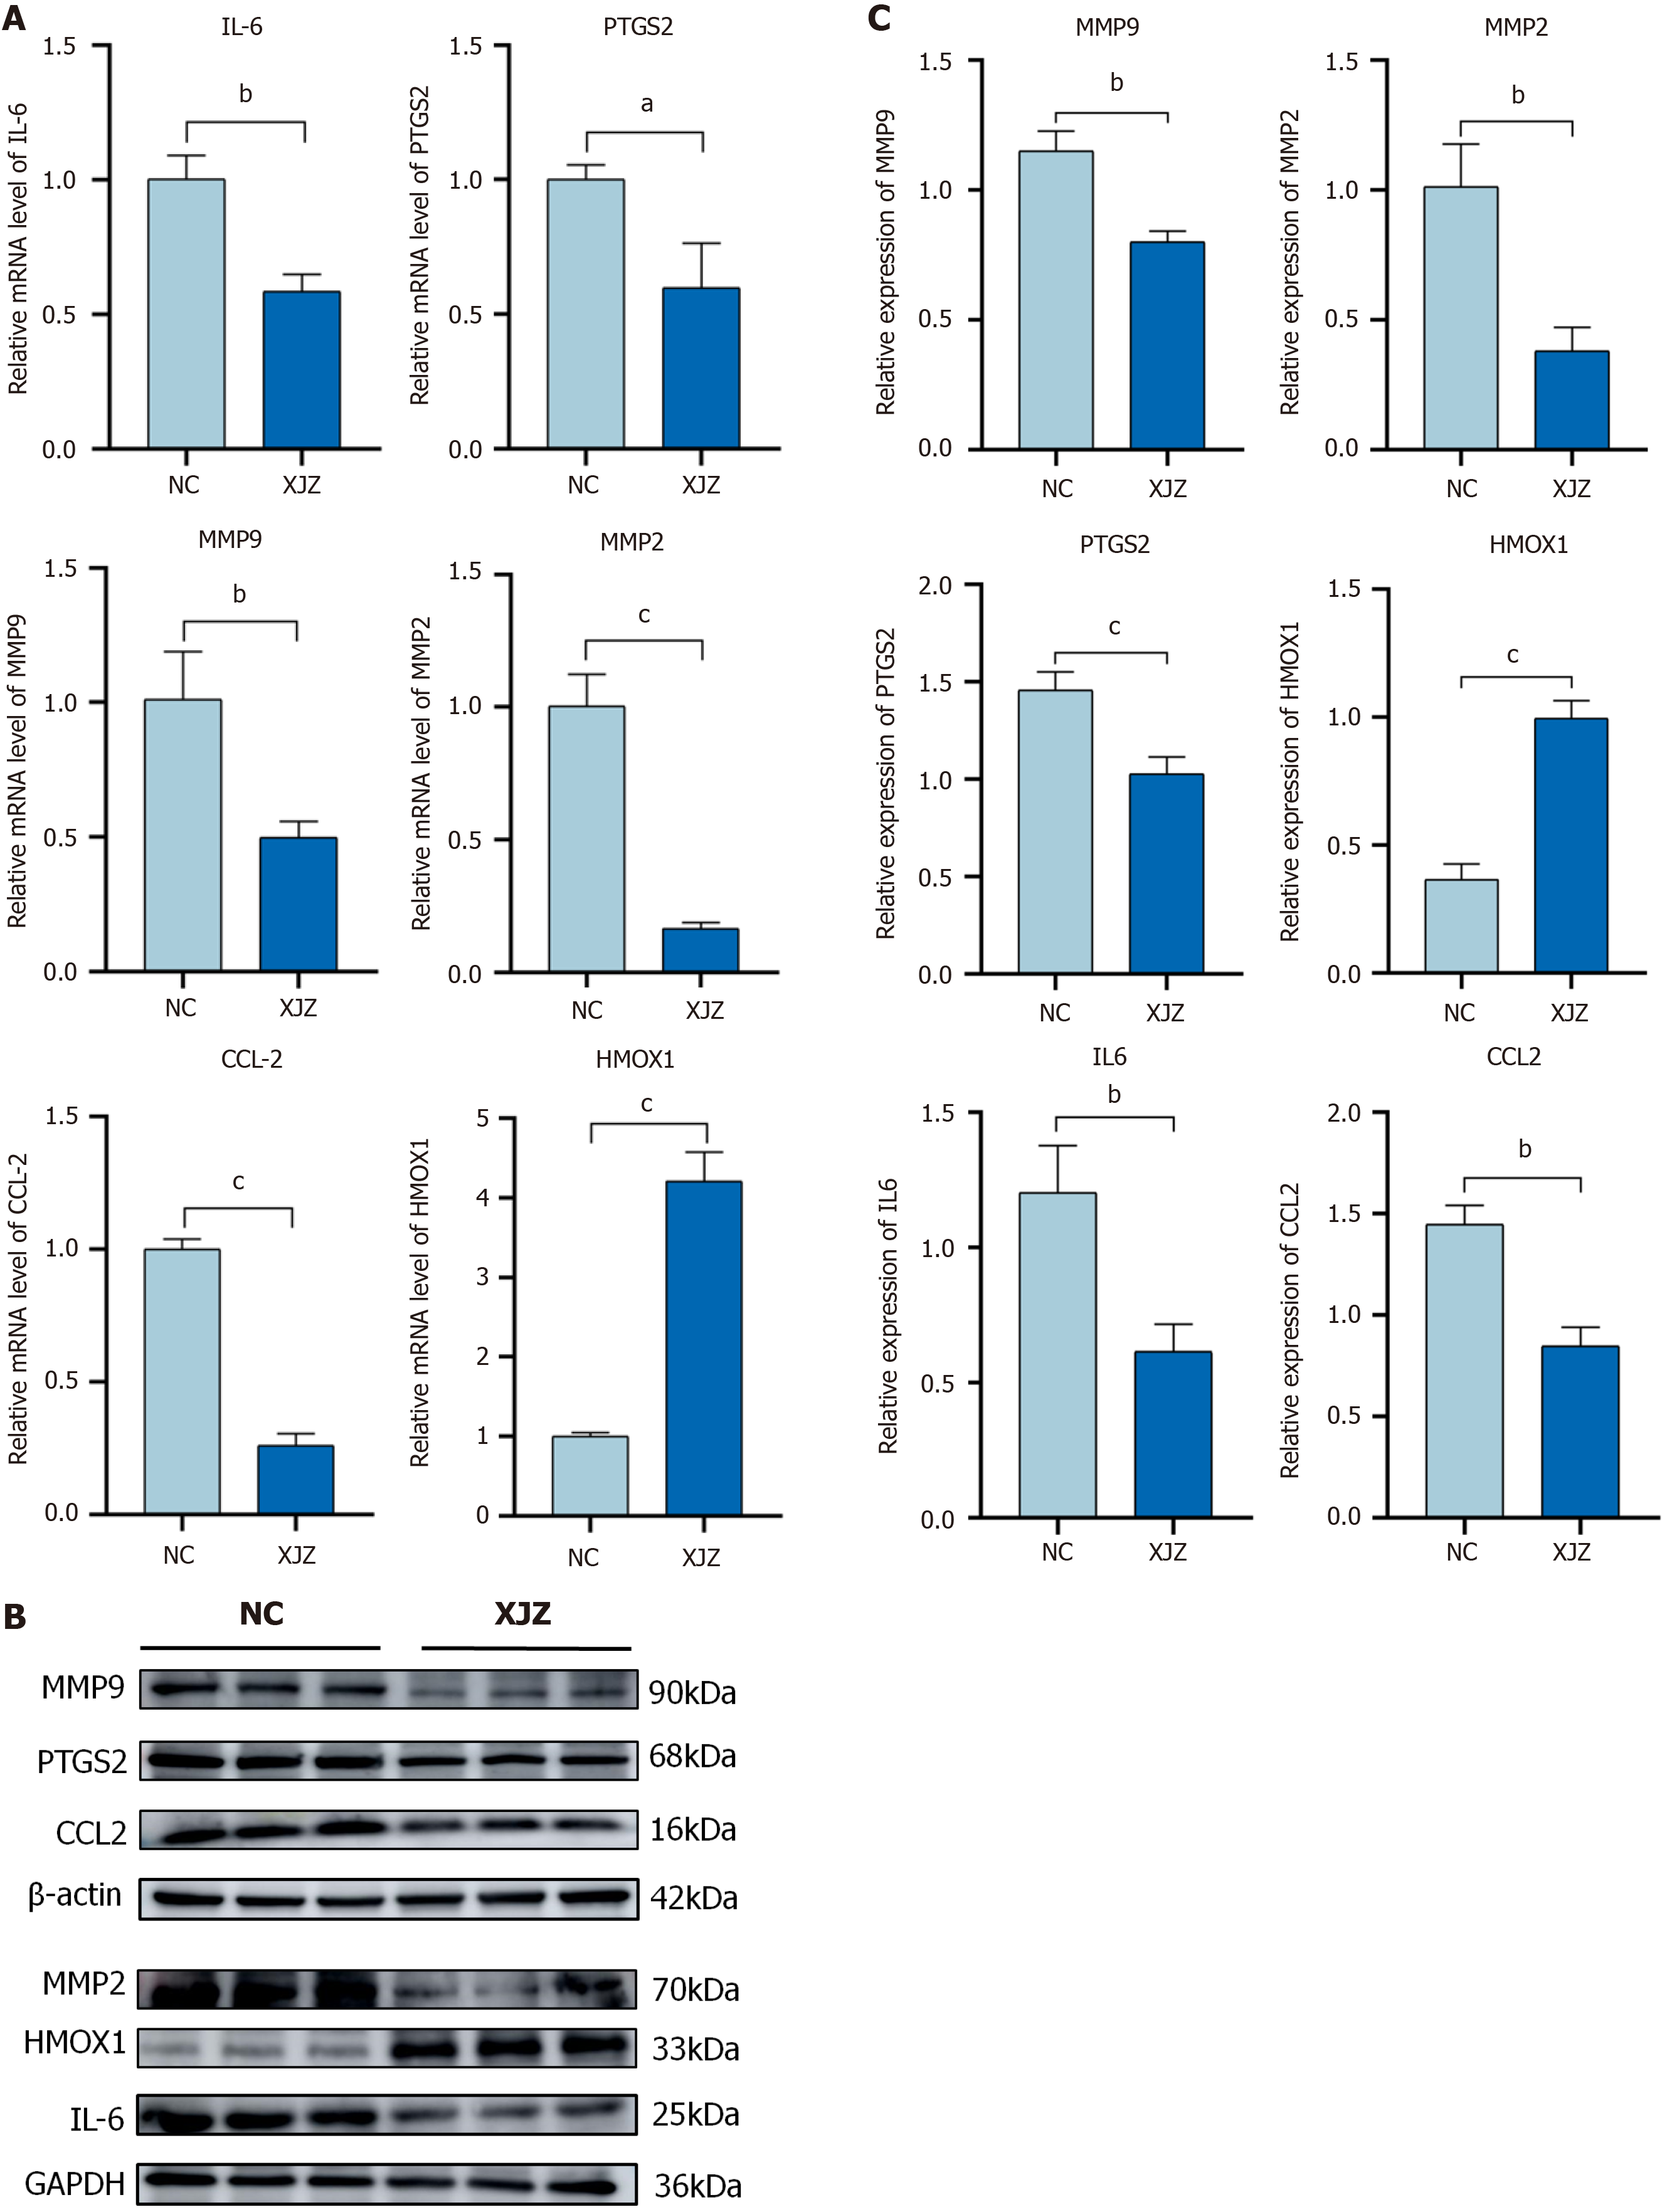
Figure 8 Effects of Xiaojianzhong decoction on mRNA and protein expression of core proteins in HGC-27 cells.
A: mRNA expression of core proteins in HGC-27 cells treated with Xiaojianzhong decoction (XJZ) detected by real-time quantitative-PCR; B and C: Western blot analysis of expression of core proteins in HGC-27 cells after XJZ intervention. All experiments were repeated three times and the data are expressed as the mean ± SD, aP < 0.05, bP < 0.01, cP < 0.001; XJZ: Xiaojianzhong decoction; GC: Gastric cancer; NC: Negative control.
- Citation: Chen GQ, Nan Y, Ning N, Huang SC, Bai YT, Zhou ZY, Qian G, Li WQ, Yuan L. Network pharmacology study and in vitro experimental validation of Xiaojianzhong decoction against gastric cancer. World J Gastrointest Oncol 2024; 16(9): 3932-3954
- URL: https://www.wjgnet.com/1948-5204/full/v16/i9/3932.htm
- DOI: https://dx.doi.org/10.4251/wjgo.v16.i9.3932


