Copyright
©The Author(s) 2024.
World J Gastrointest Oncol. Sep 15, 2024; 16(9): 3913-3931
Published online Sep 15, 2024. doi: 10.4251/wjgo.v16.i9.3913
Published online Sep 15, 2024. doi: 10.4251/wjgo.v16.i9.3913
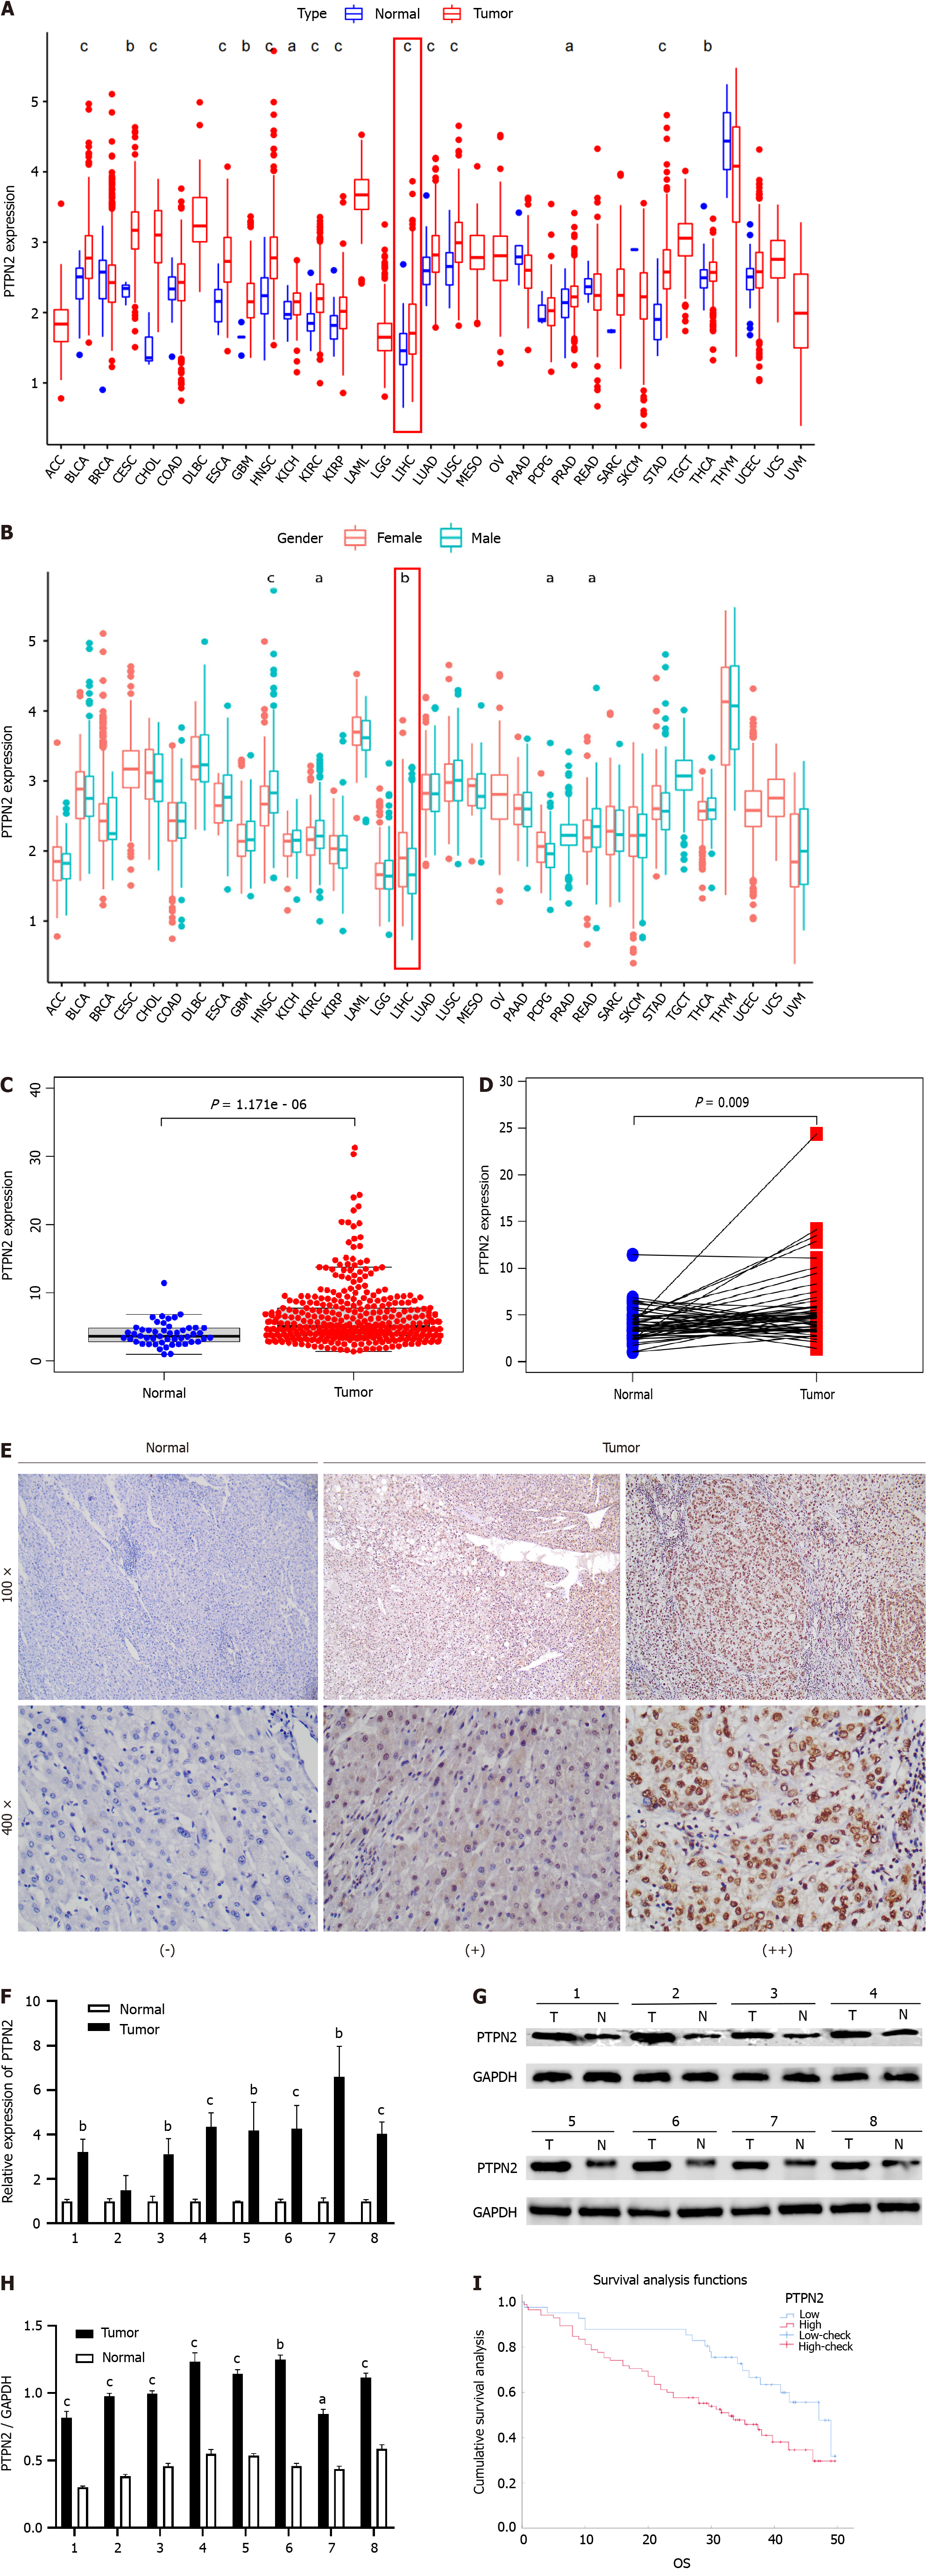
Figure 1 Expression levels of protein tyrosine phosphatase non-receptor 2 in tumors.
A: Differences in protein tyrosine phosphatase non-receptor 2 (PTPN2) expression in tumor and normal tissues in pan-tumor species in The Cancer Genome Atlas (TCGA) database; B: Correlation of PTPN2 expression with patient sex; C and D: Unpaired and paired significance analysis of PTPN2 expression in the TCGA database; E: Immunohistochemical analysis of 126 pairs of paraffin-embedded HCC tissues and adjacent normal tissues showing higher PTPN2 expression in the HCC tissues; F: Results of quantitative real-time polymerase chain reaction analysis of PTPN2 mRNA expression in eight pairs of HCC tissues and corresponding normal tissues; G: Western blot analysis comparing the protein expression of PTPN2 in eight pairs of HCC tissues and normal tissues and quantitative analysis of significance; H: Quantitative analysis of the results of Western blot to compare tumor tissues and normal tissues; I: Kaplan-Meier survival analysis based on PTPN2 expression in 126 hepatocellular carcinoma (HCC) patients. aP < 0.05; bP < 0.01; cP < 0.001. PTPN2: Protein tyrosine phosphatase non-receptor 2; OS: Overall survival.
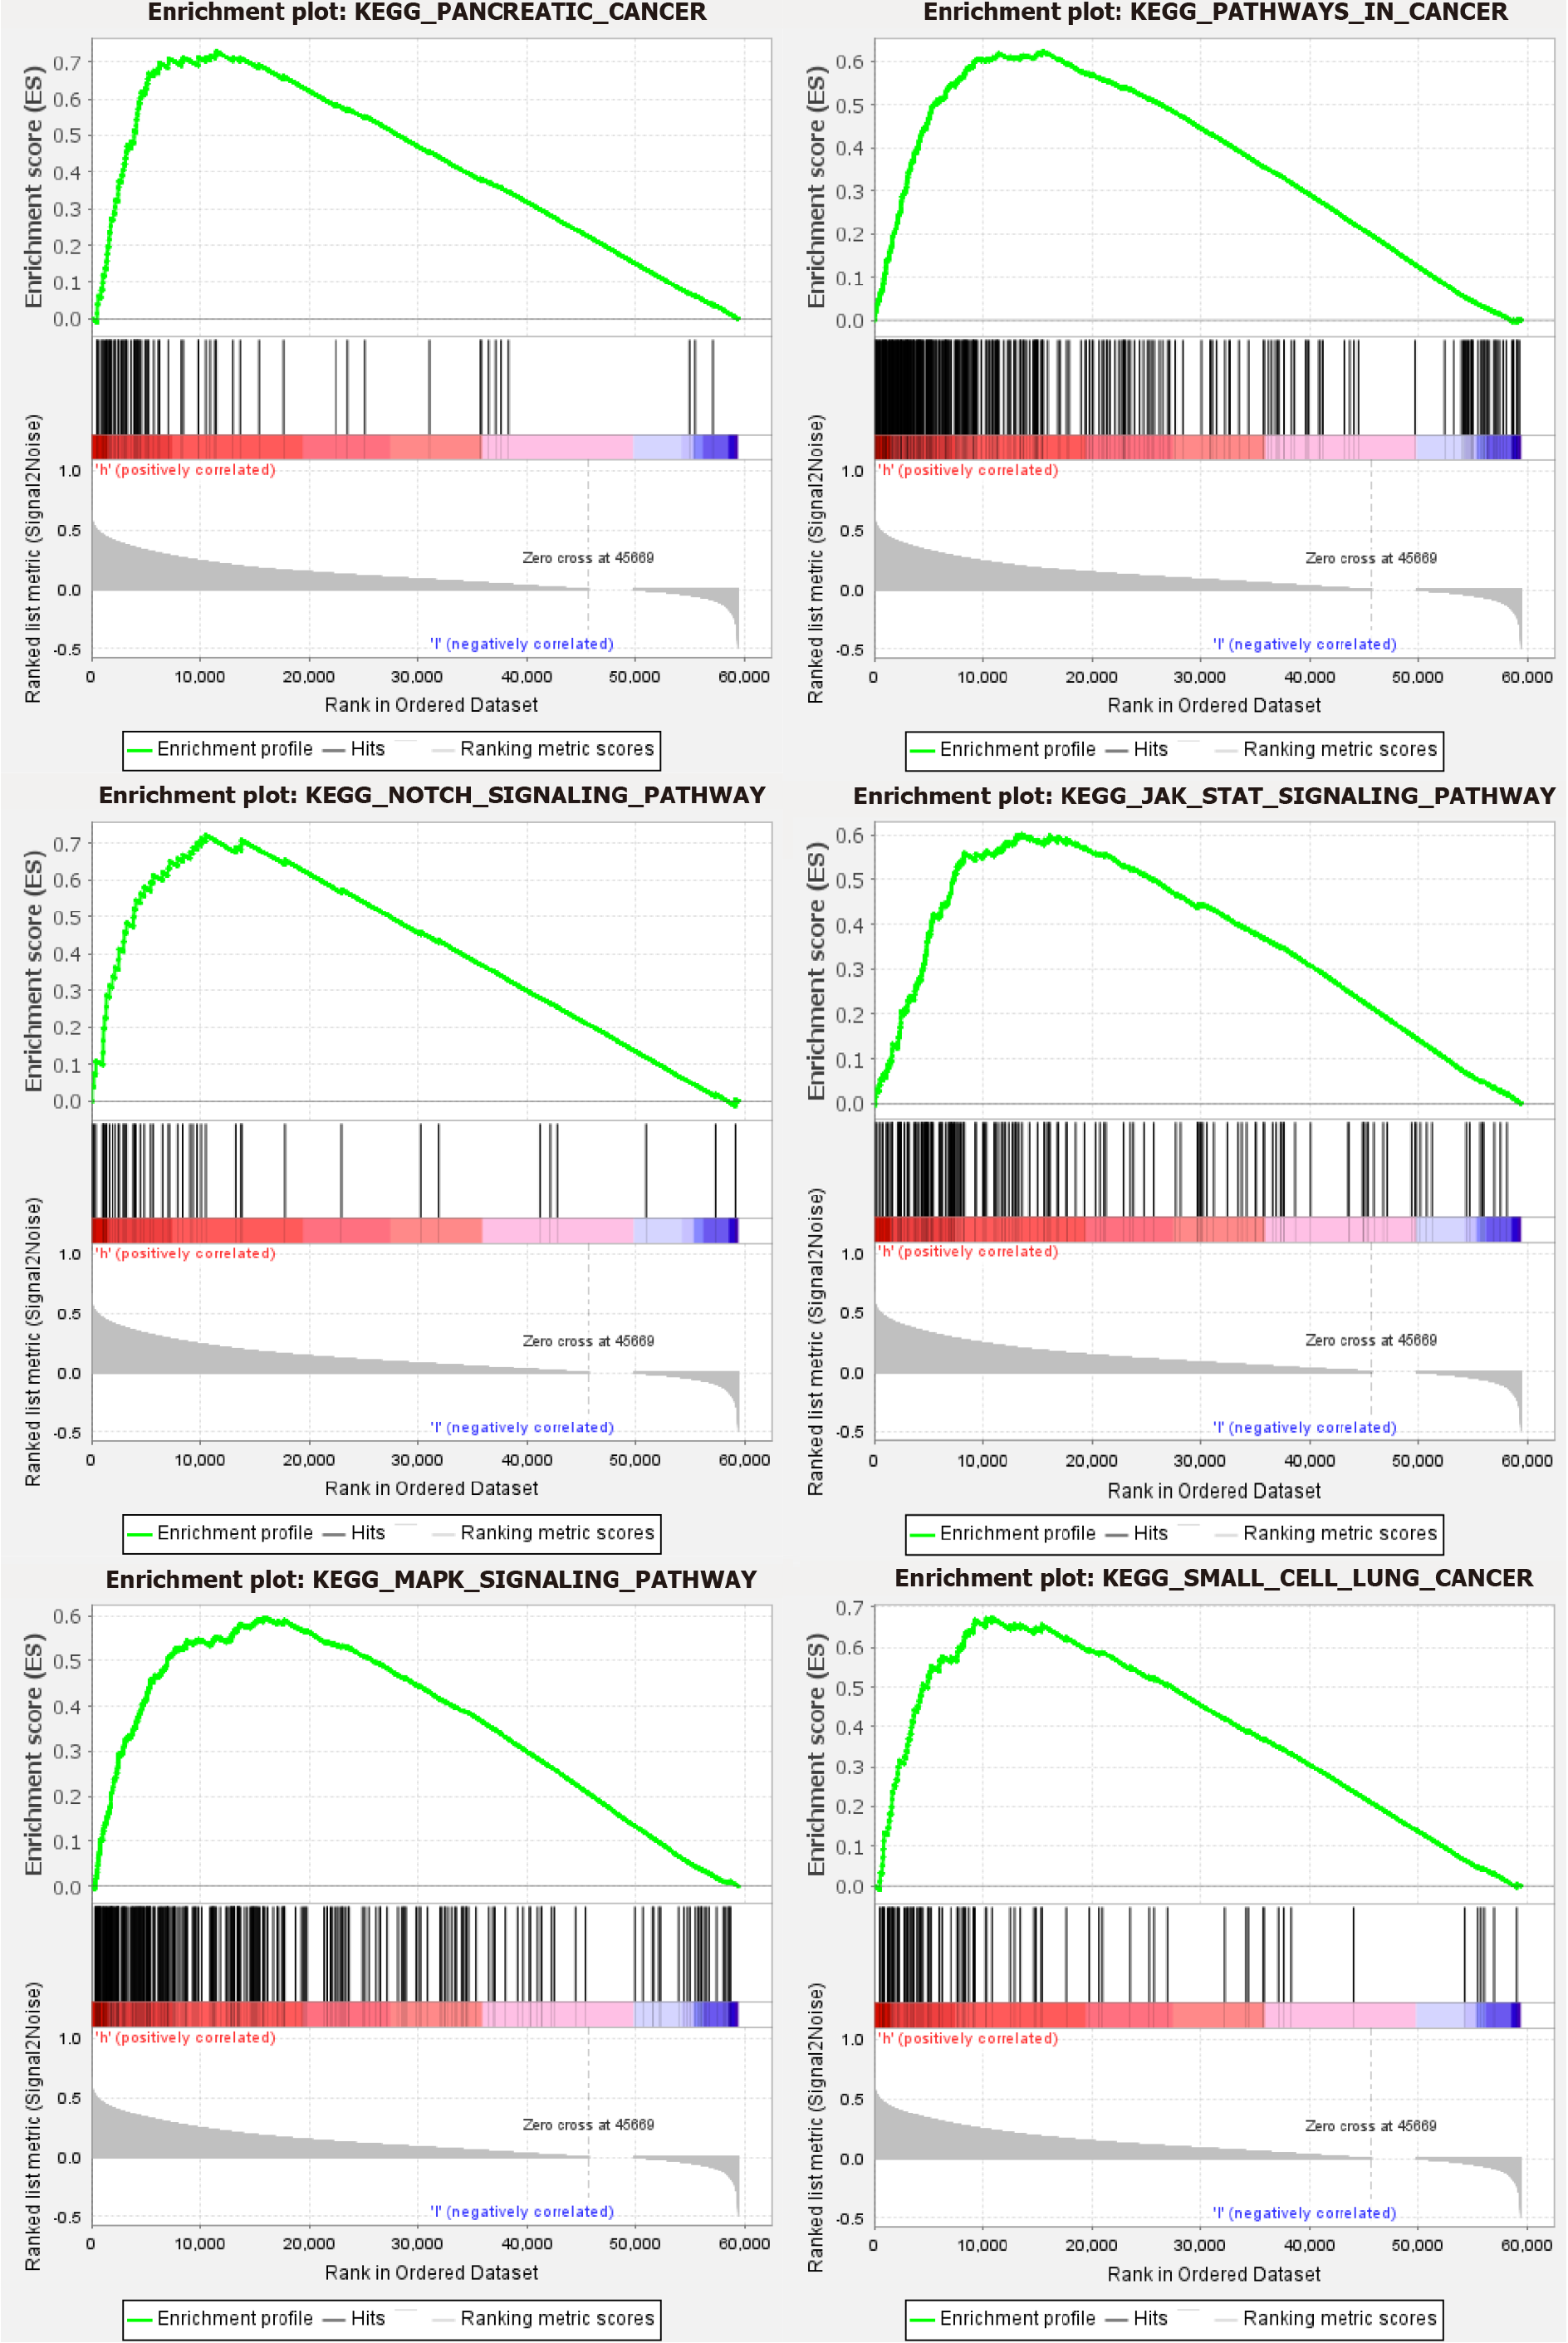
Figure 2 Gene Set Enrichment Analysis of oncogenic pathways upregulated by protein tyrosine phosphatase non-receptor 2 in hepato
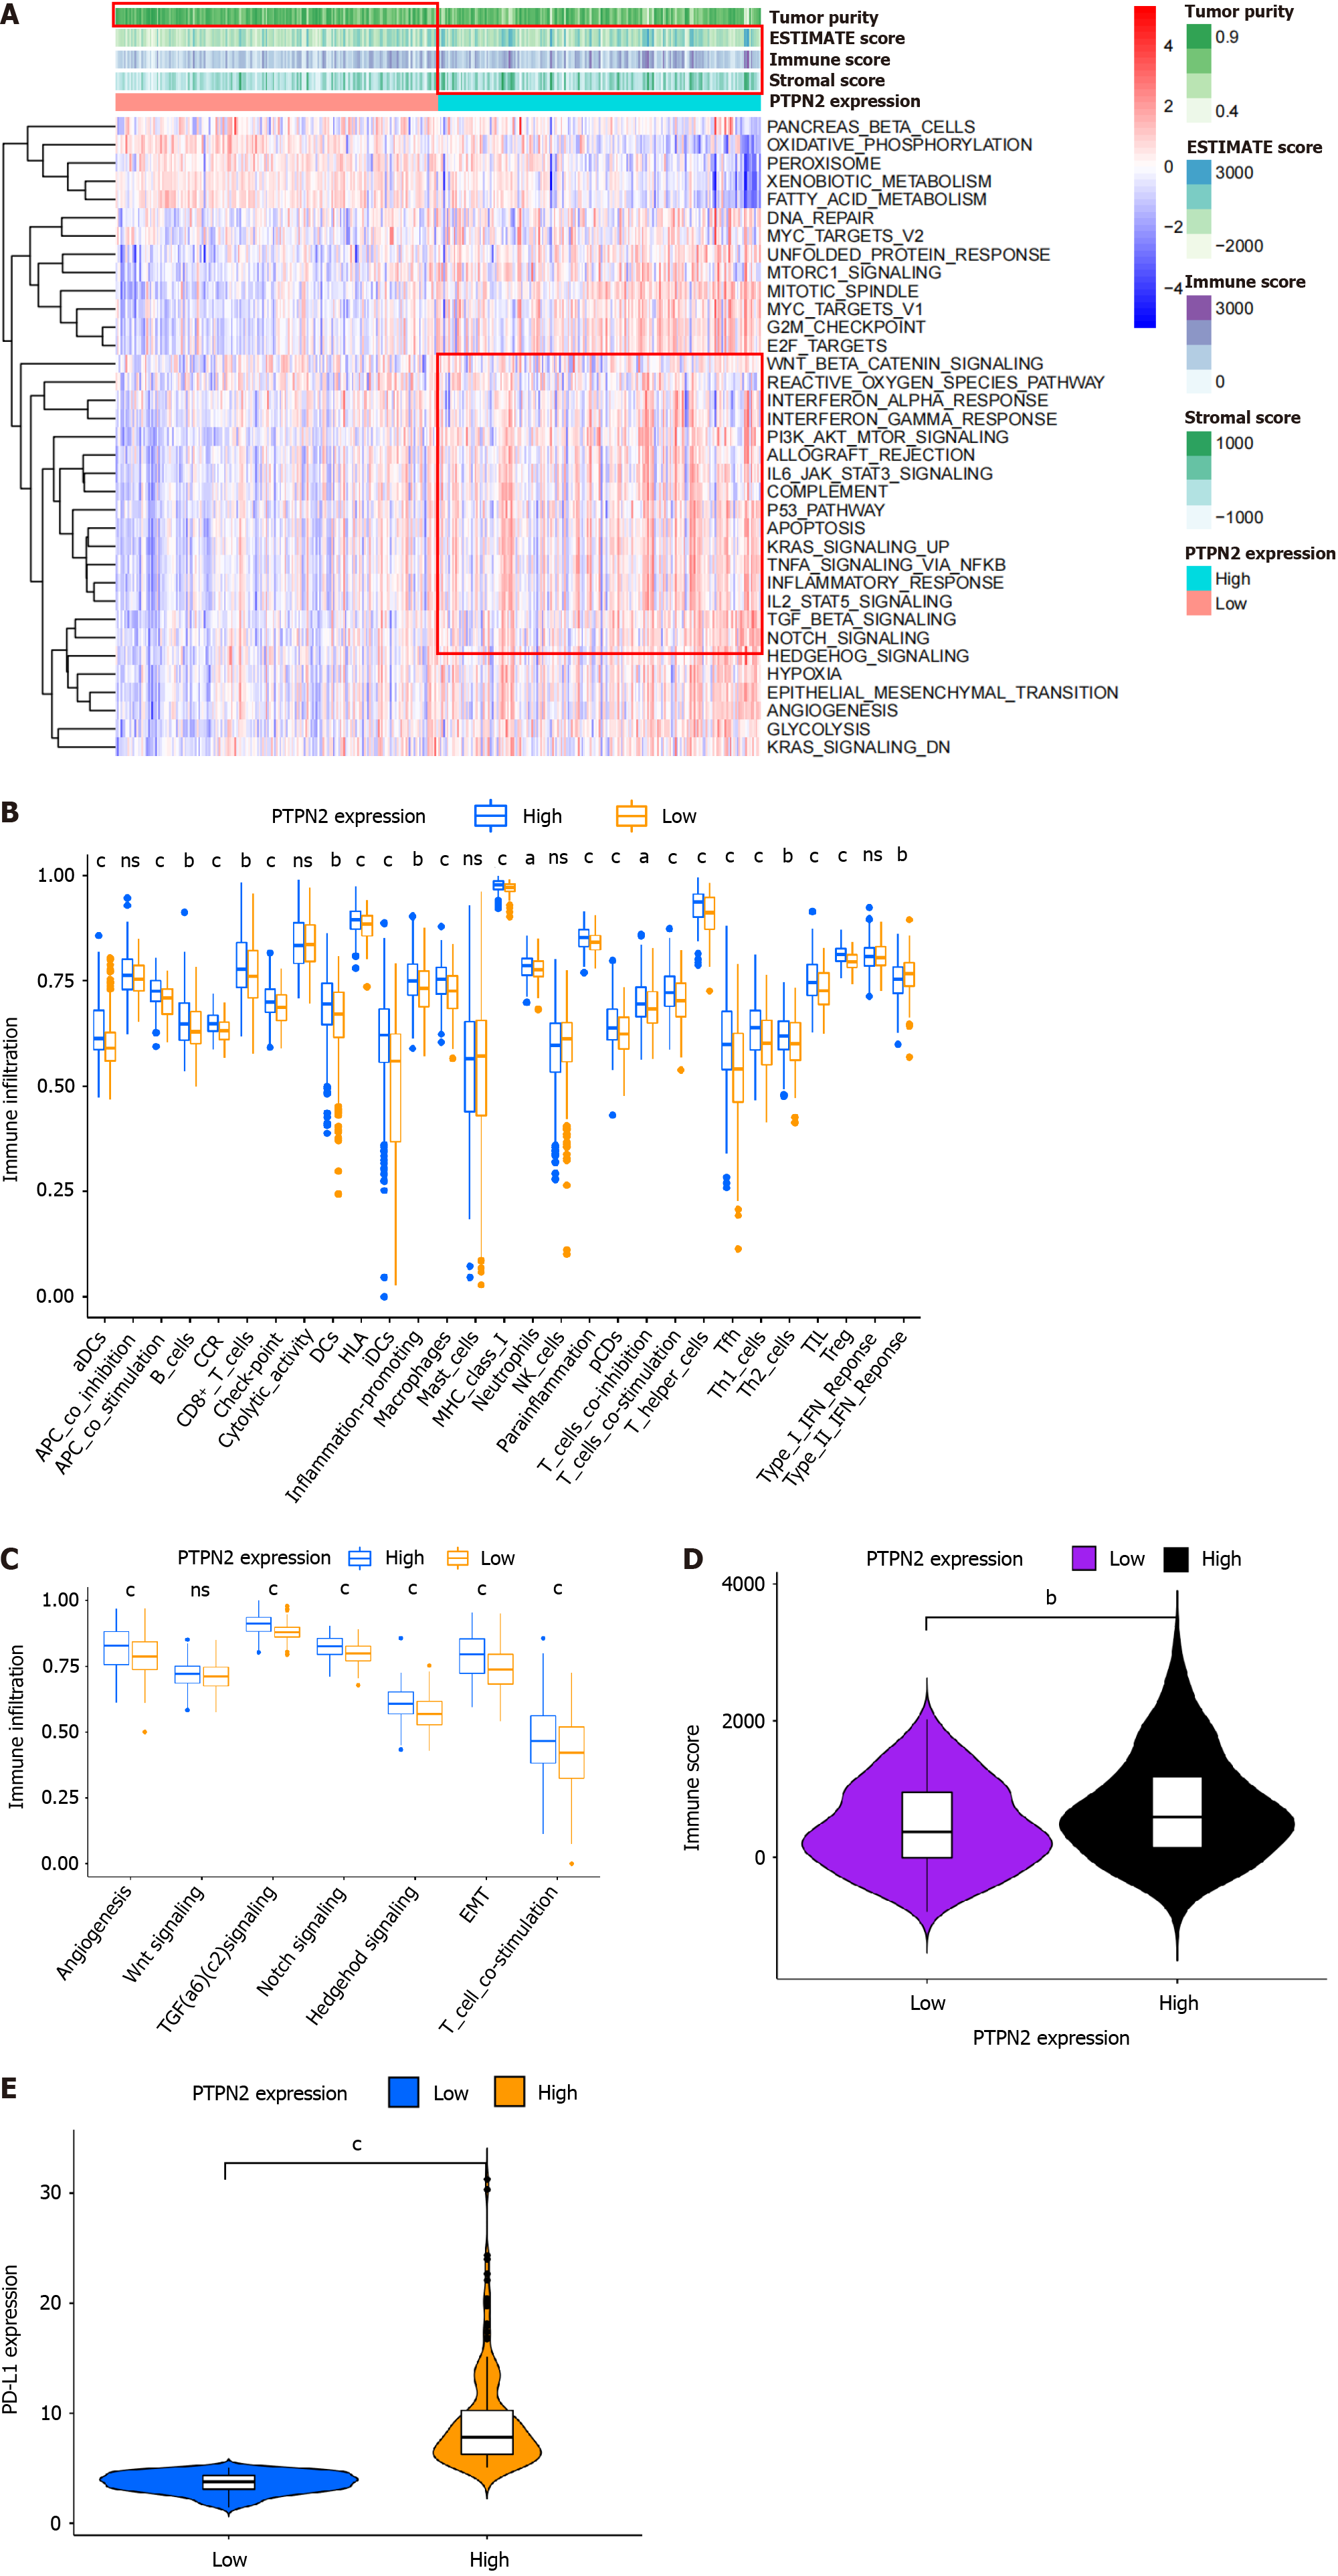
Figure 3 Analysis of relationship between protein tyrosine phosphatase non-receptor 2 expression and the immune microenvironment in hepatocellular carcinoma.
A: Enrichment of differentially expressed genes between the high and low protein tyrosine phosphatase non-receptor 2 (PTPN2) expression groups in the hallmark pathways of hepatocellular carcinoma (HCC). The results showed that genes upregulated in PTPN2-high vs PTPN2-low samples in HCC mainly regulate immune activation and inflammatory response through the Wnt signaling pathway, Hedgehog signaling pathway, interleukin (IL)6-Janus kinase-signal transducer and activator of transcription (STAT)3 signaling pathway, IL2-STAT5 signaling pathway, KRAS signaling pathway, and inflammatory response; B: Differential functional analysis of immune cells in the high and low PTPN2 expression groups of patients with HCC. Blue represents high expression samples, and red represents low expression samples; C: Differential analysis of interstitial signaling pathways in the high and low PTPN2 expression groups of patients with HCC and assessment of immune cell scores. Blue represents high expression samples, and red represents low expression samples; D and E: Immunotherapeutic effect in the high and low PTPN2 expression groups calculated with the ESTIMATE algorithm; aP < 0.05; bP < 0.01; cP < 0.001; ns: P > 0.05. PTPN2: Protein tyrosine phosphatase non-receptor 2.
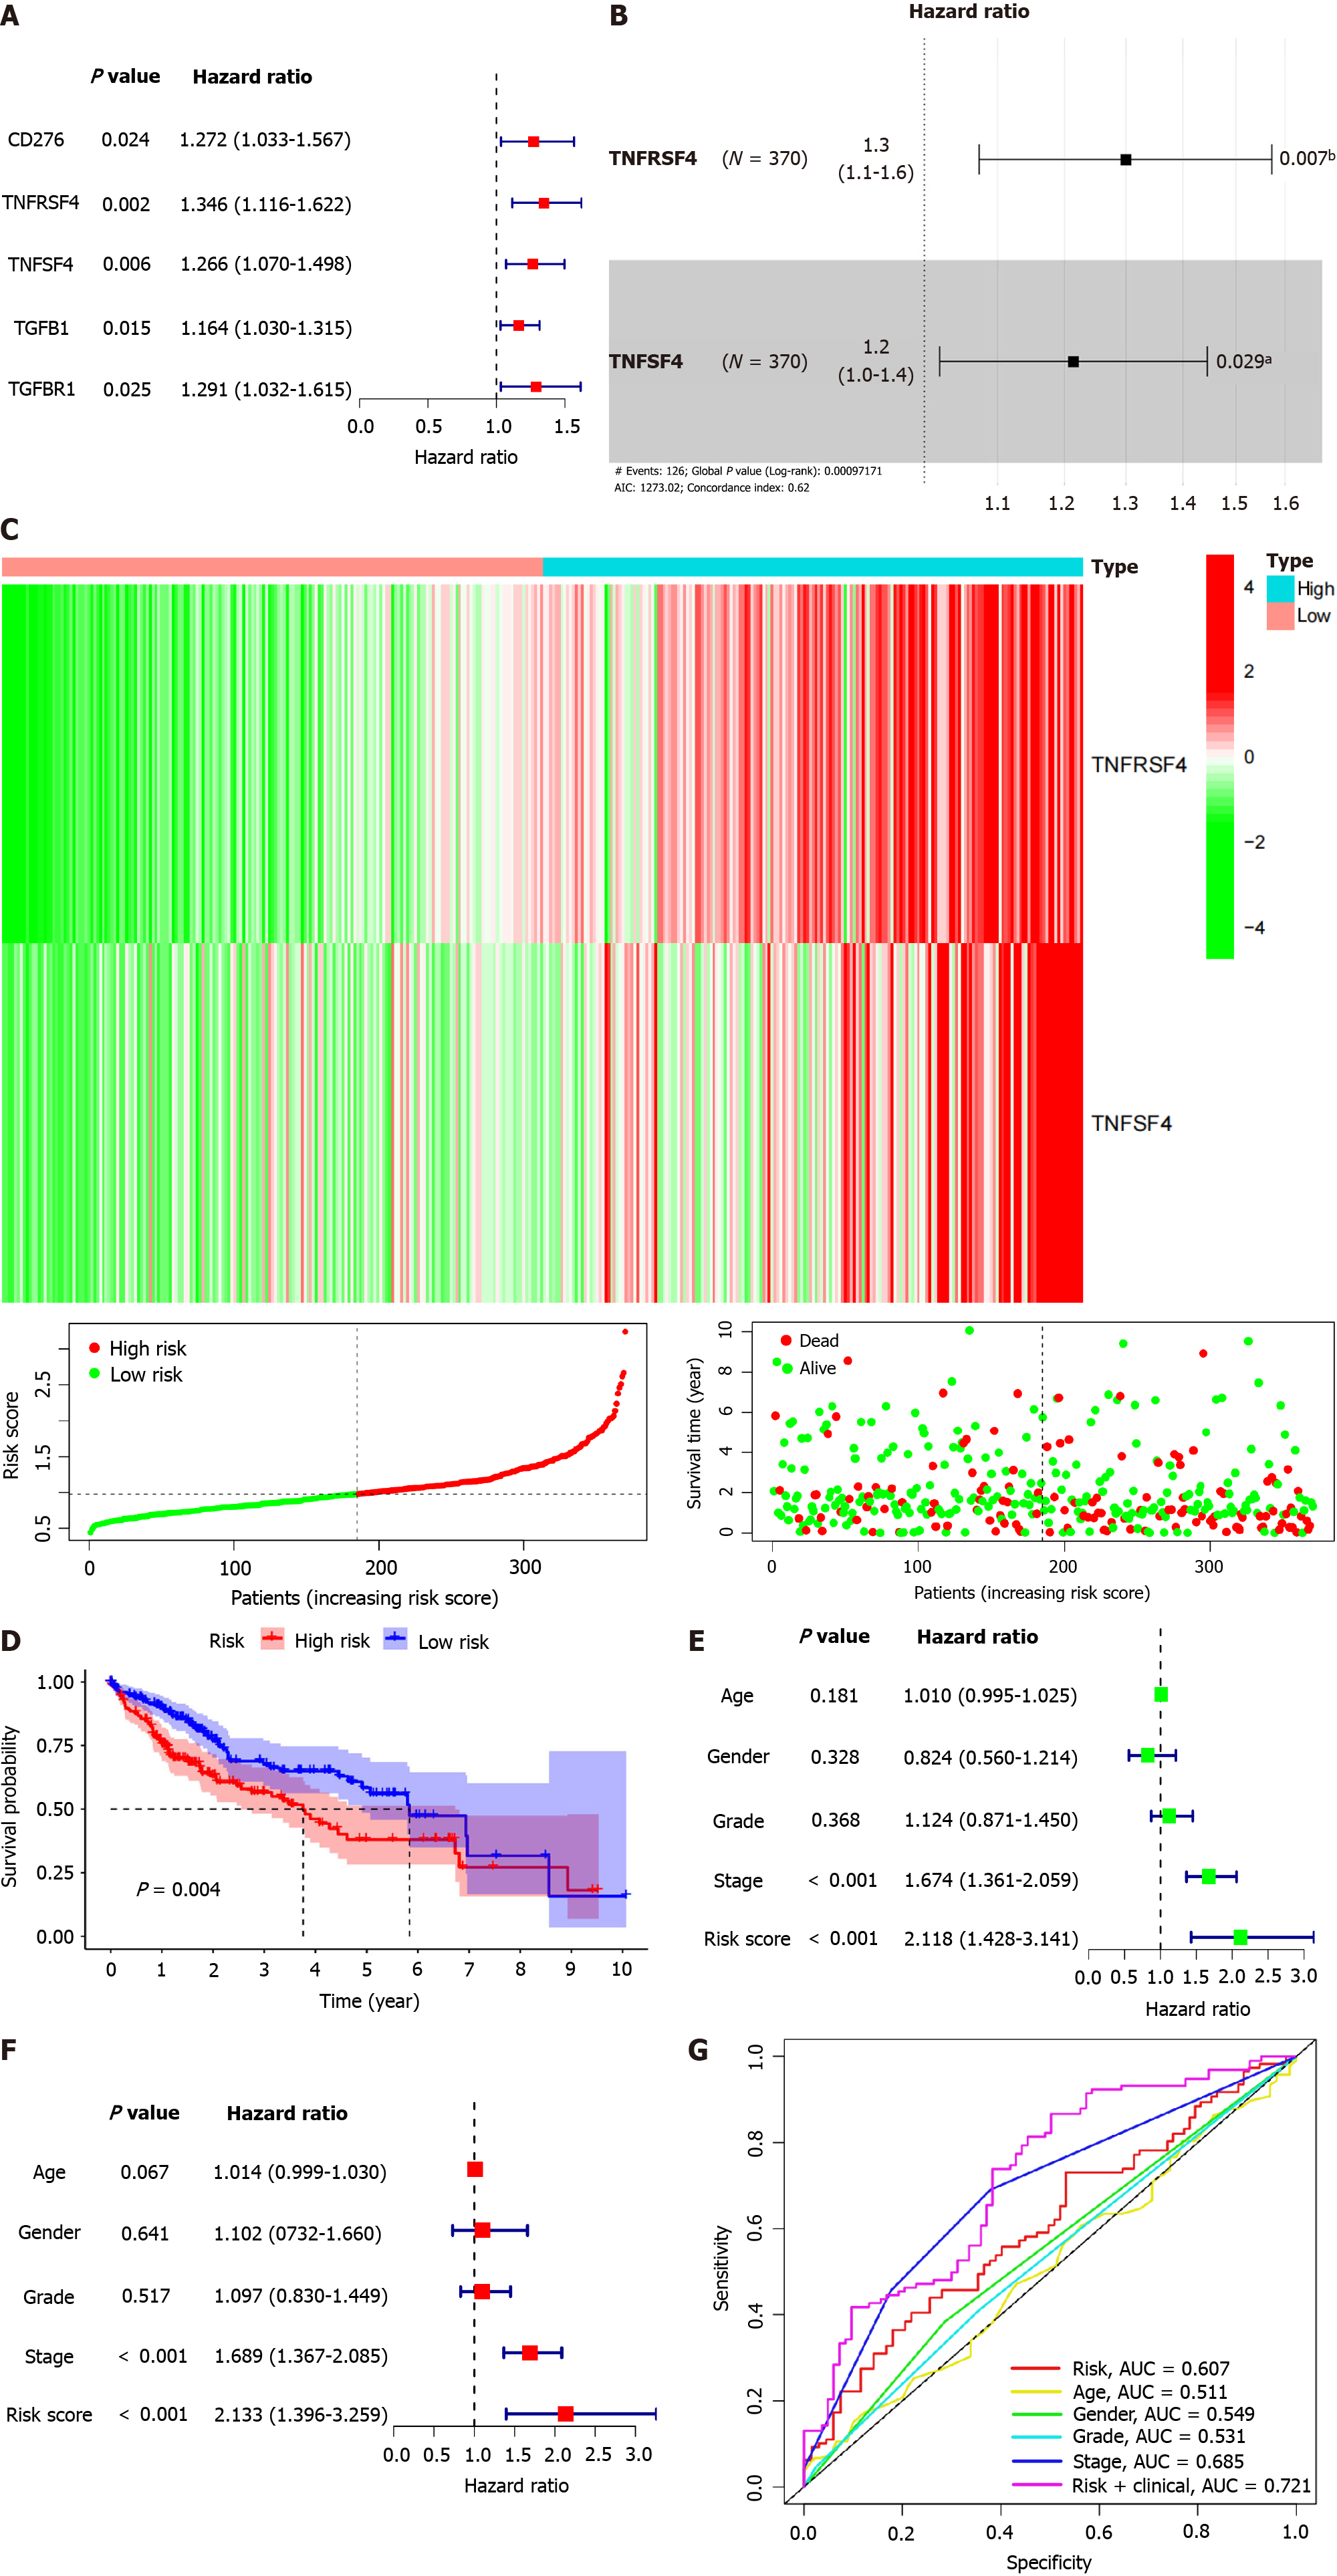
Figure 4 Risk model construction based on protein tyrosine phosphatase non-receptor 2-associated immunomodulators in hepato
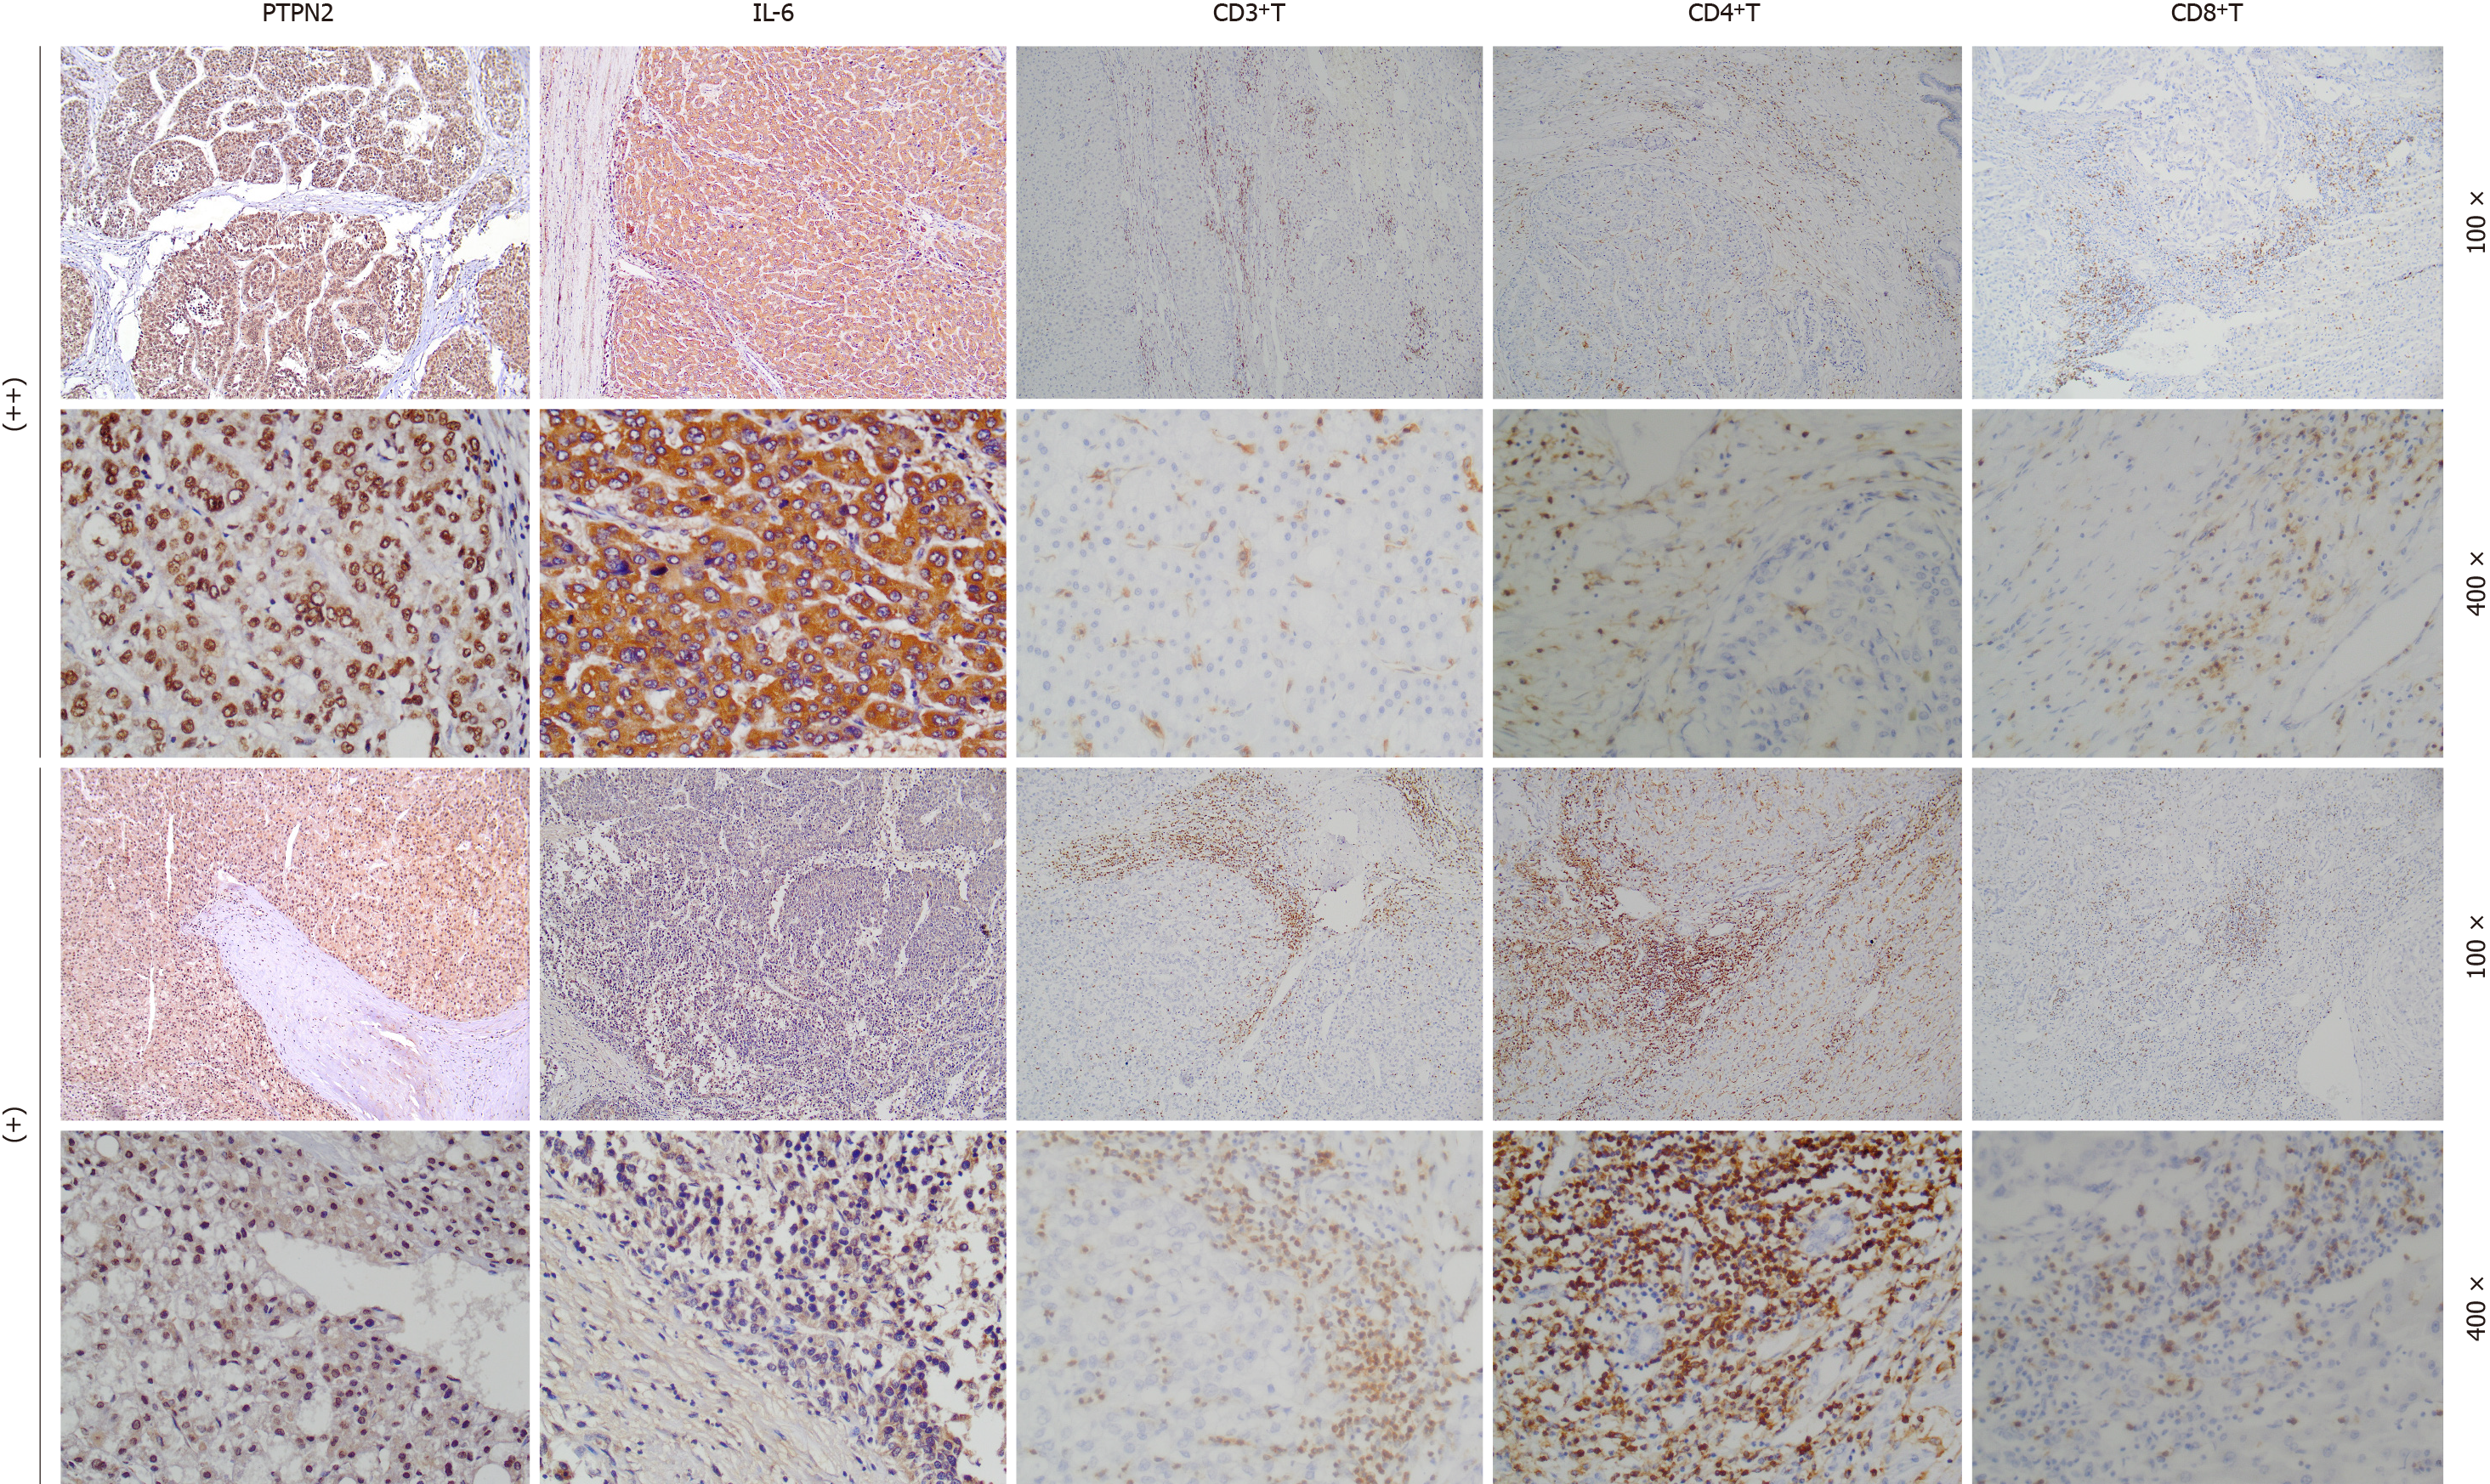
Figure 5 Immune cell infiltration in high and low protein tyrosine phosphatase non-receptor 2 expression groups.
++: Interleukin (IL)-6+ T-cell, CD3+ T-cell, CD4+ T-cell and CD8+ T-cell infiltration in the high protein tyrosine phosphatase non-receptor 2 (PTPN2) expression group; +: IL-6+ T-cell, CD3+ T-cell, CD4+ T-cell, and CD8+ T-cell infiltration in the low PTPN2 expression group. IL: Interleukin; PTPN2: Protein tyrosine phosphatase non-receptor 2.
- Citation: Li HY, Jing YM, Shen X, Tang MY, Shen HH, Li XW, Wang ZS, Su F. Protein tyrosine phosphatase non-receptor II: A possible biomarker of poor prognosis and mediator of immune evasion in hepatocellular carcinoma. World J Gastrointest Oncol 2024; 16(9): 3913-3931
- URL: https://www.wjgnet.com/1948-5204/full/v16/i9/3913.htm
- DOI: https://dx.doi.org/10.4251/wjgo.v16.i9.3913


