Copyright
©The Author(s) 2024.
World J Gastrointest Oncol. Sep 15, 2024; 16(9): 3887-3897
Published online Sep 15, 2024. doi: 10.4251/wjgo.v16.i9.3887
Published online Sep 15, 2024. doi: 10.4251/wjgo.v16.i9.3887
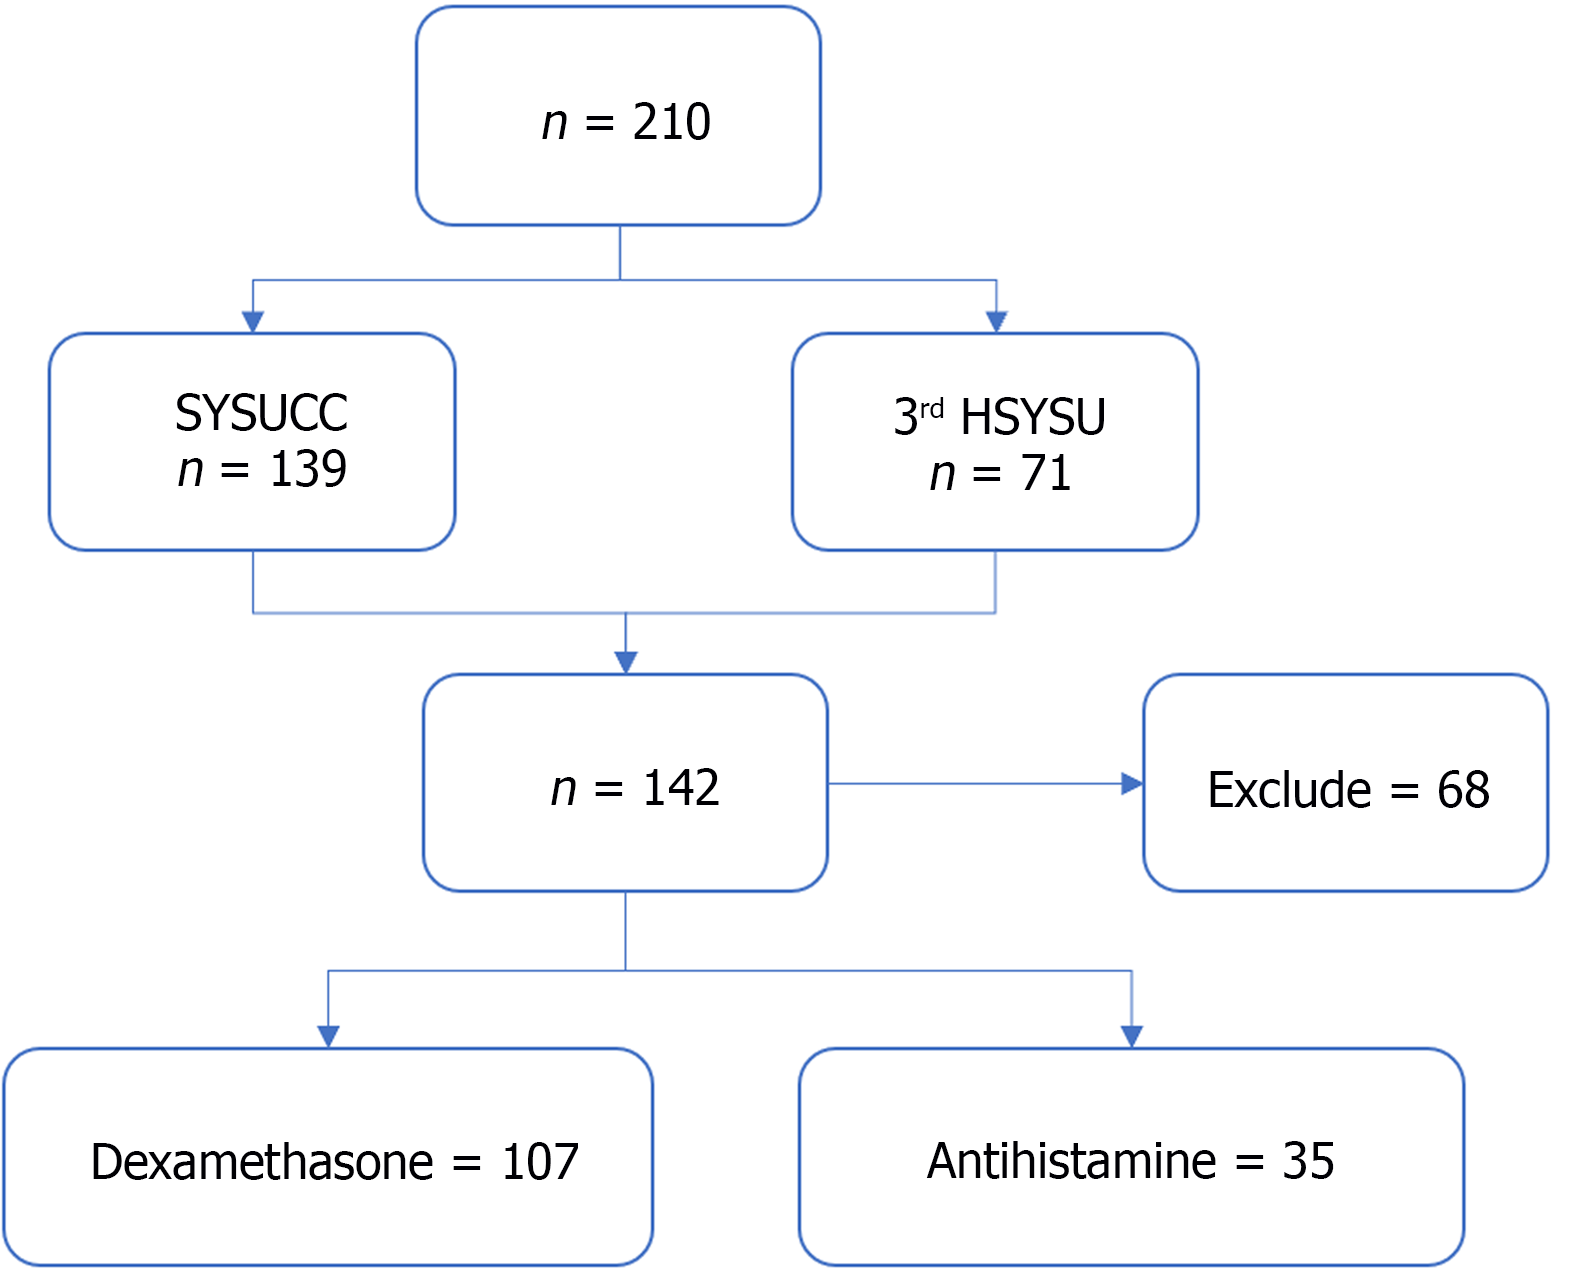
Figure 1 Workflow of this study.
SYSUCC: The Sun Yat-sen University Cancer Center; 3rd HSYSU: The Third Affiliated Hospital of Sun Yat-sen University.
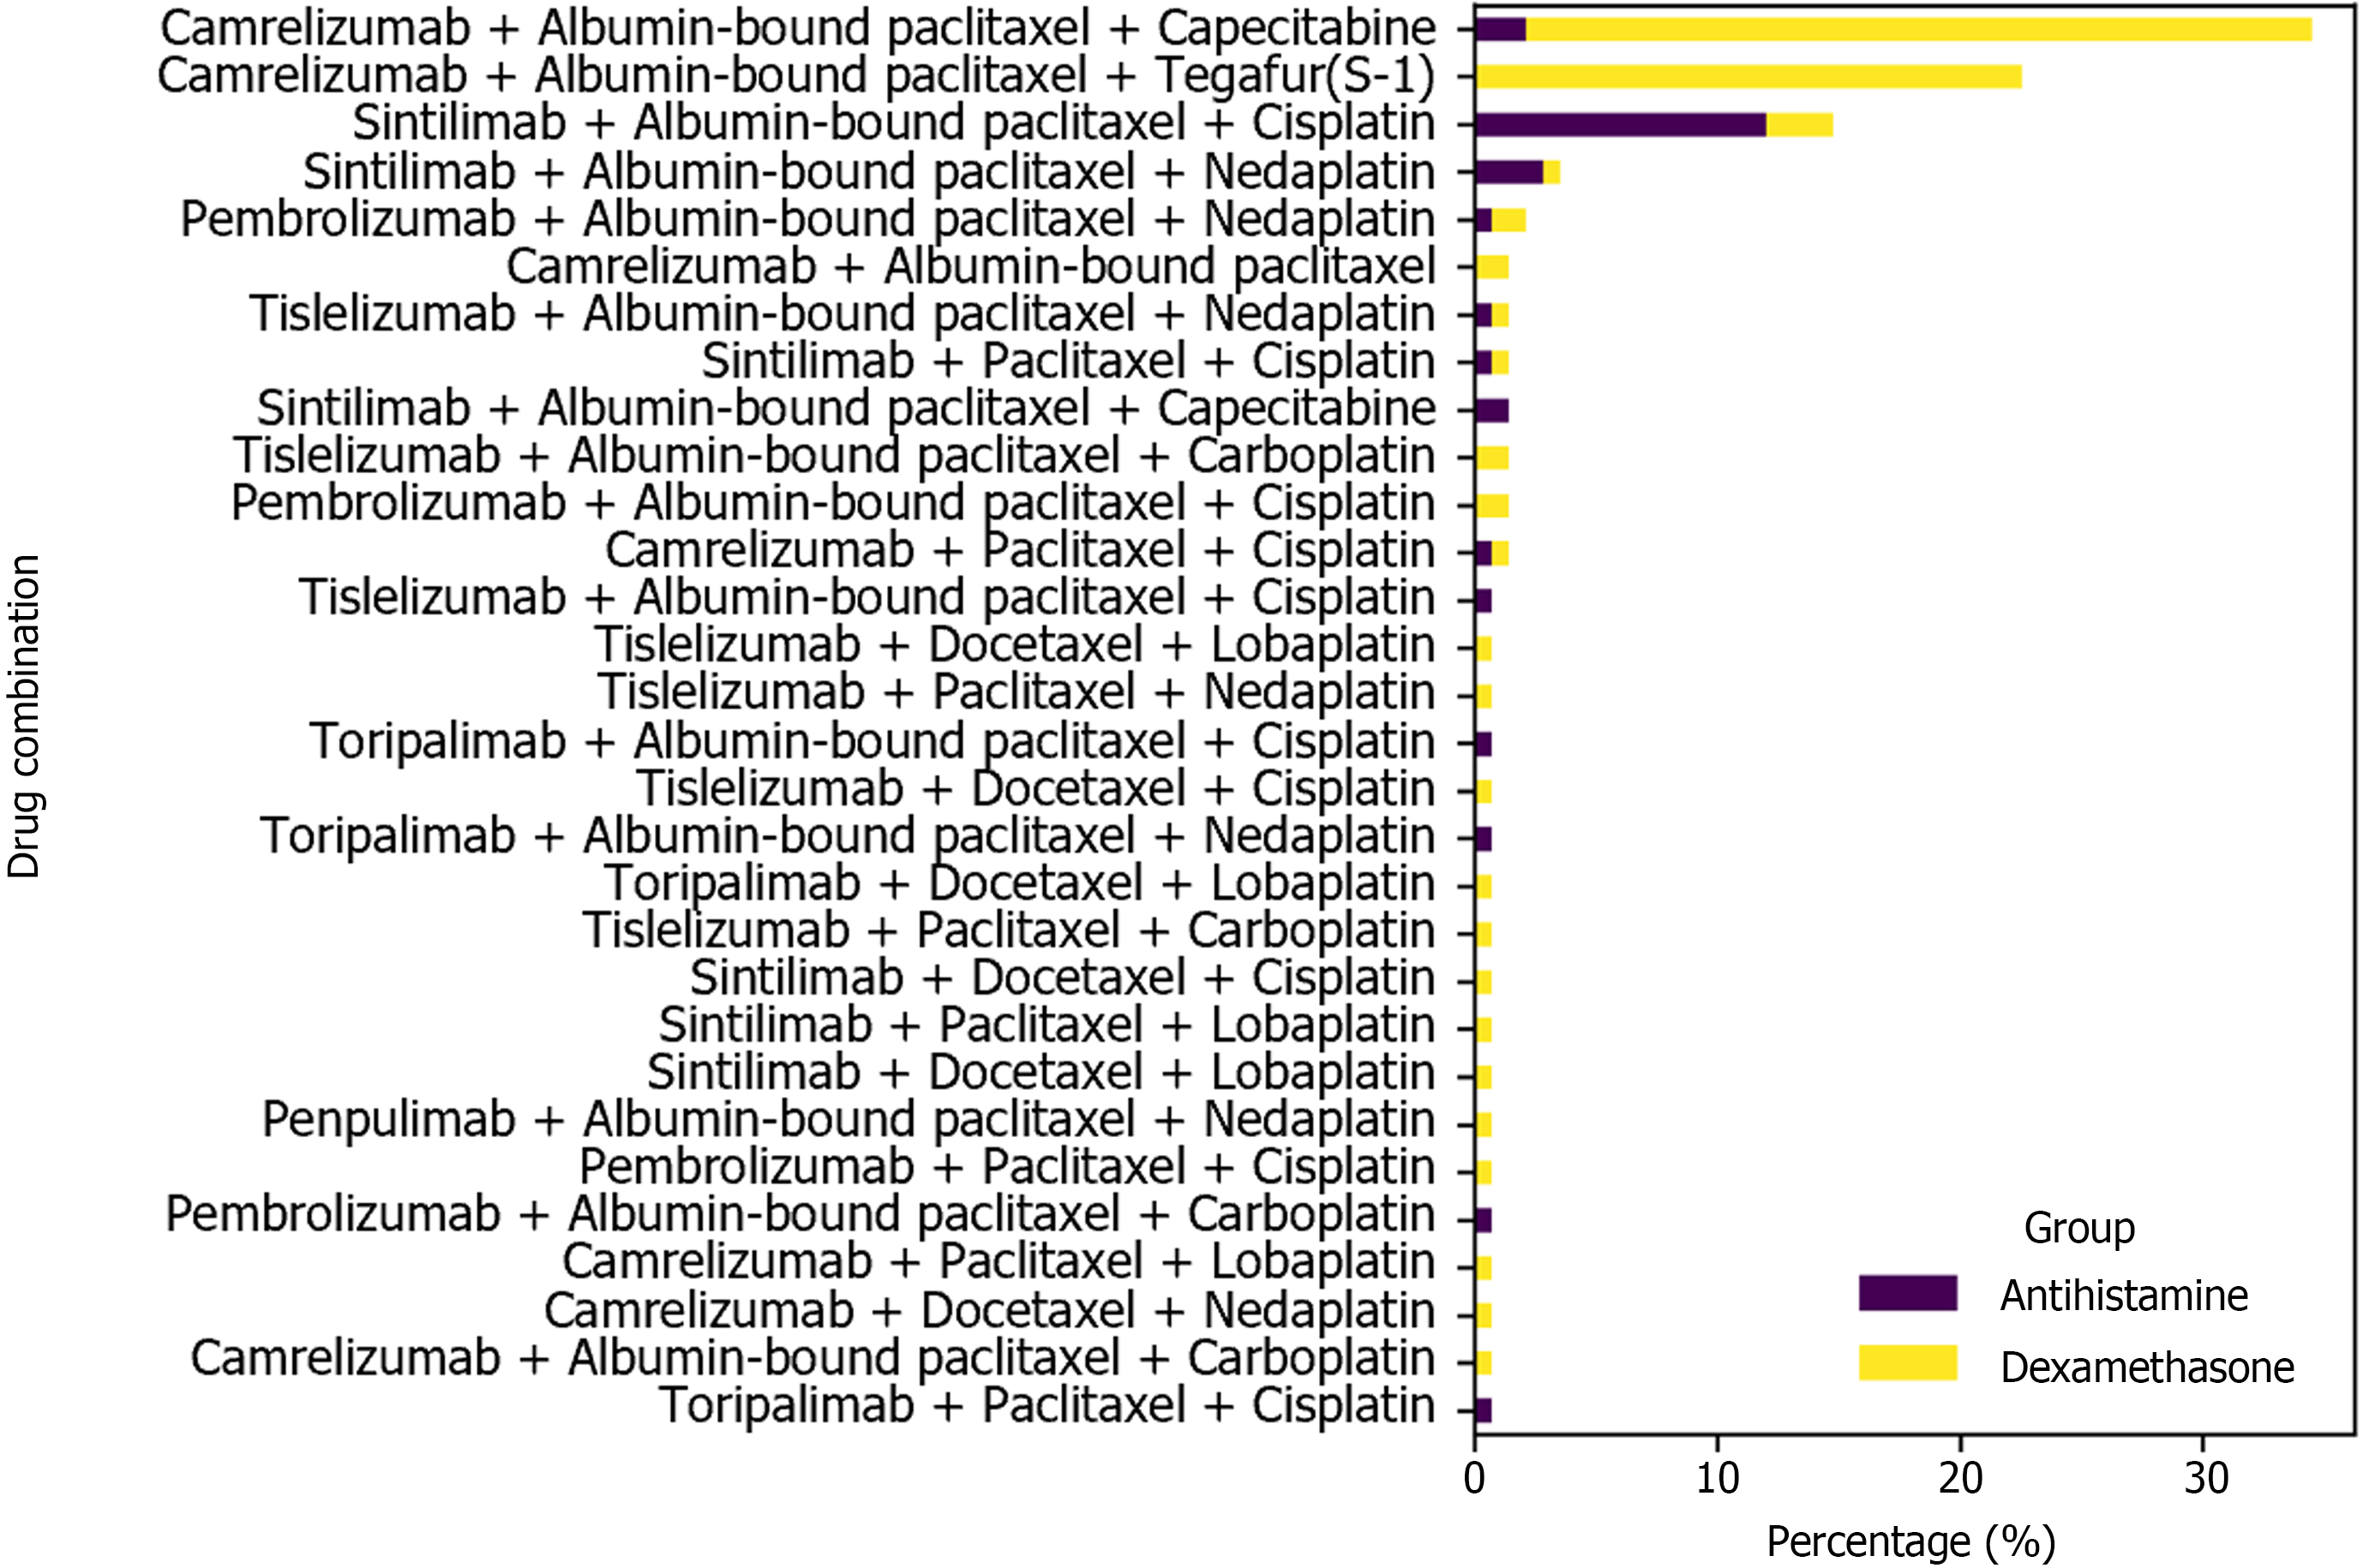
Figure 2 Immunochemotherapy regimen and pre-treatment medications.
This bar chart shows the distribution of various drug combinations used in neoadjuvant immunochemotherapy for patients with locally advanced esophageal squamous cell carcinoma who were pre-treated with either dexamethasone or antihistamines.
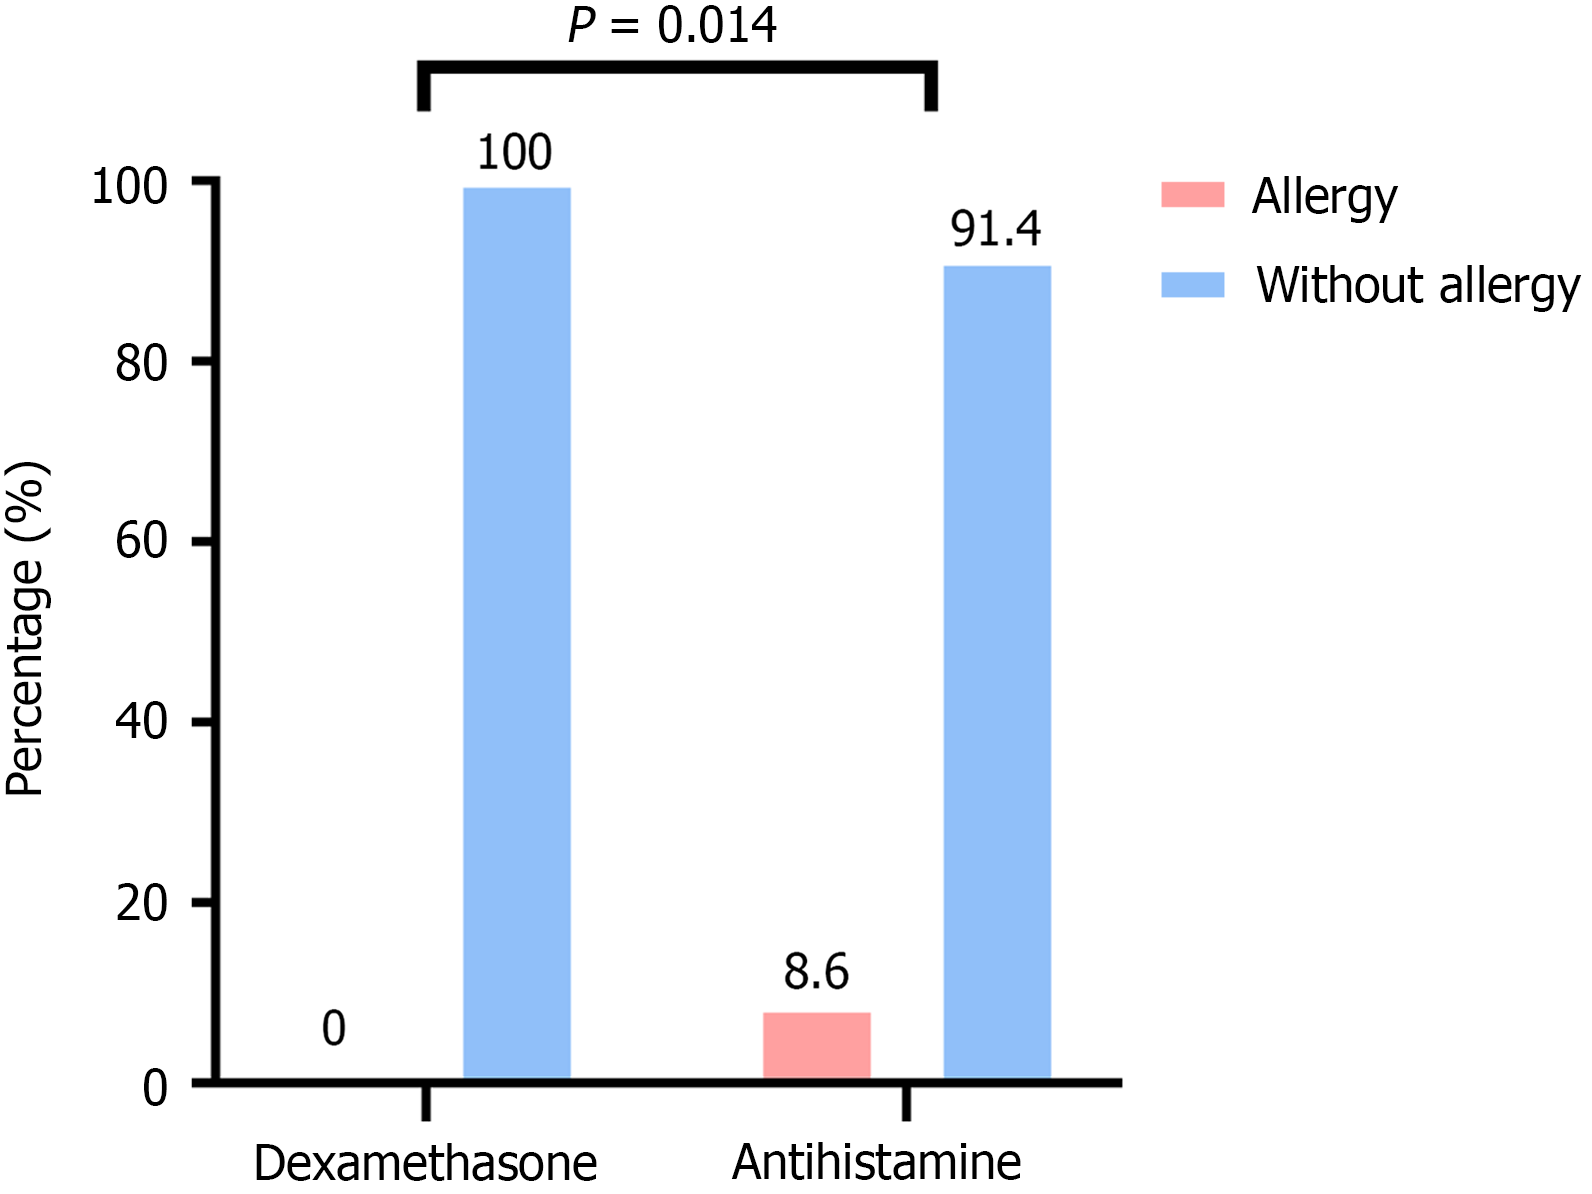
Figure 3 Allergy Assessment.
The figure showing that dexamethasone group is associated with a significantly lower incidence of allergies compared to antihistamine group.
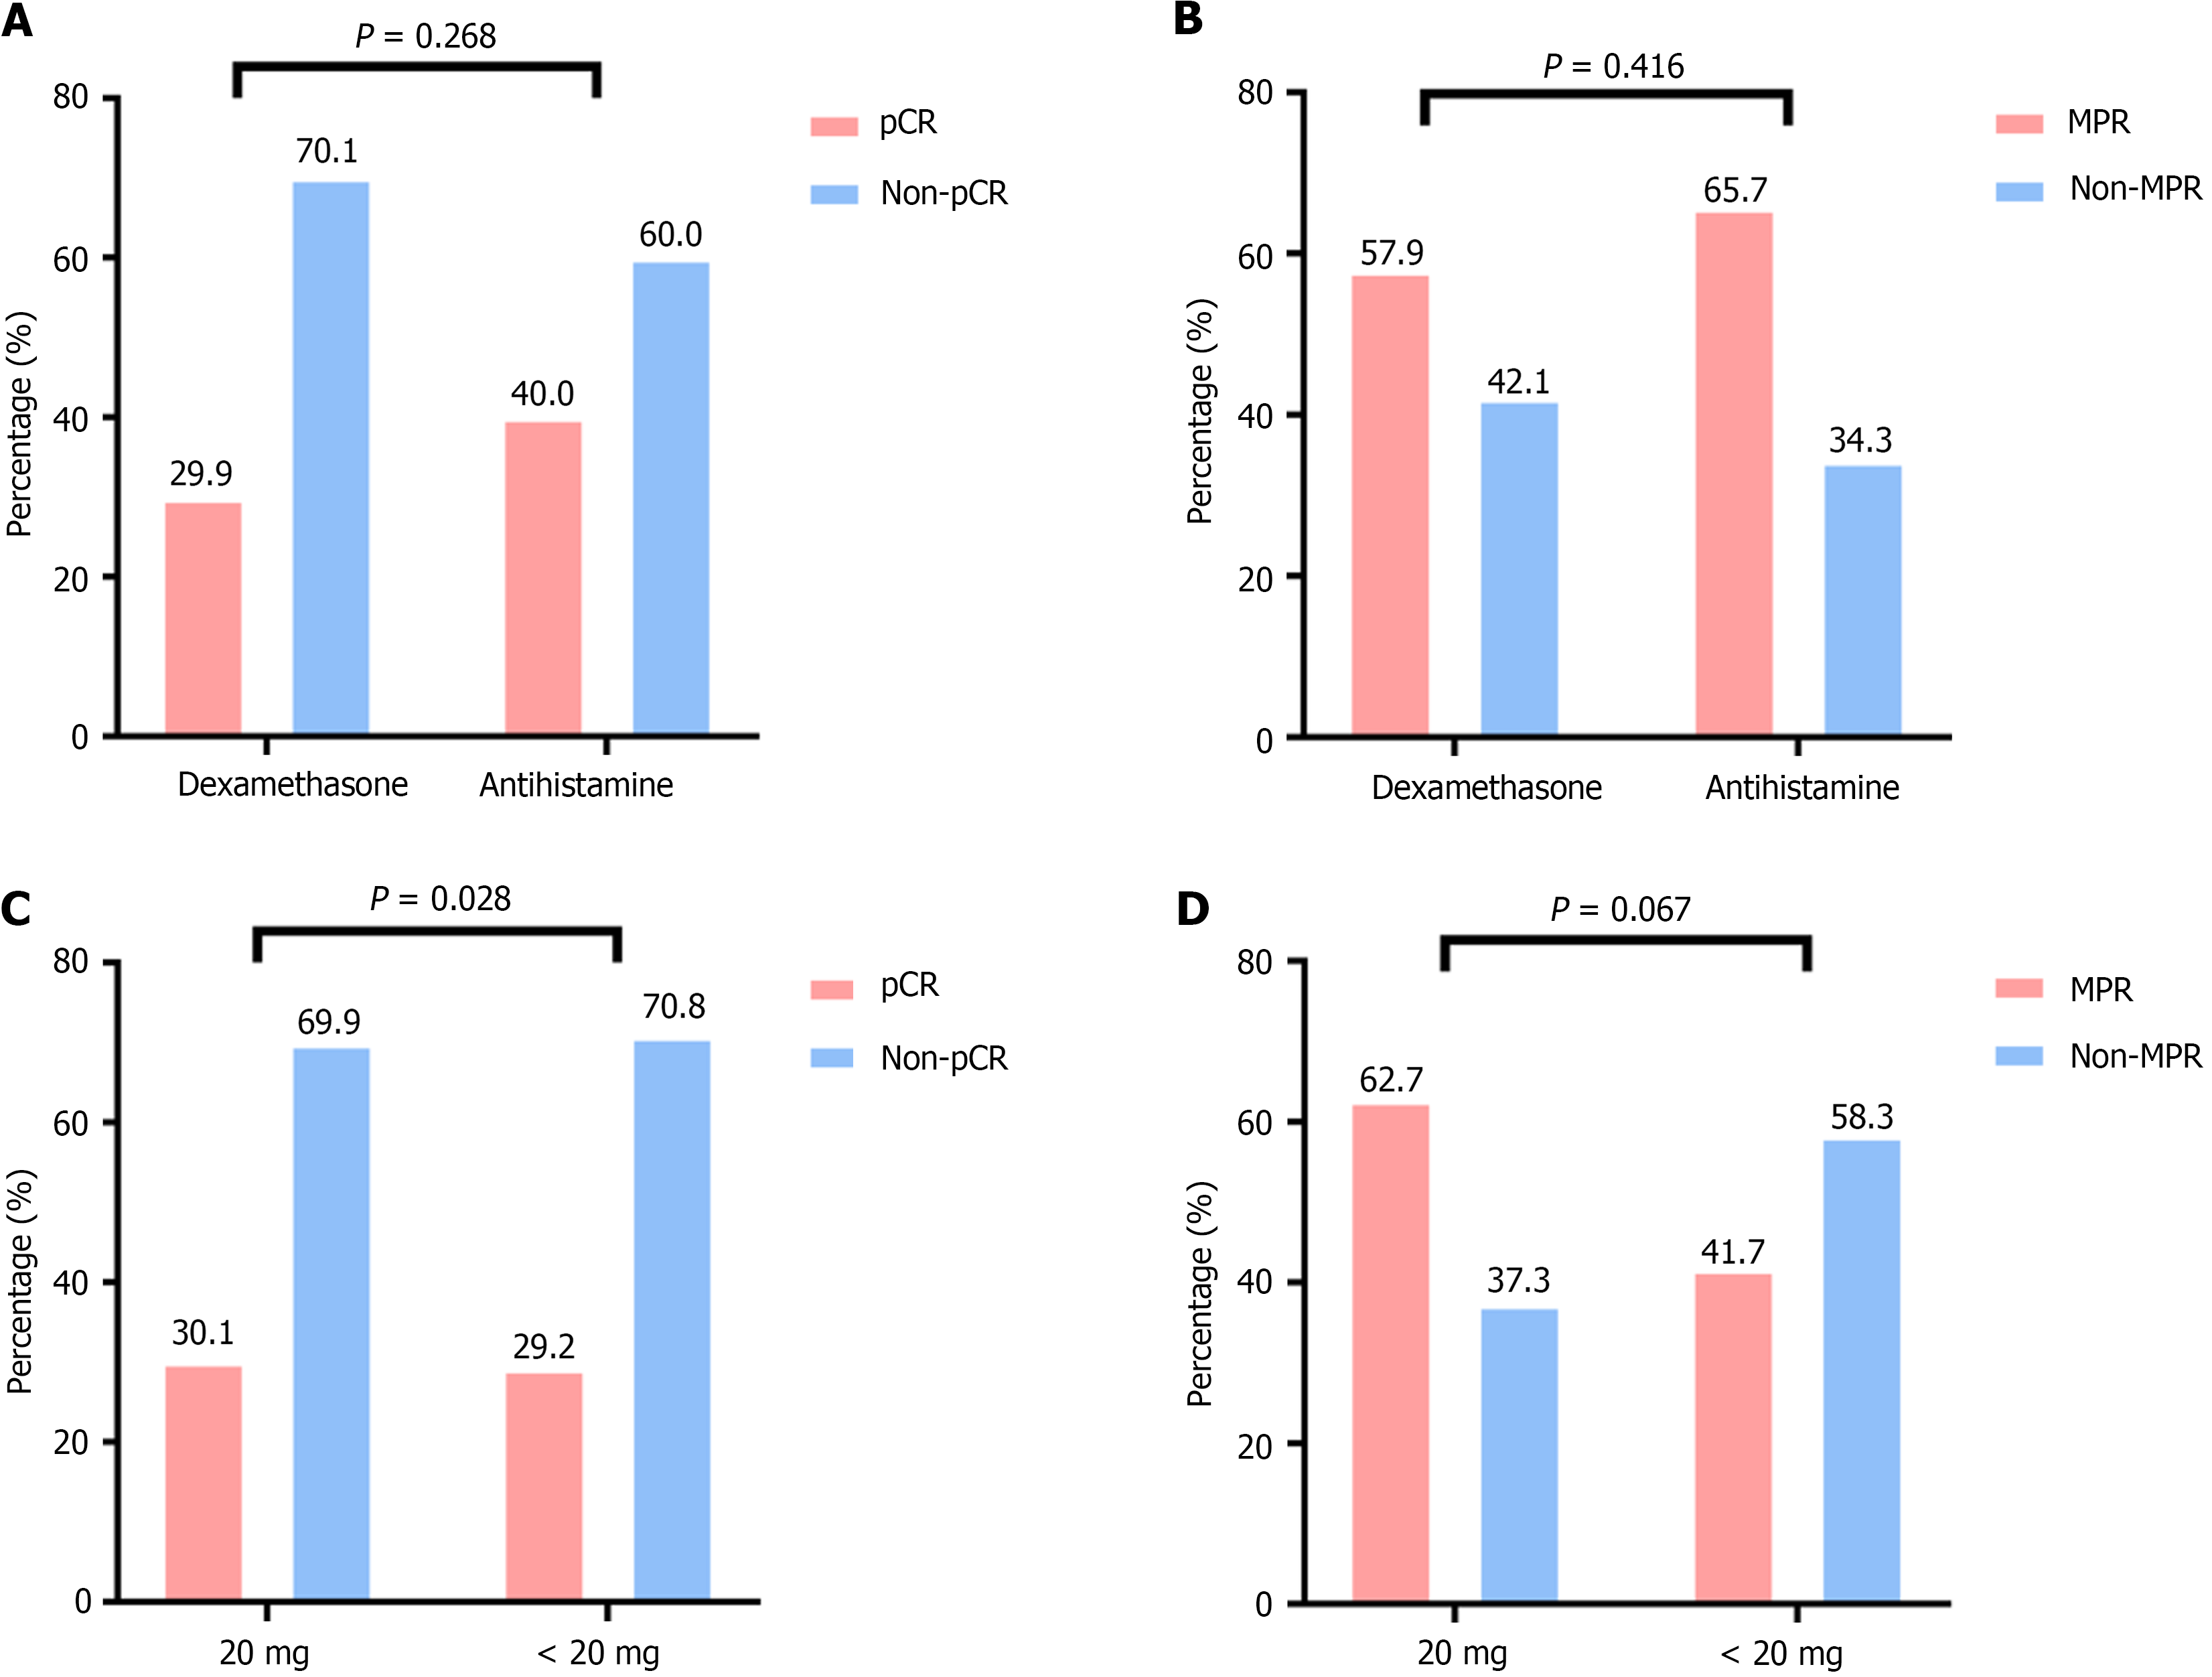
Figure 4 Short-term efficacy assessment.
A: Comparison of complete pathological response (pCR) between the dexamethasone and antihistamine groups. The P value is 0.268, indicating no statistically significant difference between the two groups; B: Comparison of major pathological response (MPR) between the dexamethasone and antihistamine groups. The P value is 0.416, indicating no statistically significant difference between the two groups; C: Comparison of pCR between the < 20 mg dexamethasone group and the 20 mg dexamethasone group. The P value is 0.928, indicating no statistically significant difference between the two dosage groups; D: Comparison of MPR between the < 20 mg dexamethasone group and the 20 mg dexamethasone group. The P value is 0.067, indicating no statistically significant difference between the two dosage groups. pCR: Complete pathological response; MPR: Major pathological response.
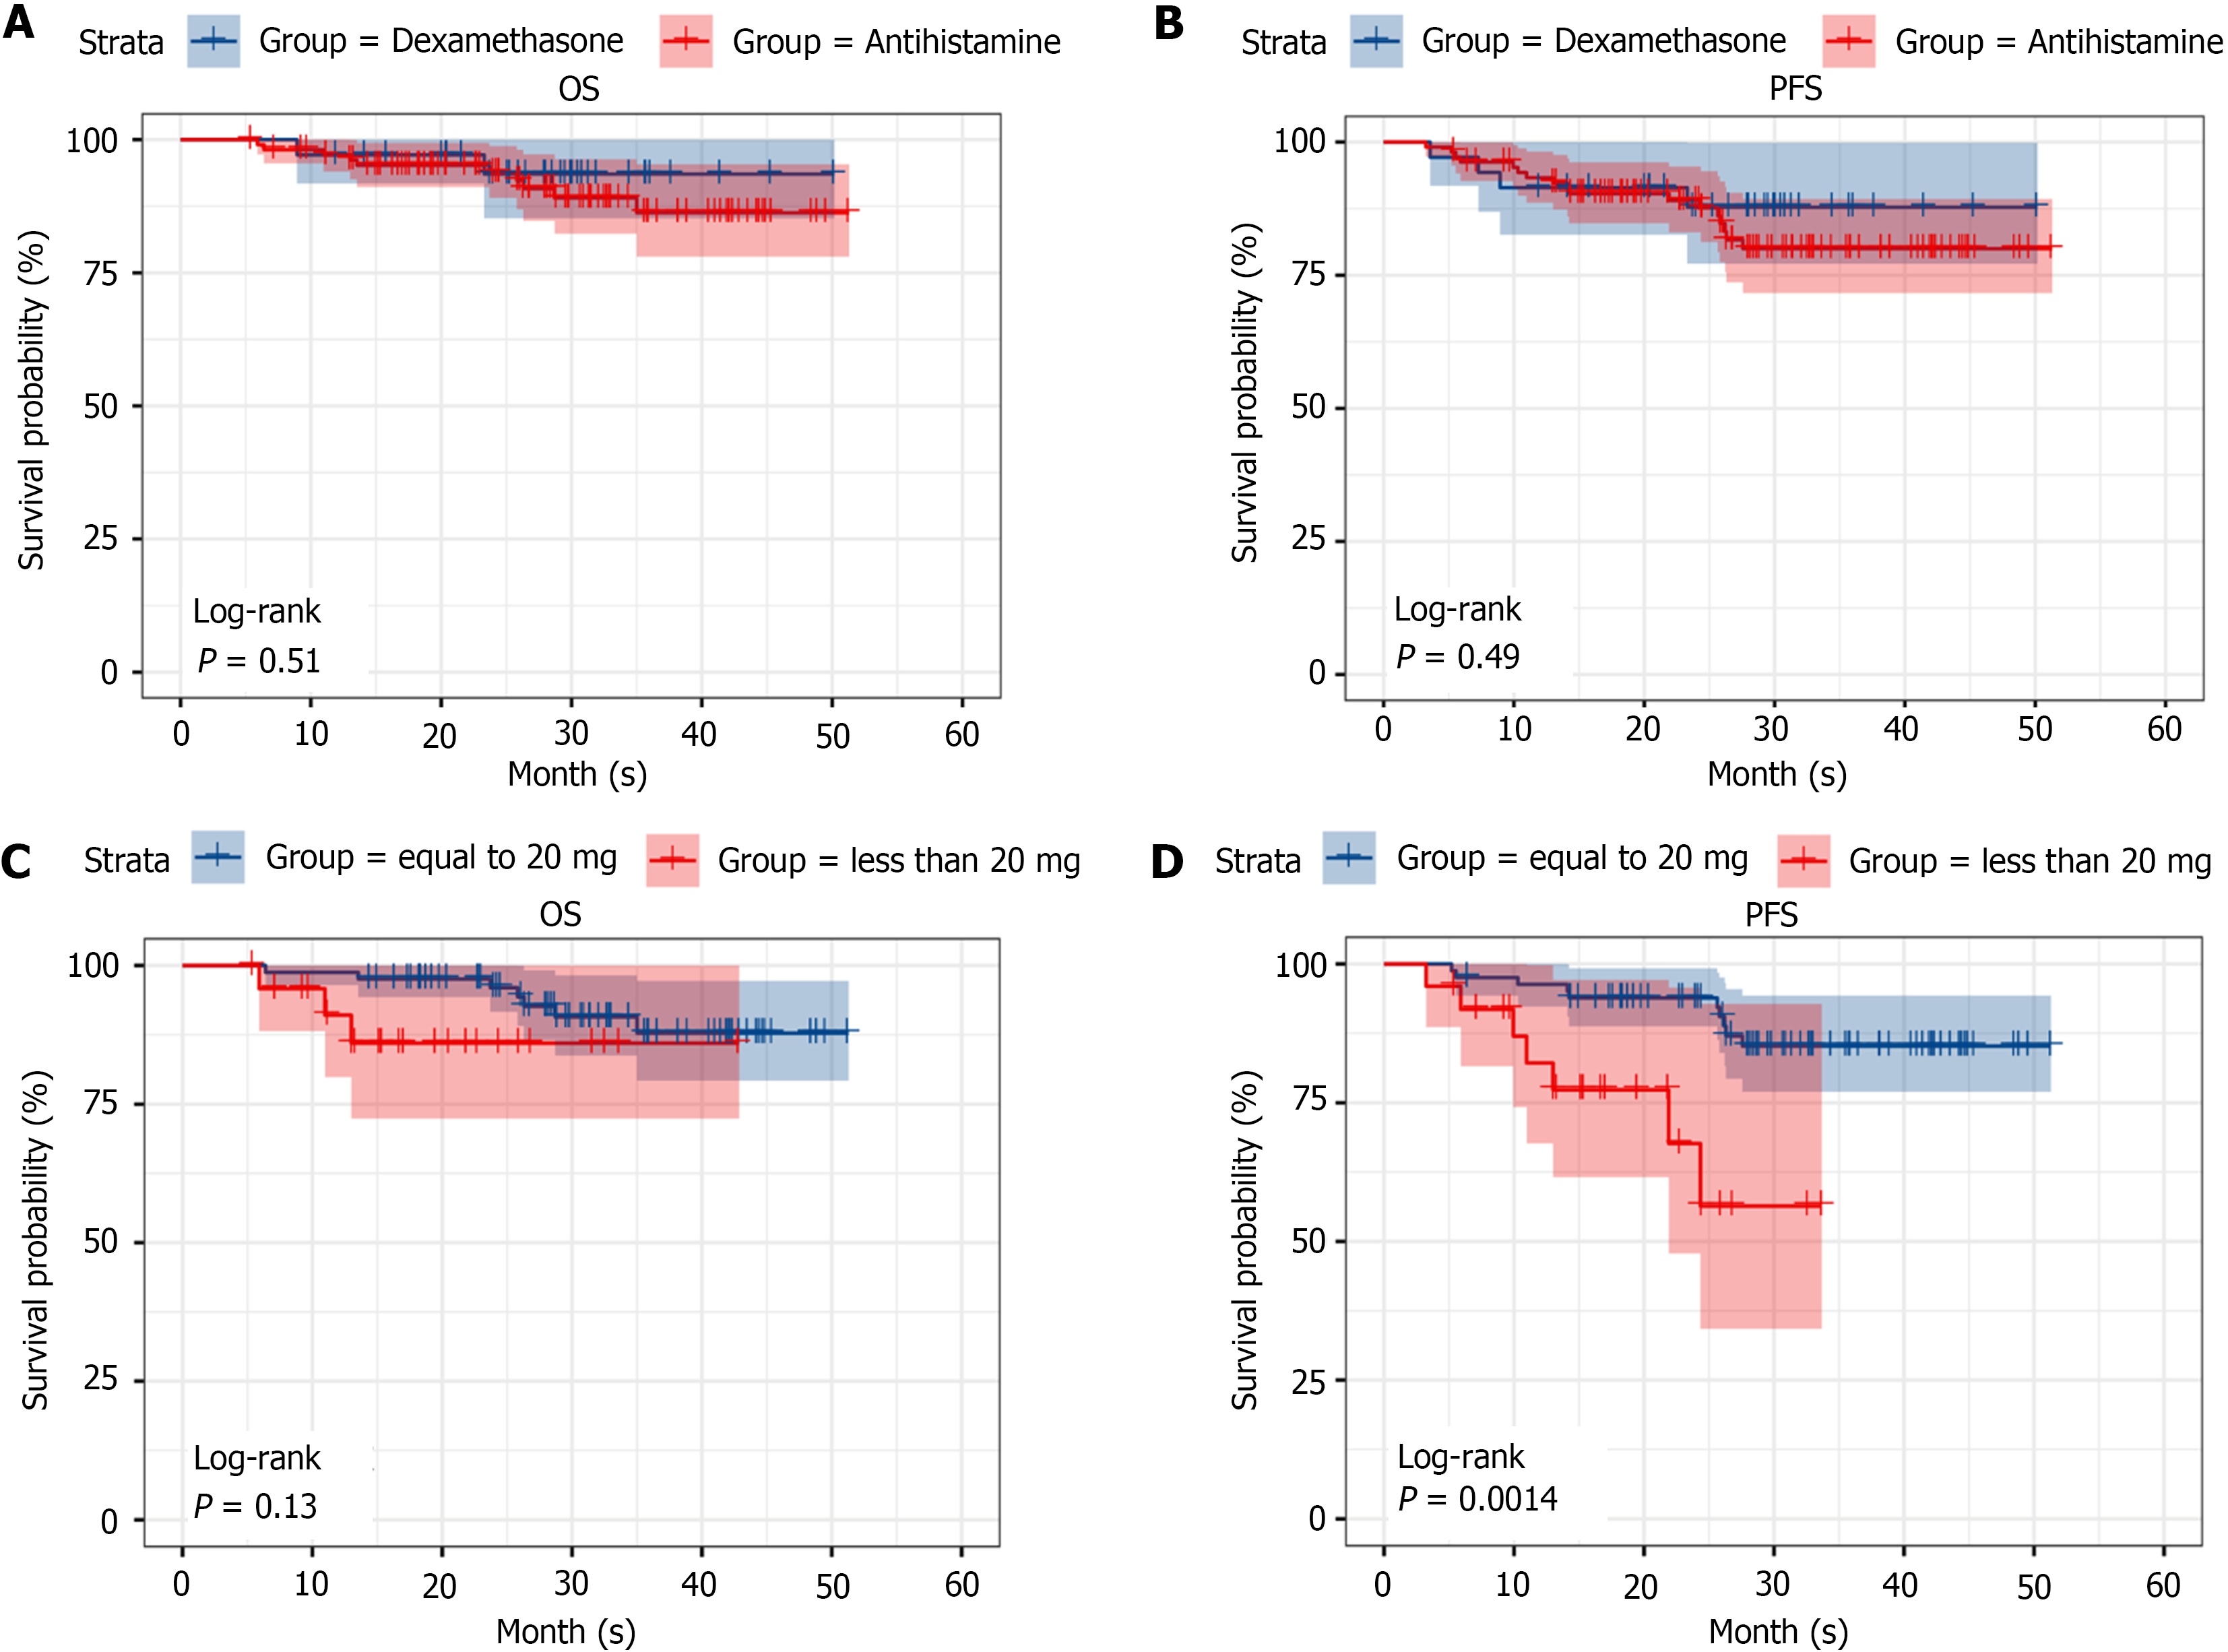
Figure 5 Long-term efficacy assessment.
A: Comparison of overall survival (OS) between the dexamethasone and antihistamine groups. The log-rank test P value is 0.51, indicating no statistically significant difference in OS between the two groups; B: Comparison of progression-free survival (PFS) between the dexamethasone and antihistamine groups. The log-rank test P value is 0.49, indicating no statistically significant difference in PFS between the two groups; C: Comparison of OS between the < 20 mg dexamethasone group and the 20 mg dexamethasone group. The log-rank test P value is 0.13, indicating no statistically significant difference in OS between the two groups; D: Comparison of PFS between the < 20 mg dexamethasone group and the 20 mg dexamethasone group. The log-rank test P value is 0.0014, indicating a statistically significant difference in PFS between the two dosage groups, suggesting that 20 mg of dexamethasone may lead to better PFS outcomes. OS: Overall survival; PFS: Progression-free survival.
- Citation: Huang YH, Yang GZ, Chen HG, Li XJ, Wu YH, Zhang K, Xu JN, Zhang J. Impact of baseline steroids on the efficacy of neoadjuvant immunochemotherapy in locally advanced esophageal squamous cell carcinoma. World J Gastrointest Oncol 2024; 16(9): 3887-3897
- URL: https://www.wjgnet.com/1948-5204/full/v16/i9/3887.htm
- DOI: https://dx.doi.org/10.4251/wjgo.v16.i9.3887


