Copyright
©The Author(s) 2024.
World J Gastrointest Oncol. Sep 15, 2024; 16(9): 3875-3886
Published online Sep 15, 2024. doi: 10.4251/wjgo.v16.i9.3875
Published online Sep 15, 2024. doi: 10.4251/wjgo.v16.i9.3875
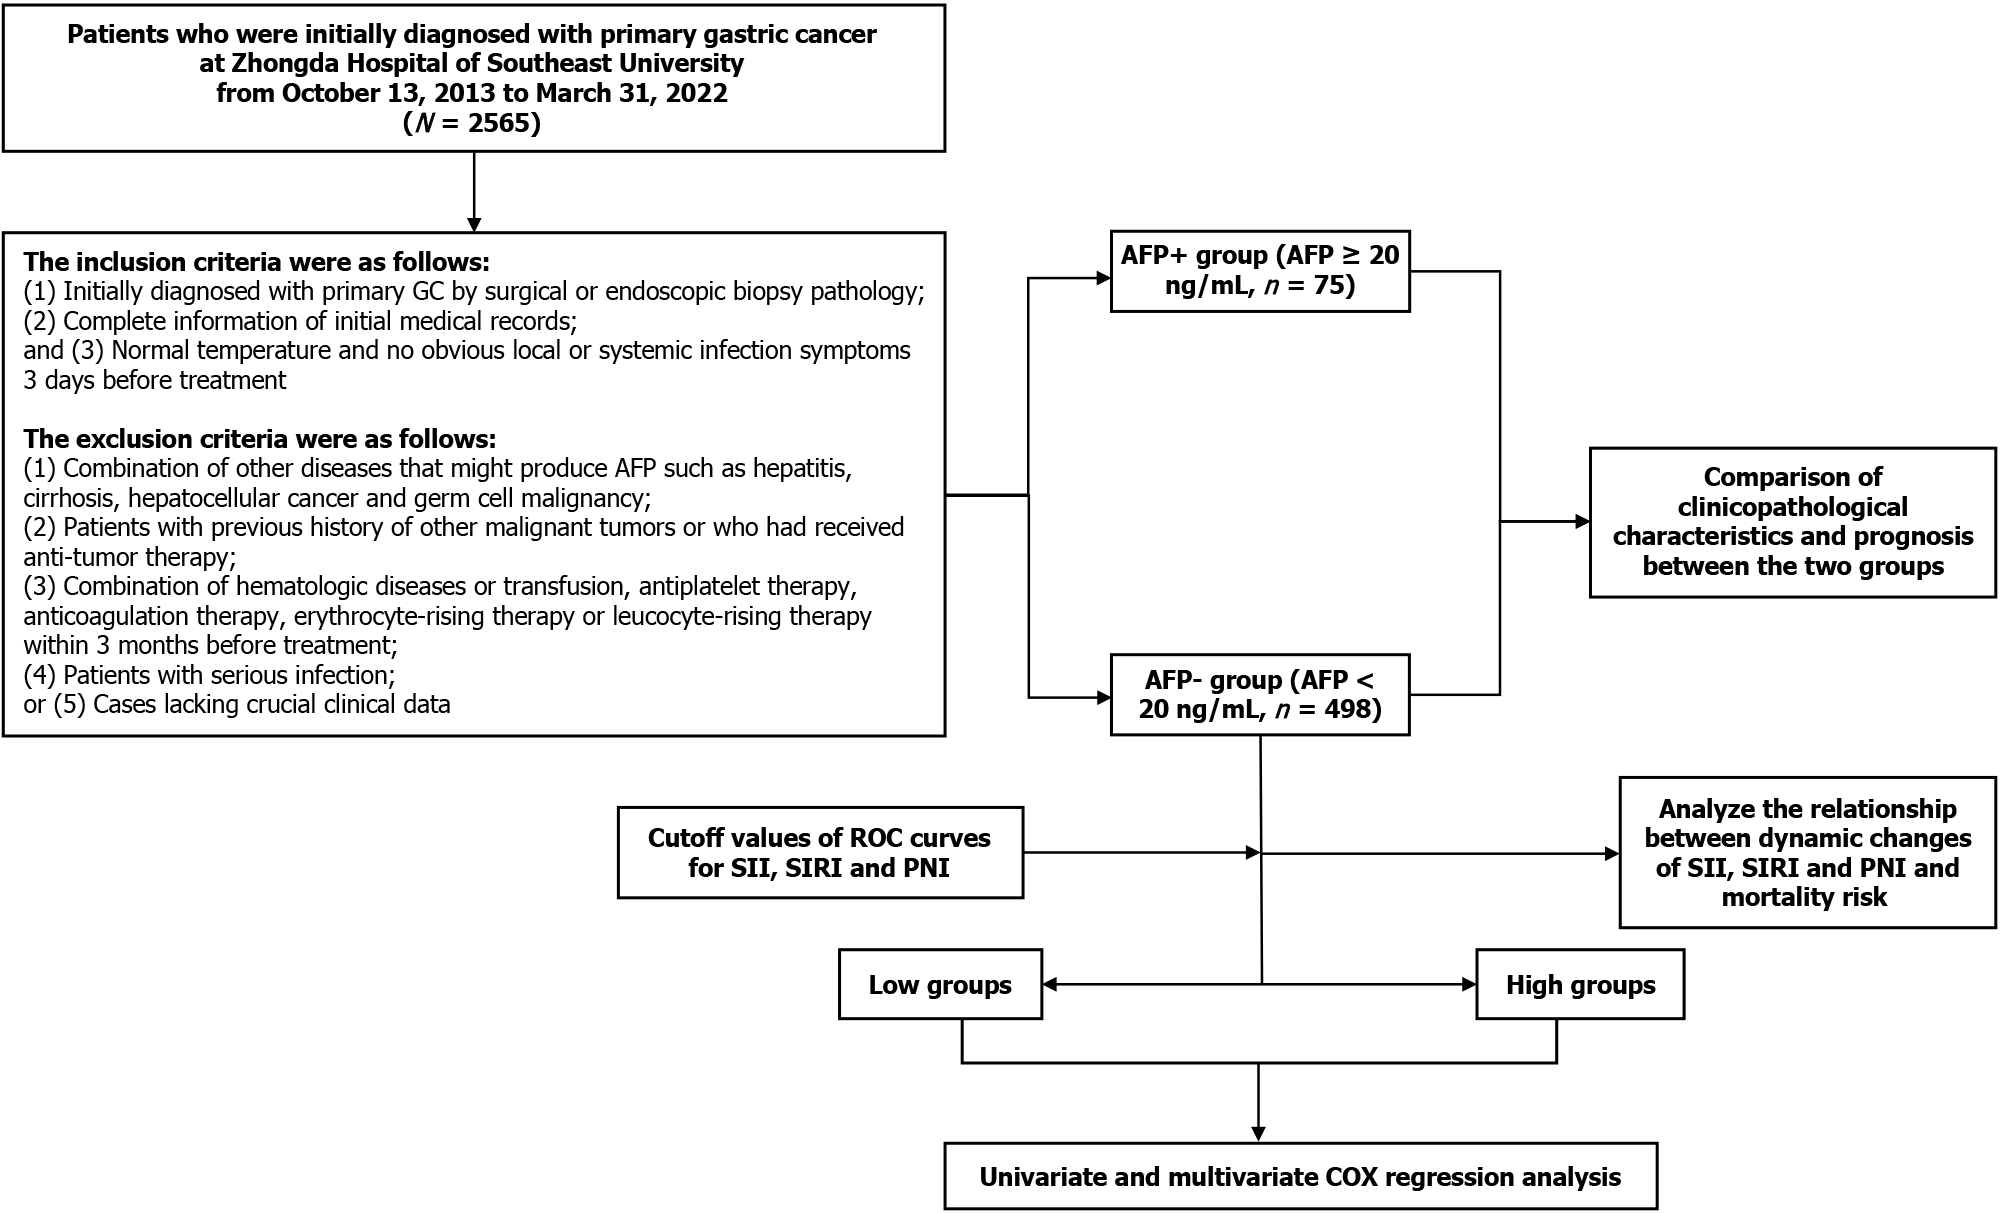
Figure 1 The flowchart of the study.
AFP: Alpha-fetoprotein; GC: Gastric cancer; PNI: Prognostic nutritional index; ROC: Receiver operating characteristic; SII: Systemic immune-inflammation index; SIRI: Systemic inflammation response index.
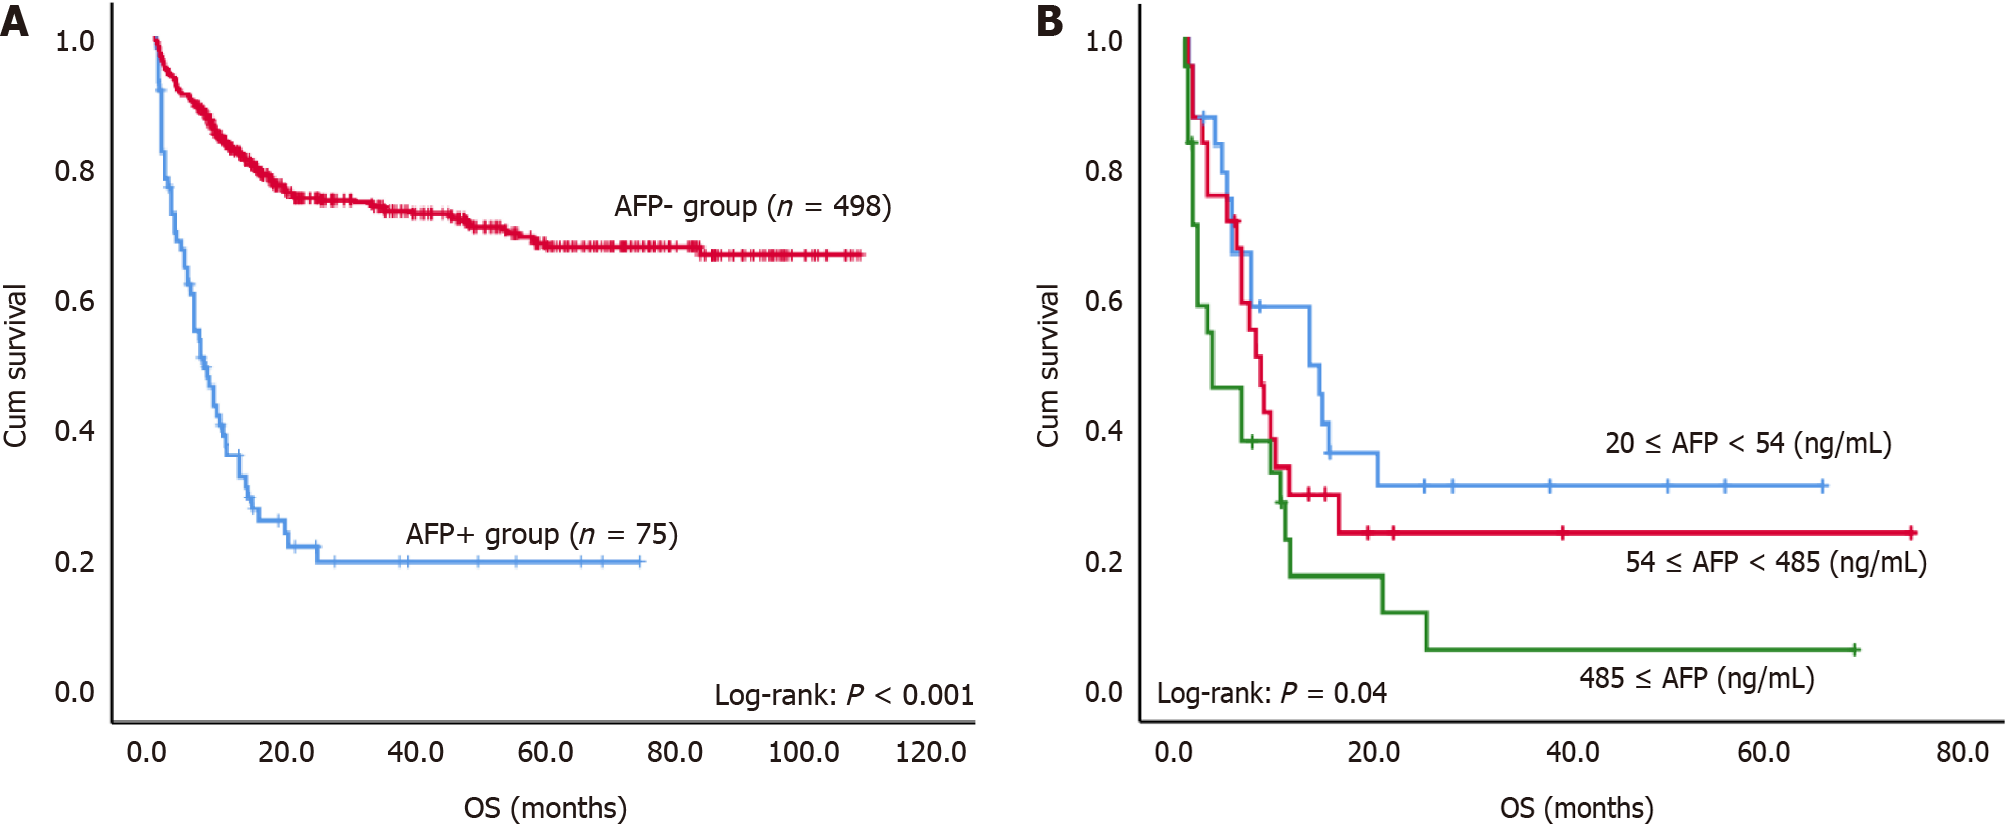
Figure 2 Kaplan-Meier survival curves.
A: Kaplan-Meier survival curves for patients in the alpha-fetoprotein (AFP)+ and the AFP- groups. B: Kaplan-Meier survival curves in groups of different AFP levels. AFP: Alpha-fetoprotein.
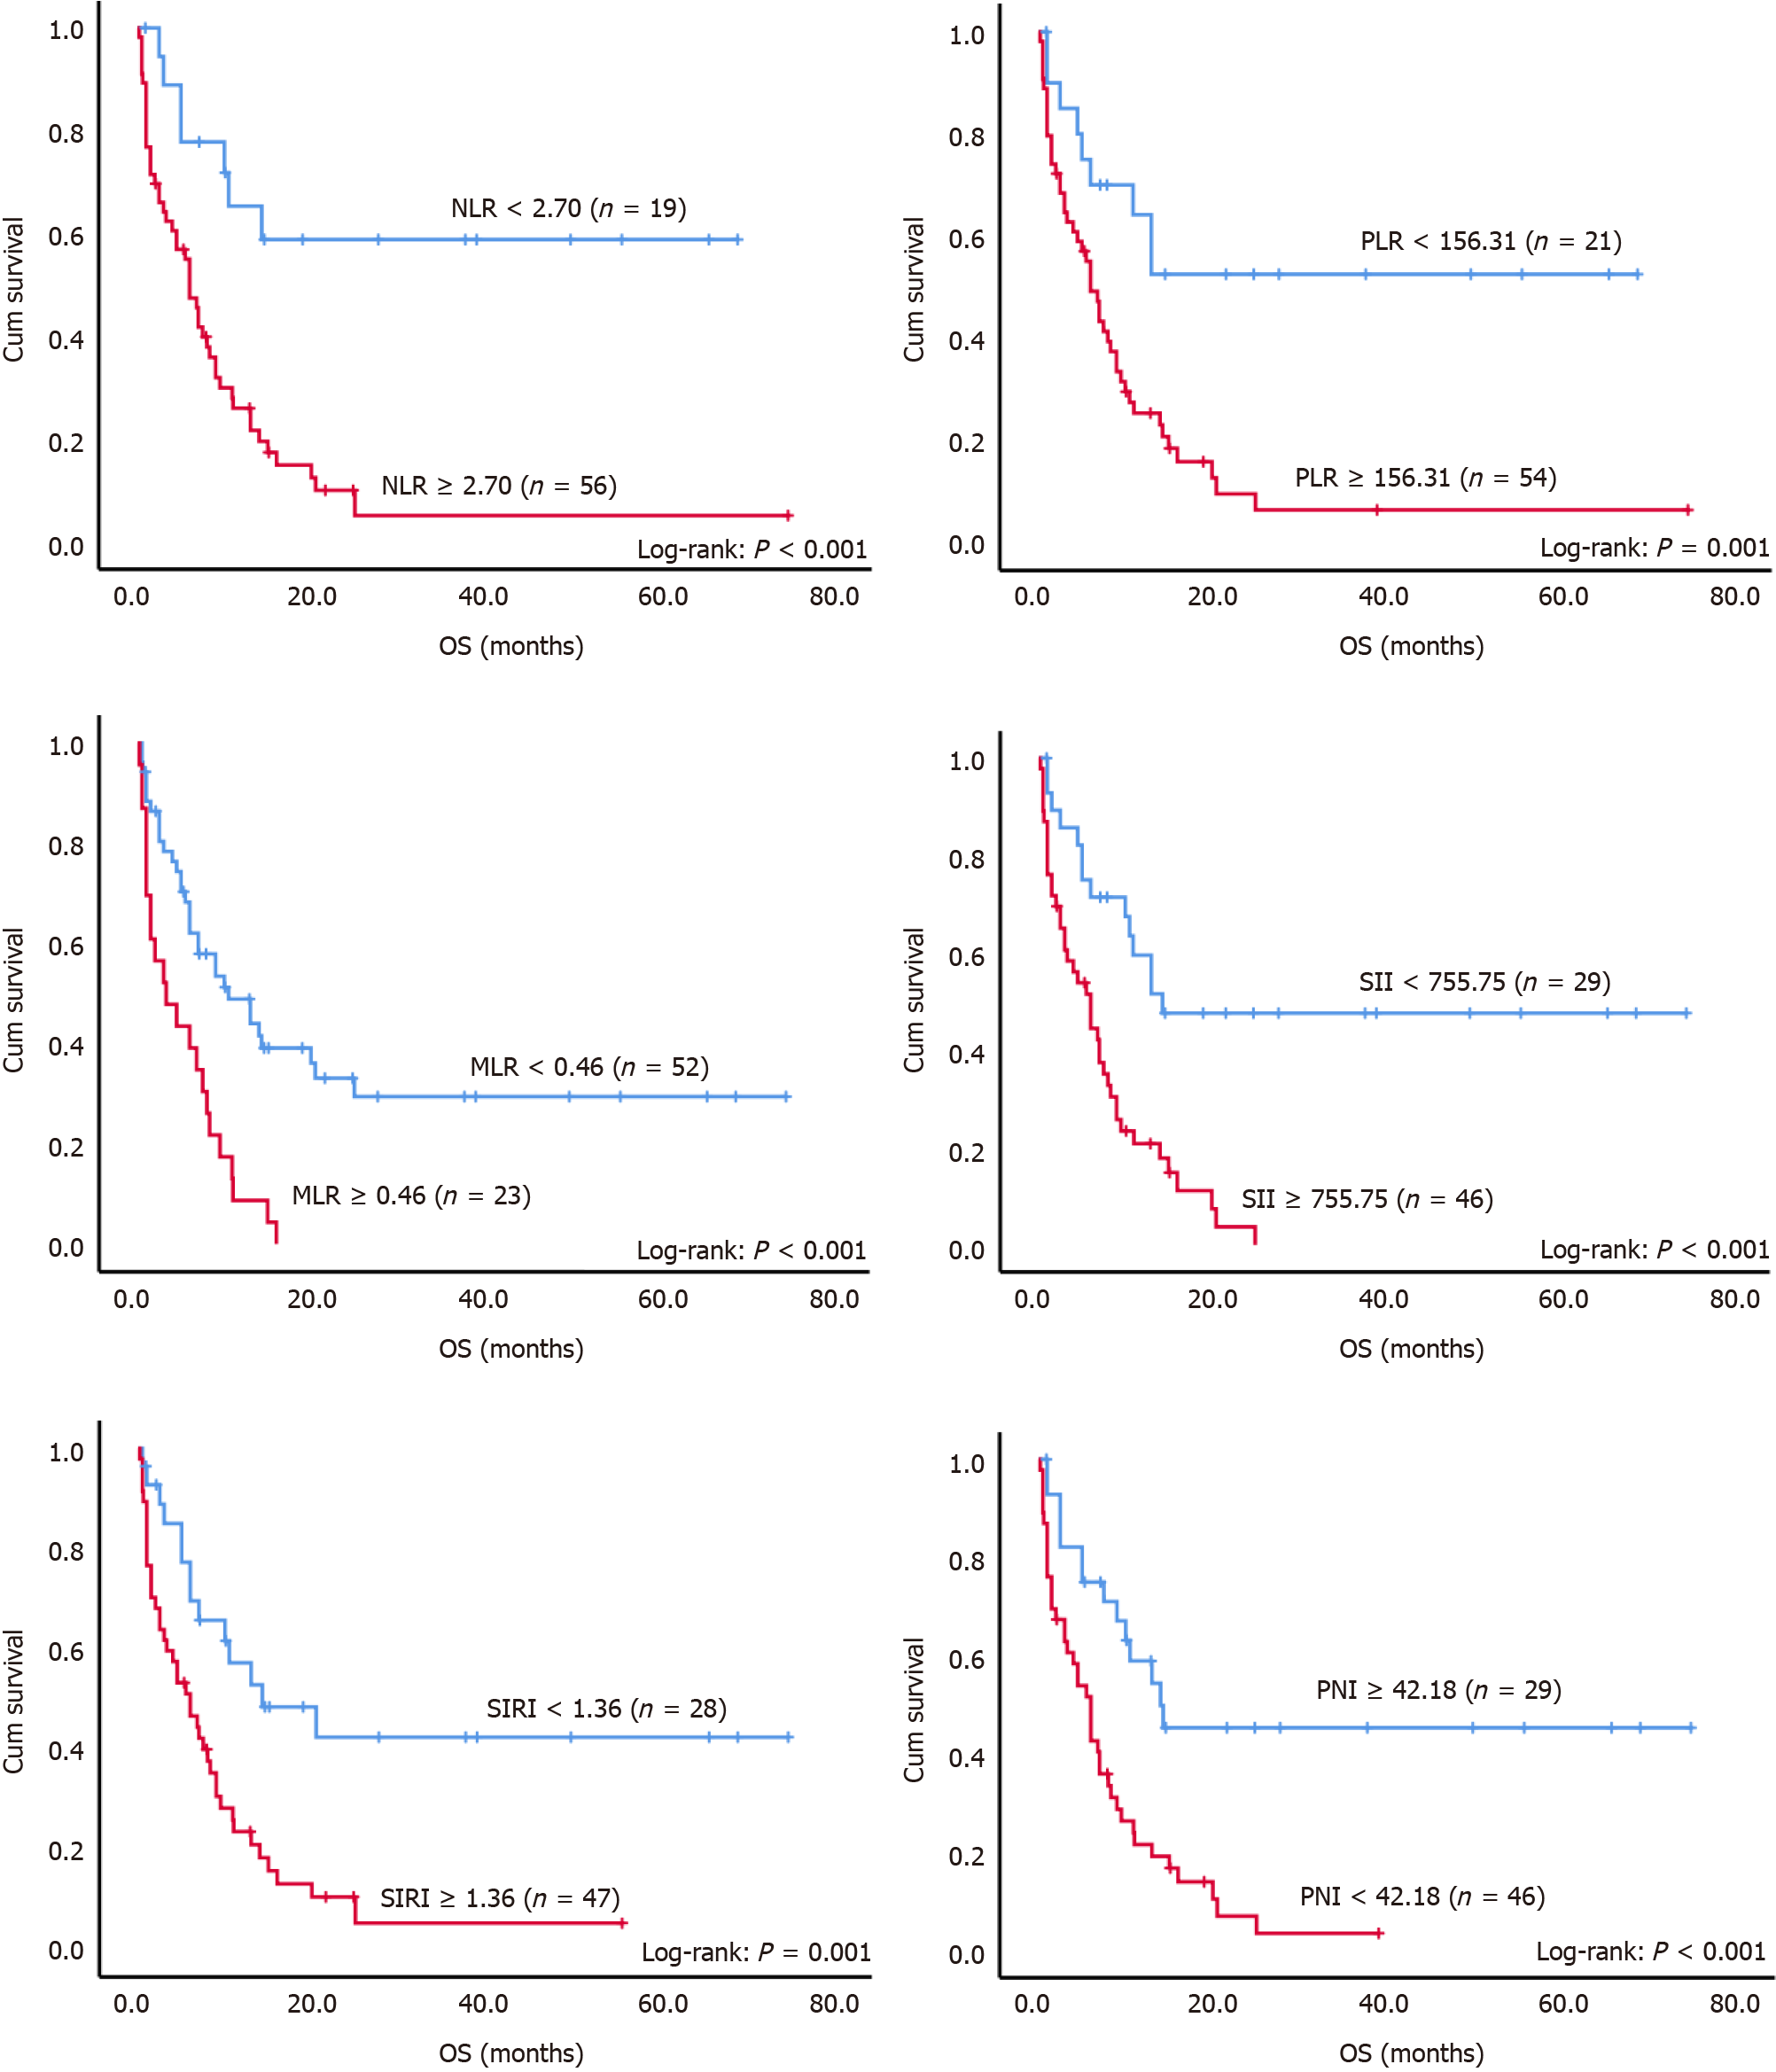
Figure 3 Kaplan-Meier survival curves for alpha-fetoprotein+ patients with different levels of inflammation-related peripheral blood markers.
The cut-off values of neutrophil-to-lymphocyte ratio (NLR), platelet-to-lymphocyte ratio (PLR), monocyte-to-lymphocyte ratio (MLR), systemic immune-inflammation index (SII), systemic inflammation response index (SIRI) and prognostic nutritional index (PNI) were 270, 156.31, 0.46, 755.75, 1.36 and 42.18, respectively. NLR < 2.70 (n = 19); NLR ≥ 2.70 (n = 56); Log-Rank: P < 0.001; PLR < 156.31 (n = 21); PLR ≥ 156.31 (n = 54); Log-Rank: P = 0.001; MLR < 0.46 (n = 52); MLR ≥ 0.46 (n = 23); Log-Rank: P < 0.001; SII < 755.75 (n = 29); SII ≥ 755.75 (n = 46); Log-Rank P < 0.001; SIRI < 1.36 (n = 28); SIRI ≥ 1.36 (n = 47); Log-Rank: P = 0.001; PNI < 42.18 (n = 46); PLR ≥ 42.18 (n = 29); Log-Rank P < 0.001. AFP: Alpha-fetoprotein; GC: Gastric cancer; PNI: Prognostic nutritional index; ROC: Receiver operating characteristic; SII: Systemic immune-inflammation index; SIRI: Systemic inflammation response index.
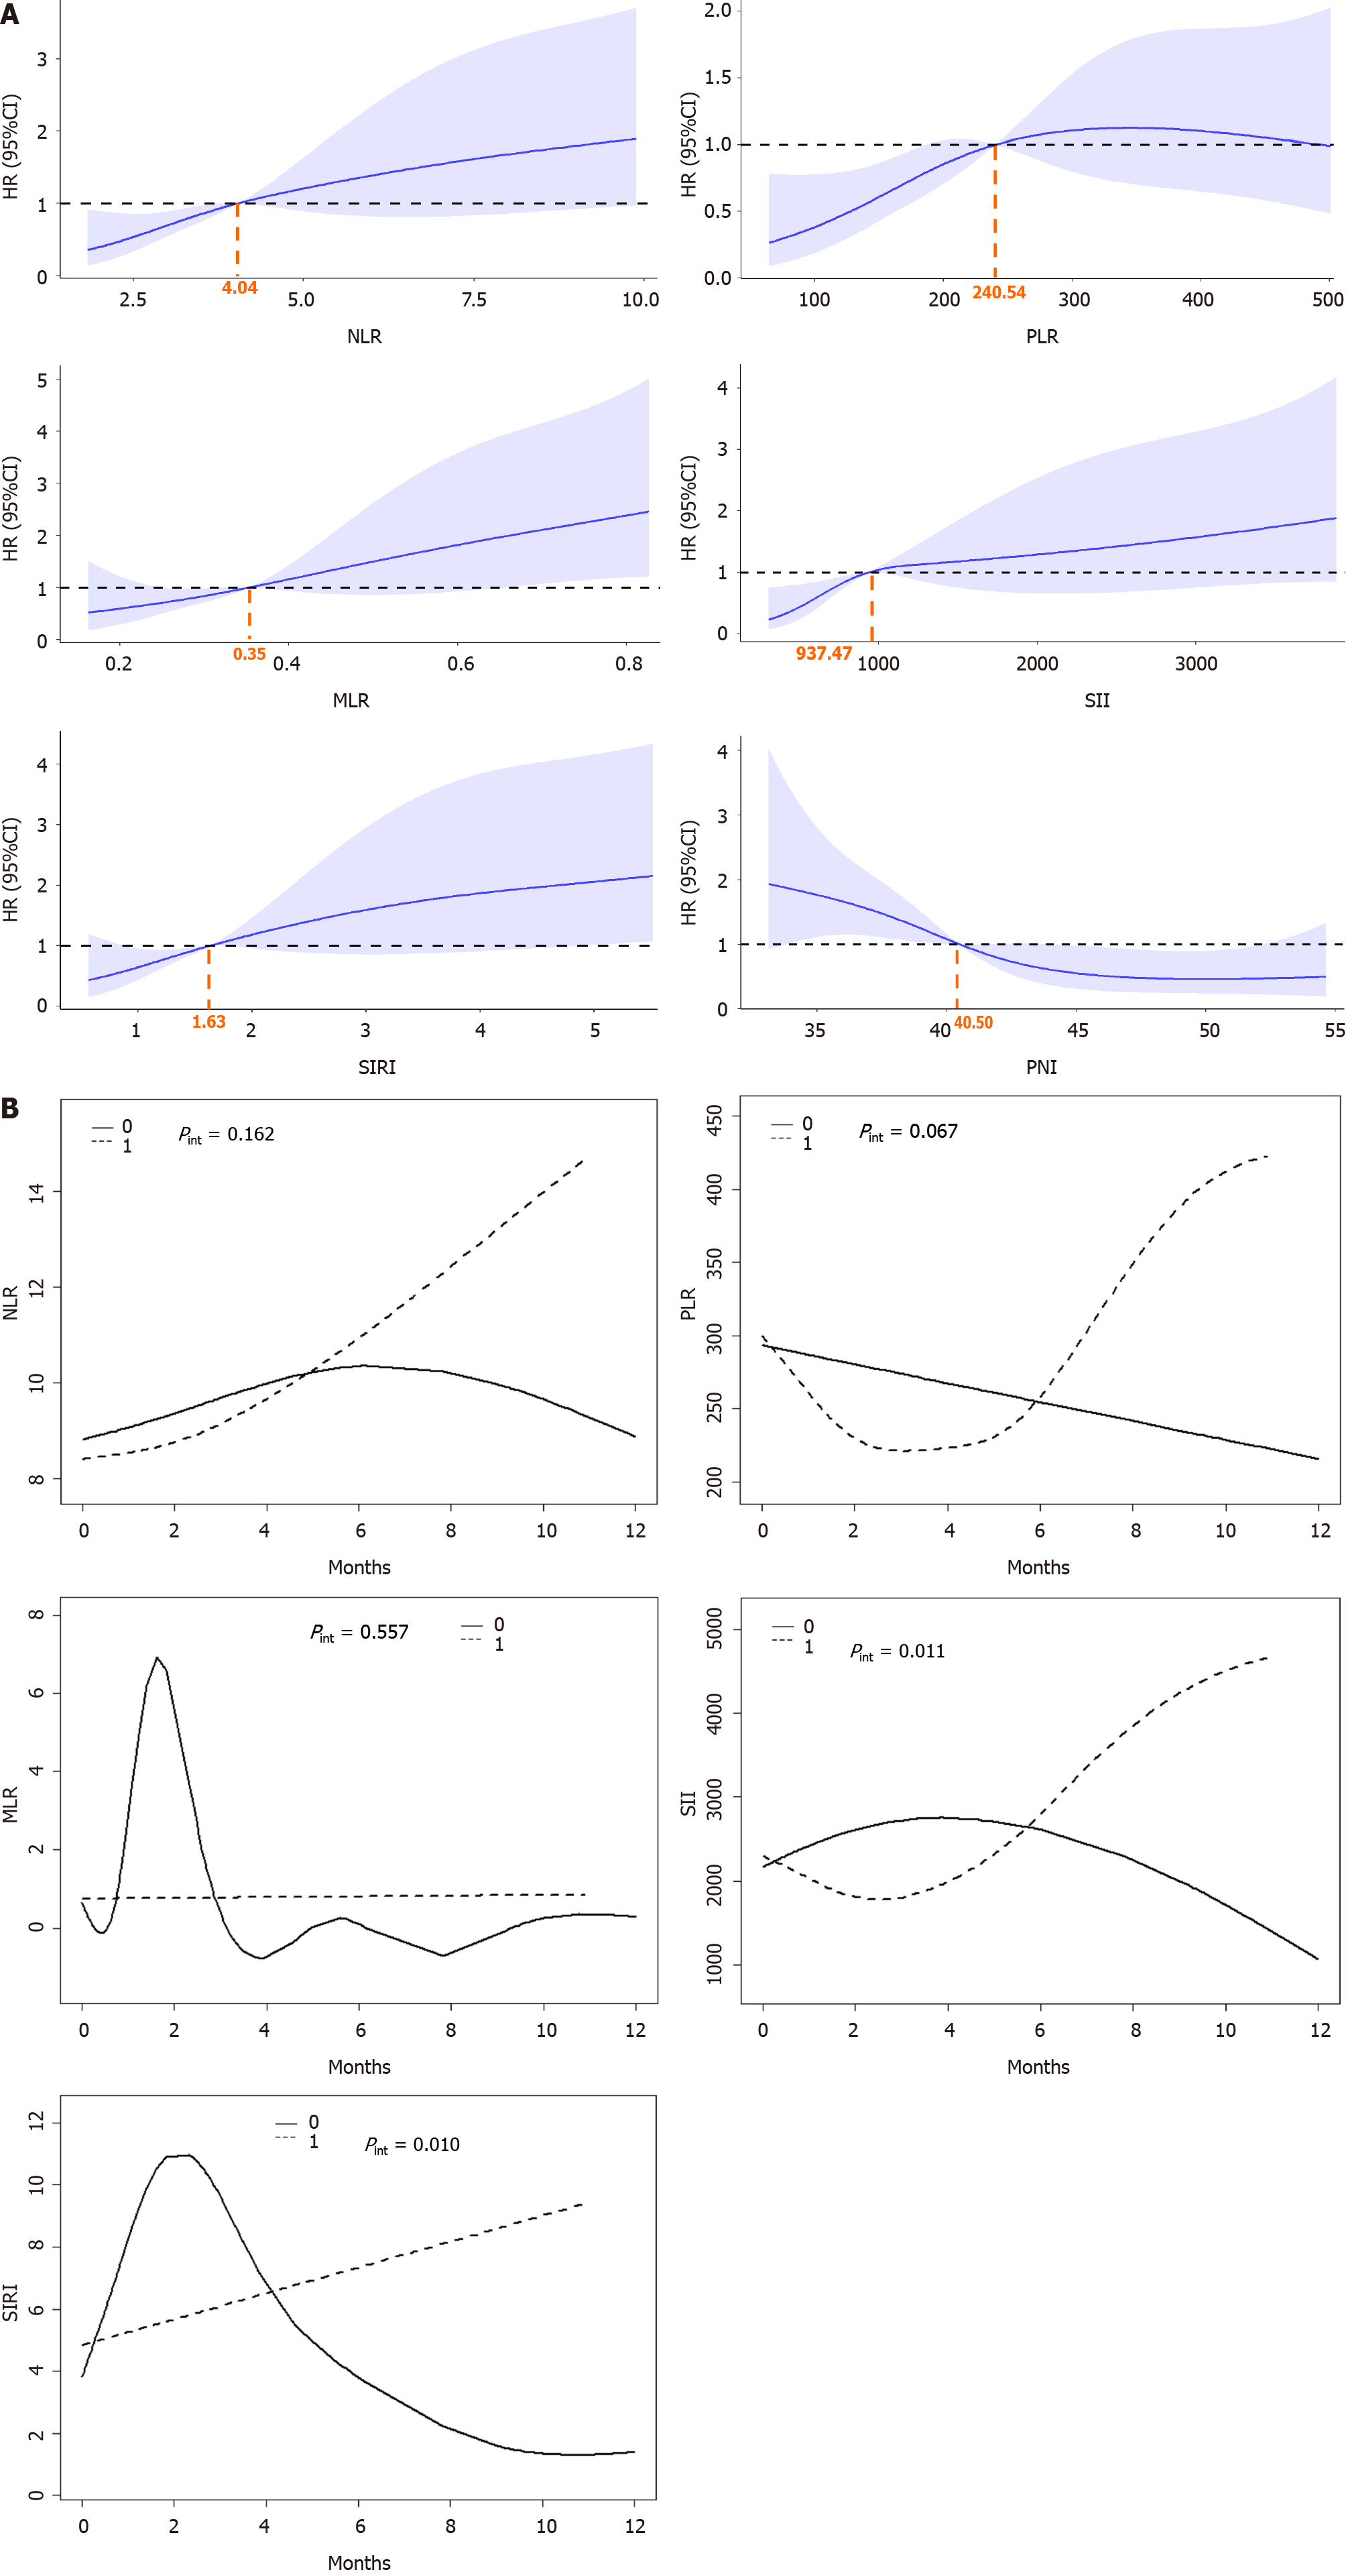
Figure 4 Analysis of the relationship between these inflammatory indicators as continuous variables and death.
A: Restricted cubic spline (RCS) of six inflammation-related peripheral blood markers. The orange numbers were the corresponding values of each inflammatory indicator when hazard ratio equaled 1; B: Generalized additive mixed model (GAMMs) of six inflammation-related peripheral blood markers in survival group and death group. The RCS and GAMMs corrected age, sex, tumor location, tumor size, differentiation, lymphatic metastasis, liver metastasis, extrhepatic metastasis, time of liver metastasis, tumor-node-metastasis stage, T stage, N stage, vascular invasion and nerve invasion. In figure B, “0”, “1” and “Pint” referred to “survival group”, “death group” and “Pinteraction”, respectively. AFP: Alpha-fetoprotein; GC: Gastric cancer; PNI: Prognostic nutritional index; ROC: Receiver operating characteristic; SII: Systemic immune-inflammation index; SIRI: Systemic inflammation response index.
- Citation: Zhang L, Chen YP, Ji M, Ying LQ, Huang CC, Zhou JY, Liu L. Inflammation-related markers and prognosis of alpha-fetoprotein producing gastric cancer. World J Gastrointest Oncol 2024; 16(9): 3875-3886
- URL: https://www.wjgnet.com/1948-5204/full/v16/i9/3875.htm
- DOI: https://dx.doi.org/10.4251/wjgo.v16.i9.3875


