Copyright
©The Author(s) 2024.
World J Gastrointest Oncol. Sep 15, 2024; 16(9): 3839-3850
Published online Sep 15, 2024. doi: 10.4251/wjgo.v16.i9.3839
Published online Sep 15, 2024. doi: 10.4251/wjgo.v16.i9.3839
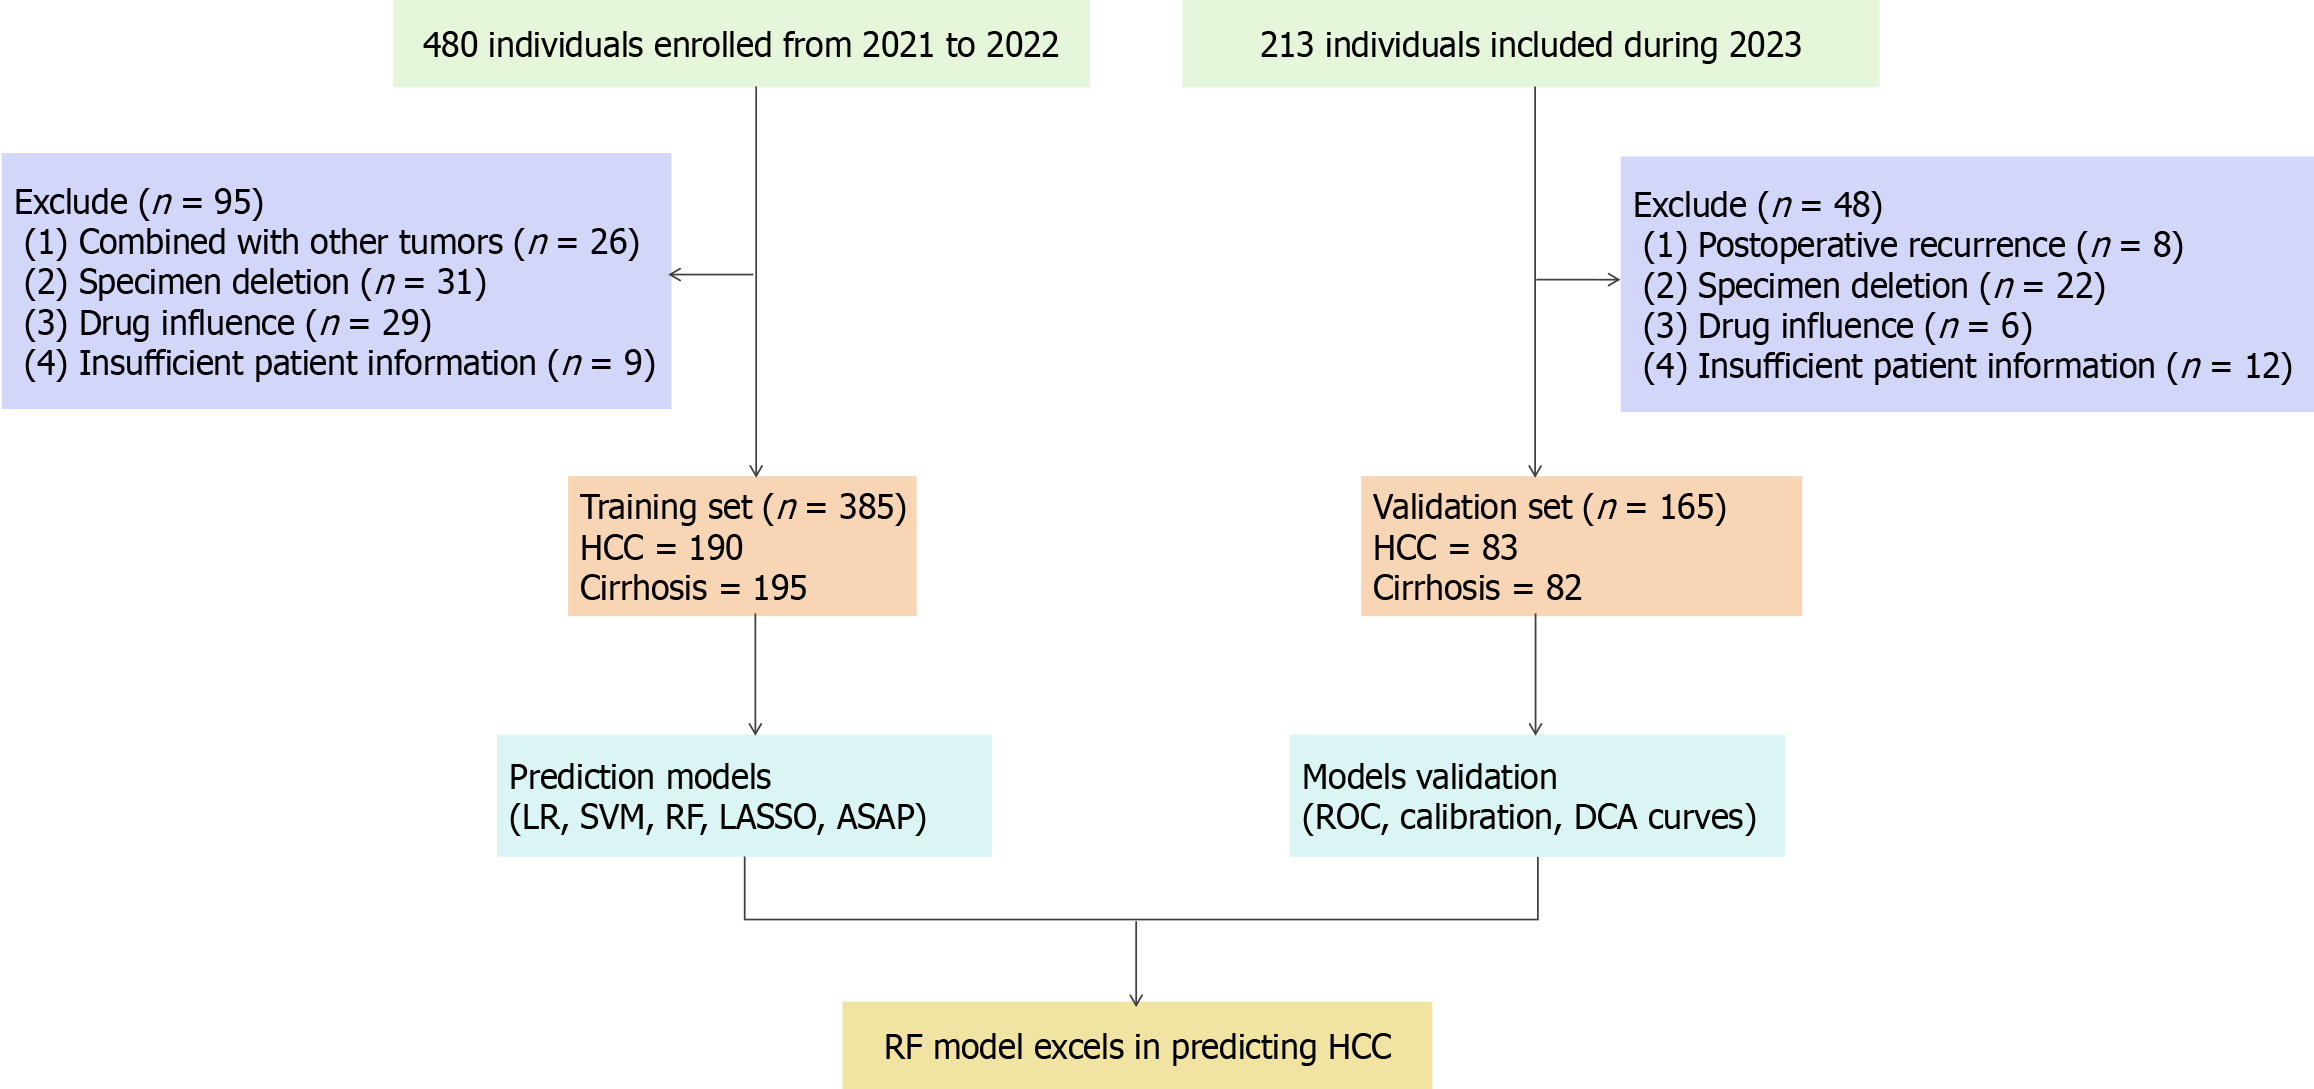
Figure 1 Study design.
HCC: Hepatocellular carcinoma; LR: Logistic regression; SVM: Support vector machine; RF: Random forest; LASSO: Least absolute shrinkage and selection operator; ROC: Receiver operating characteristic; DCA: Decision curve analysis.
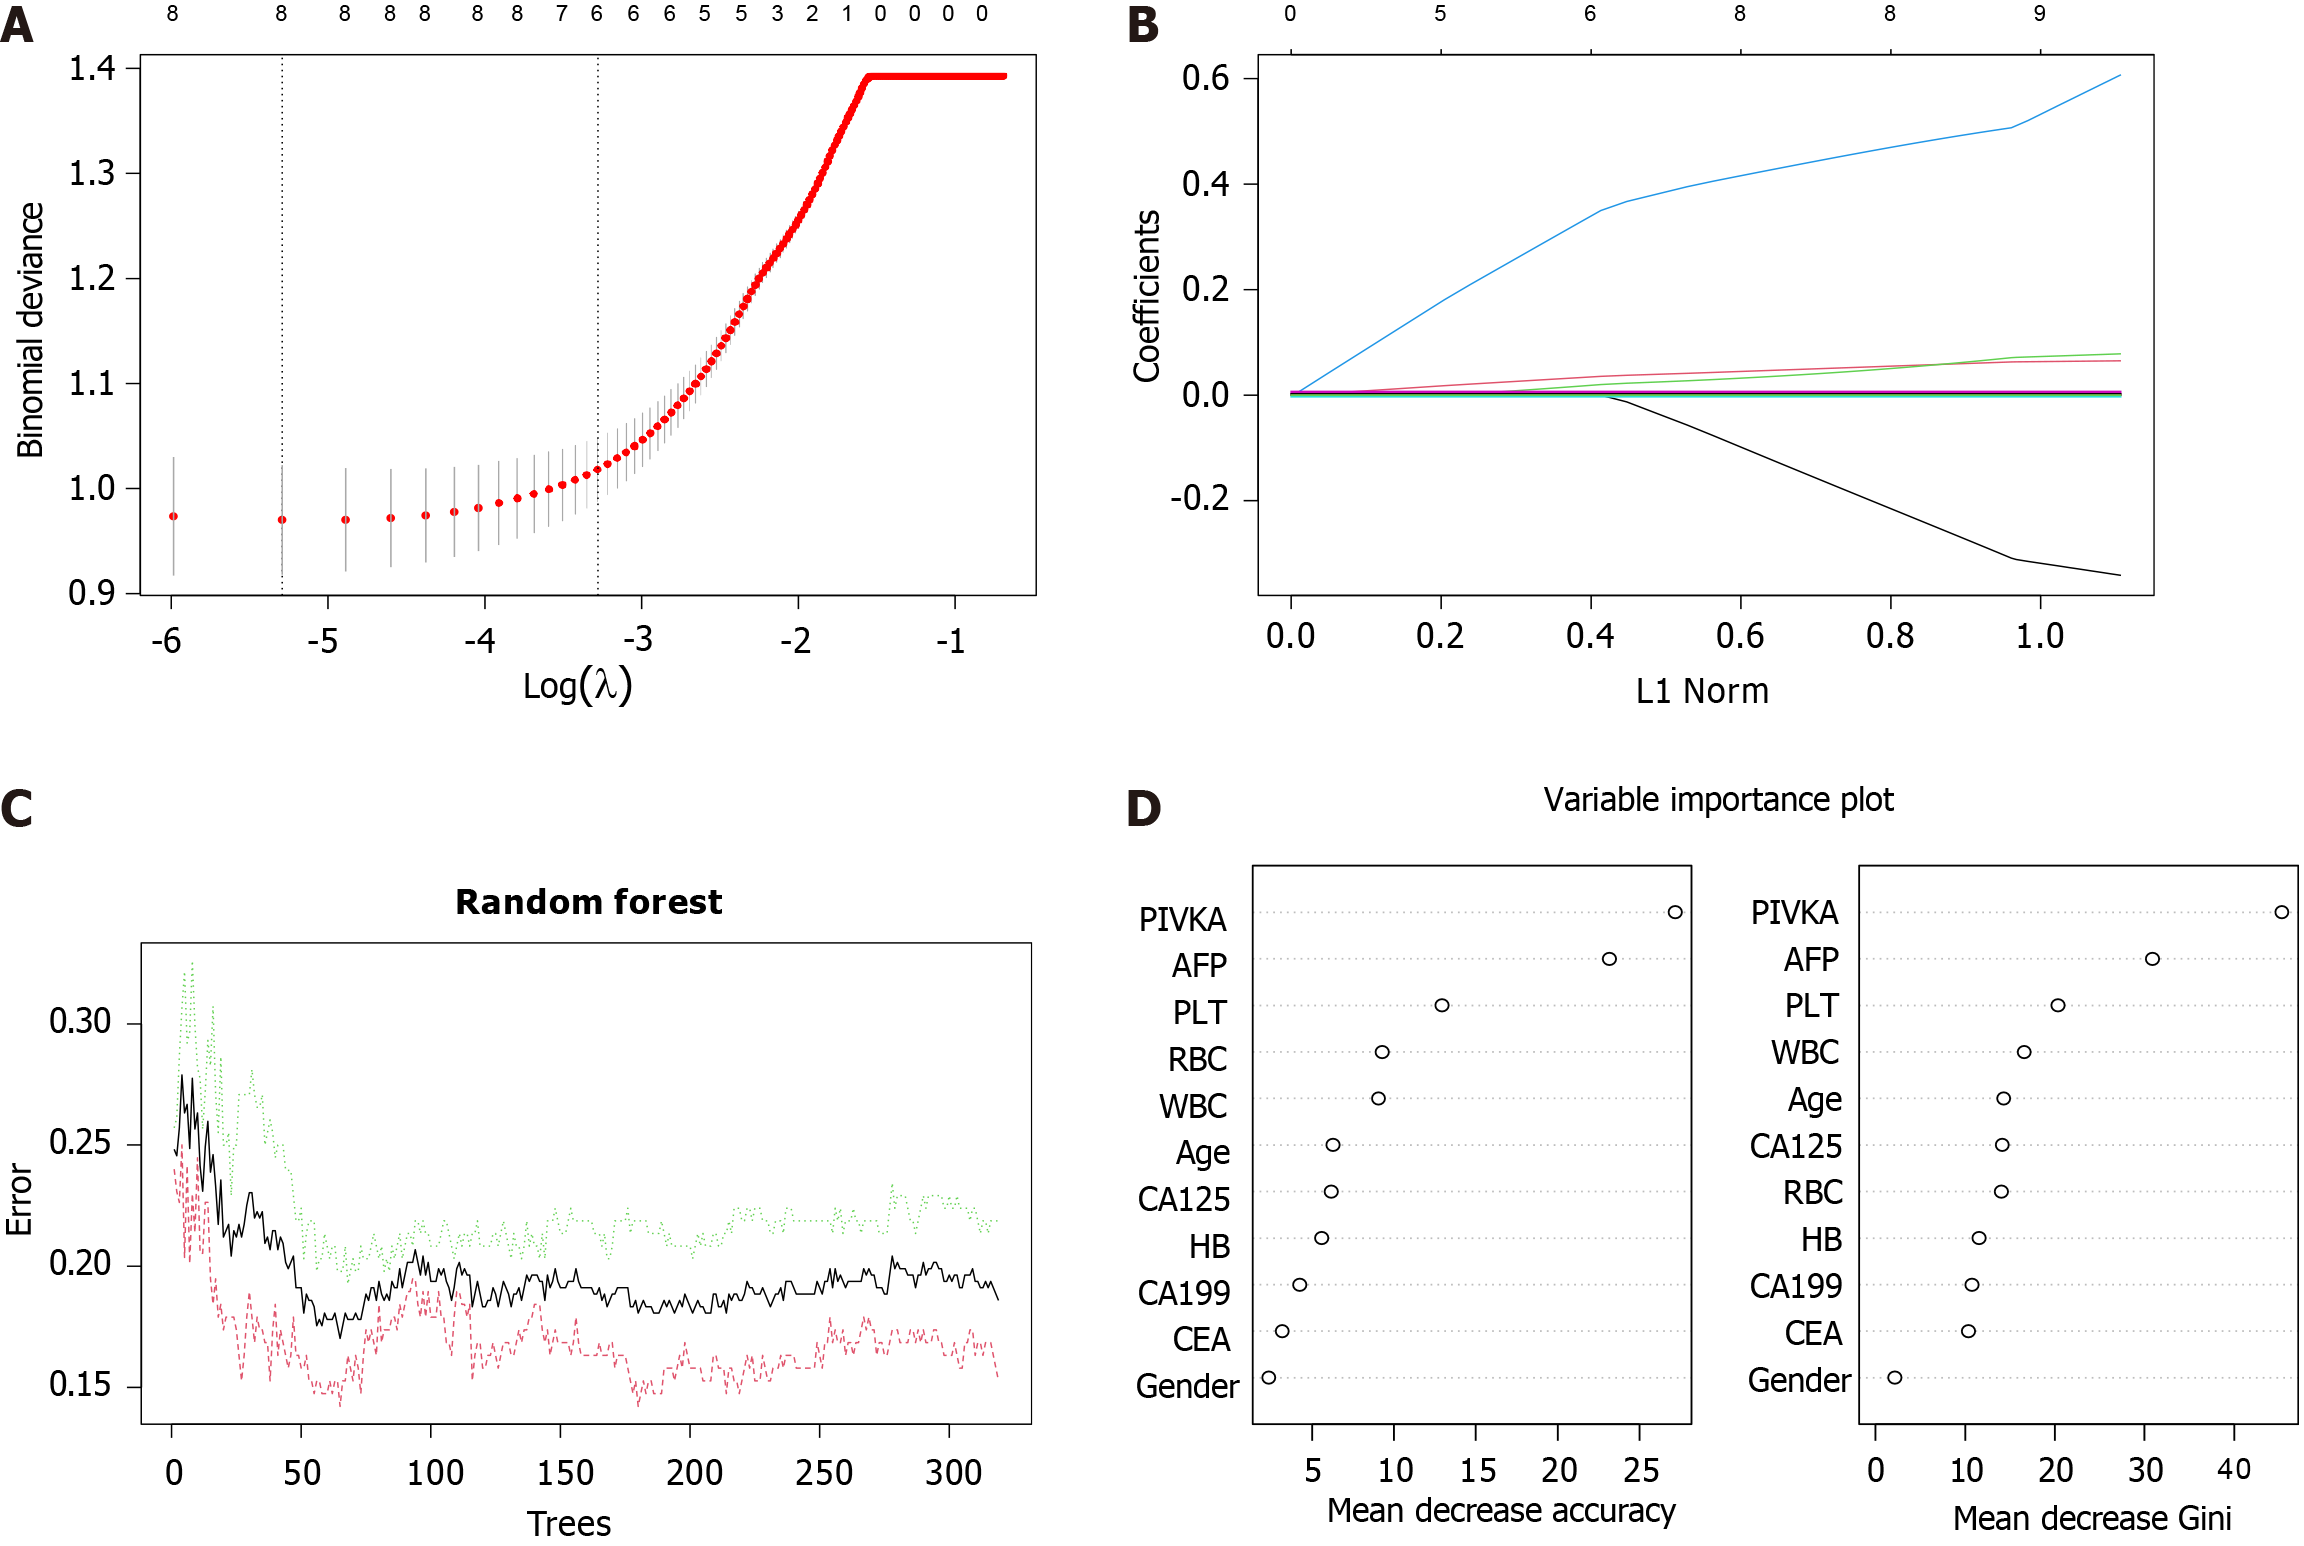
Figure 2 Revising modeling parameters in the training set.
A: Ten-fold cross-validation for tuning parameter selection in the least absolute shrinkage and selection operator (LASSO) model; B: LASSO coefficient curve of 9 variables; C: The relationship between the quantity of decision trees and the average out-of-bag evaluation; D: The ranking of variable importance based on differences in univariate analysis. WBC: White blood cell; RBC: Red blood cell; PLT: Platelet; AFP: Alpha-fetoprotein; PIVKA: Protein induced by vitamin K absence or antagonist; CA: Carbohydrate antigen; CEA: Carcinoembryonic antigen; HB: Hemoglobin level.
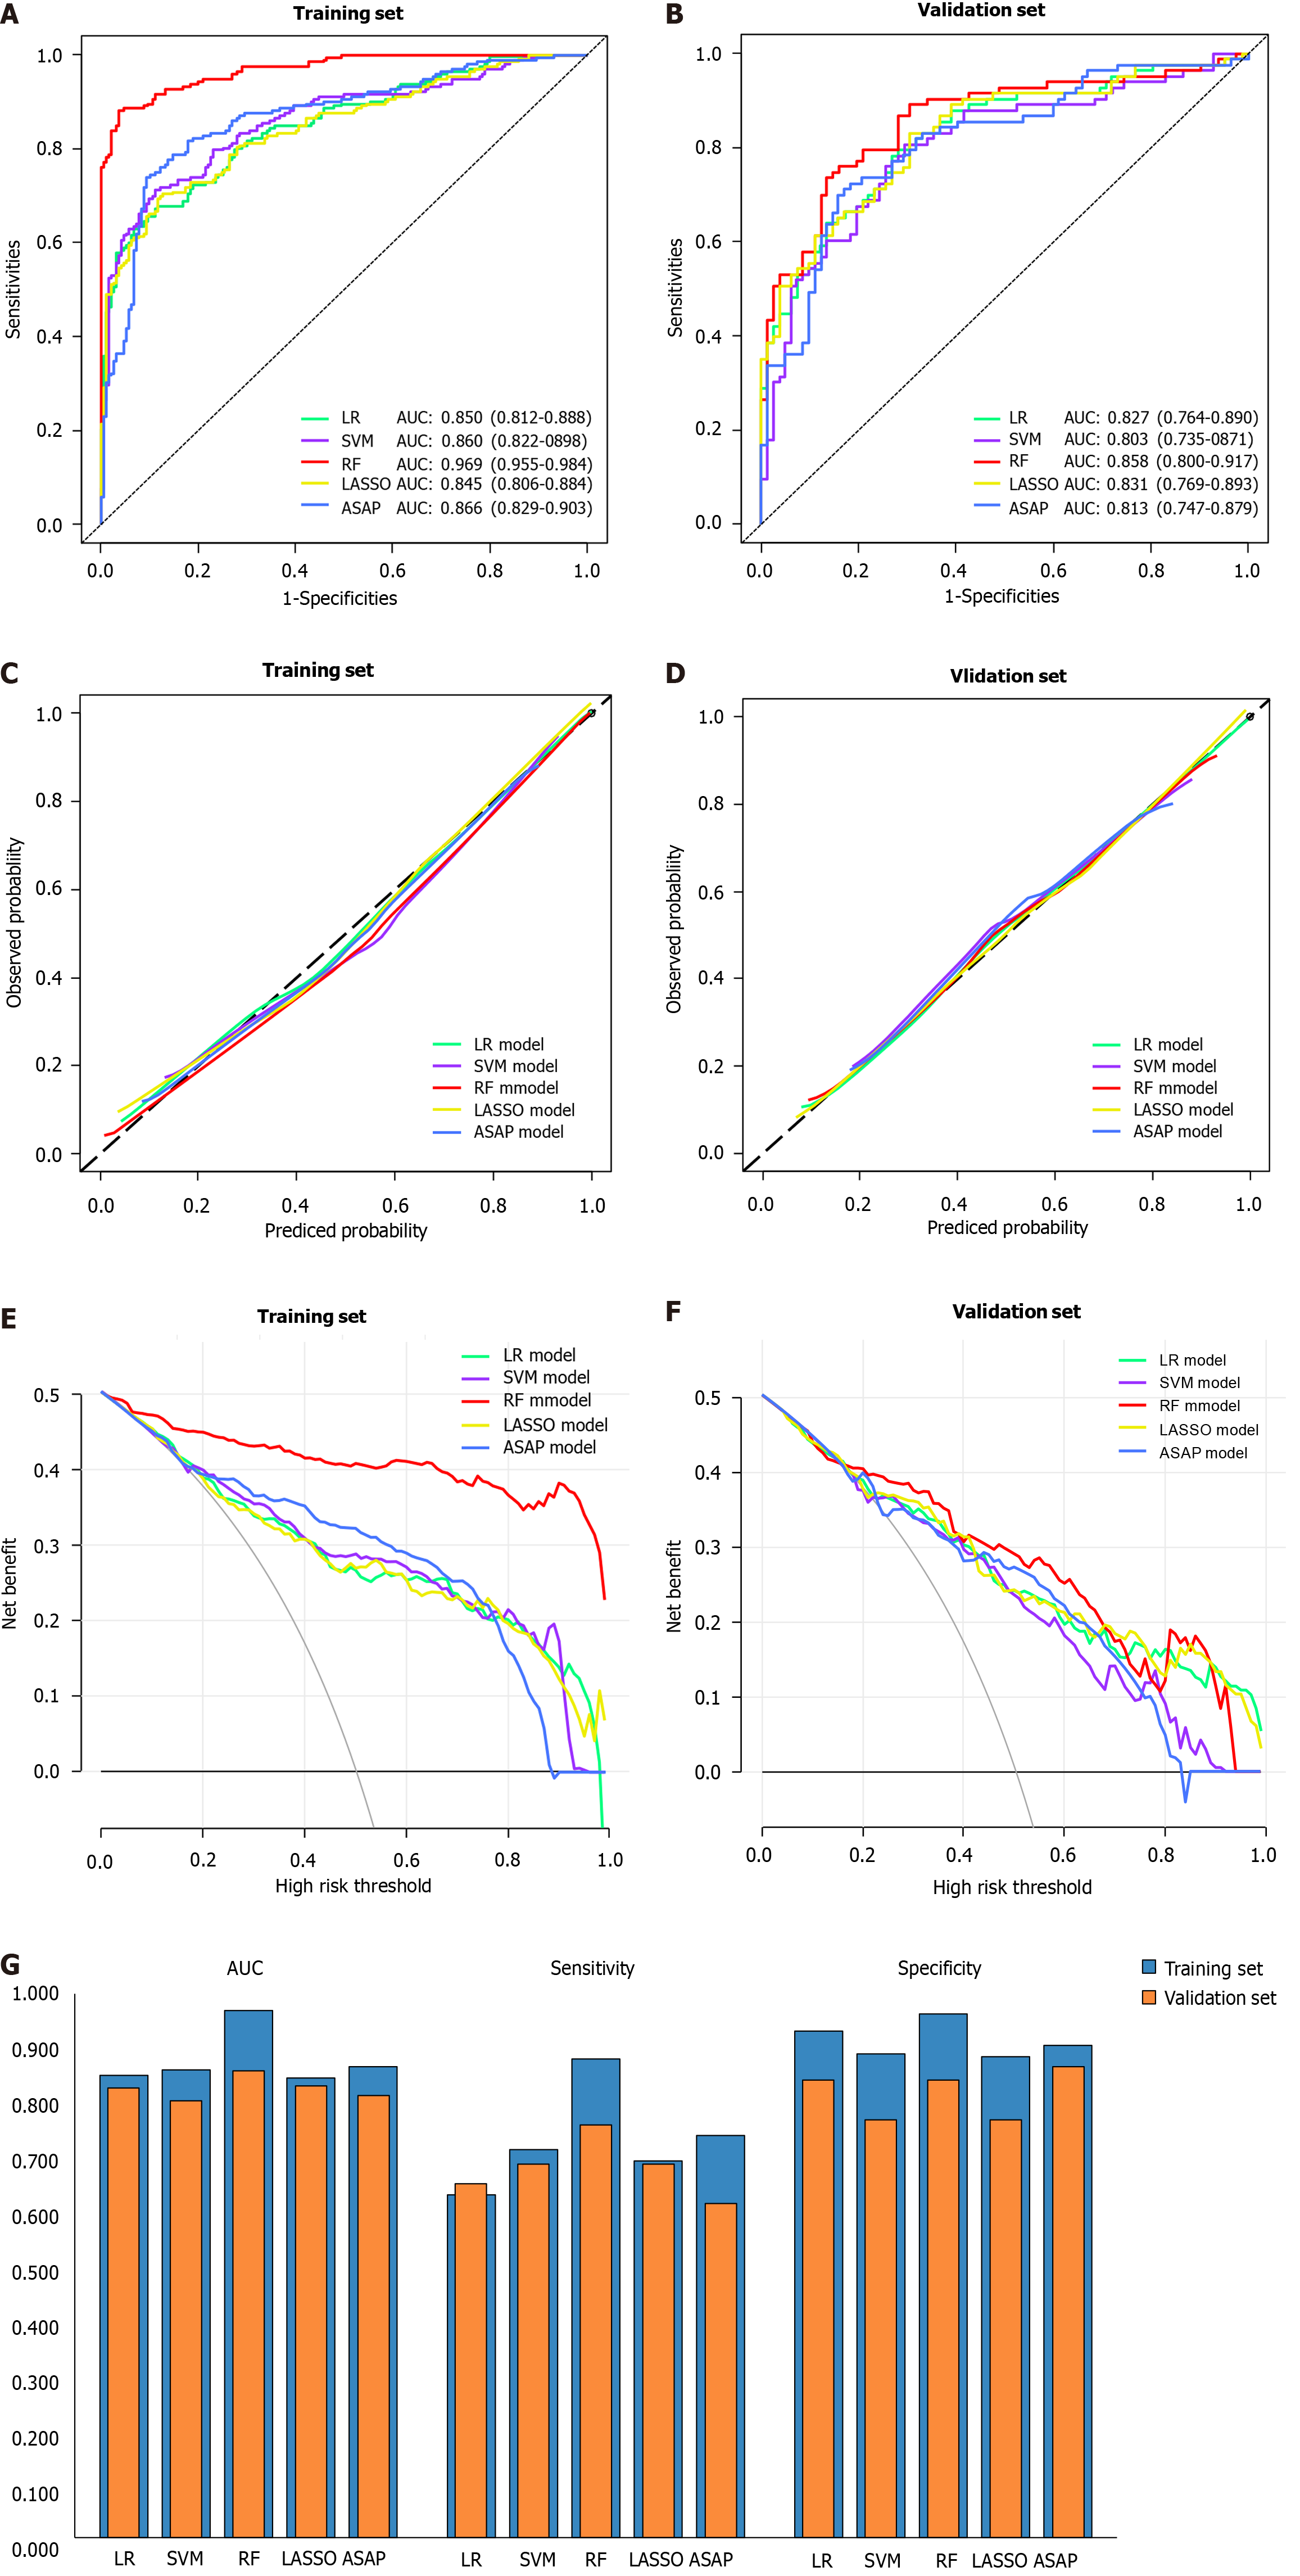
Figure 3 Construction and evaluation of prediction models for hepatocellular carcinoma.
A: The receiver operating characteristic (ROC) curve of the training set; B: The ROC curve of the validation set; C: The calibration curve of the training set; D: The calibration curve of the validation set; E: The decision curve analysis (DCA) curve of the training set; F: The DCA curve of the validation set; G: Comparison of area under the curve, sensitivity, and specificity between the models on both training and validation sets. The black diagonal line in the calibration curves represents the optimal prediction value, while the X-axis and Y-axis of DCA curves respectively represent the threshold probability and net benefit. LR: Logistic regression; SVM: Support vector machine; RF: Random forest; LASSO: Least absolute shrinkage and selection operator; AUC: Area under the curve.
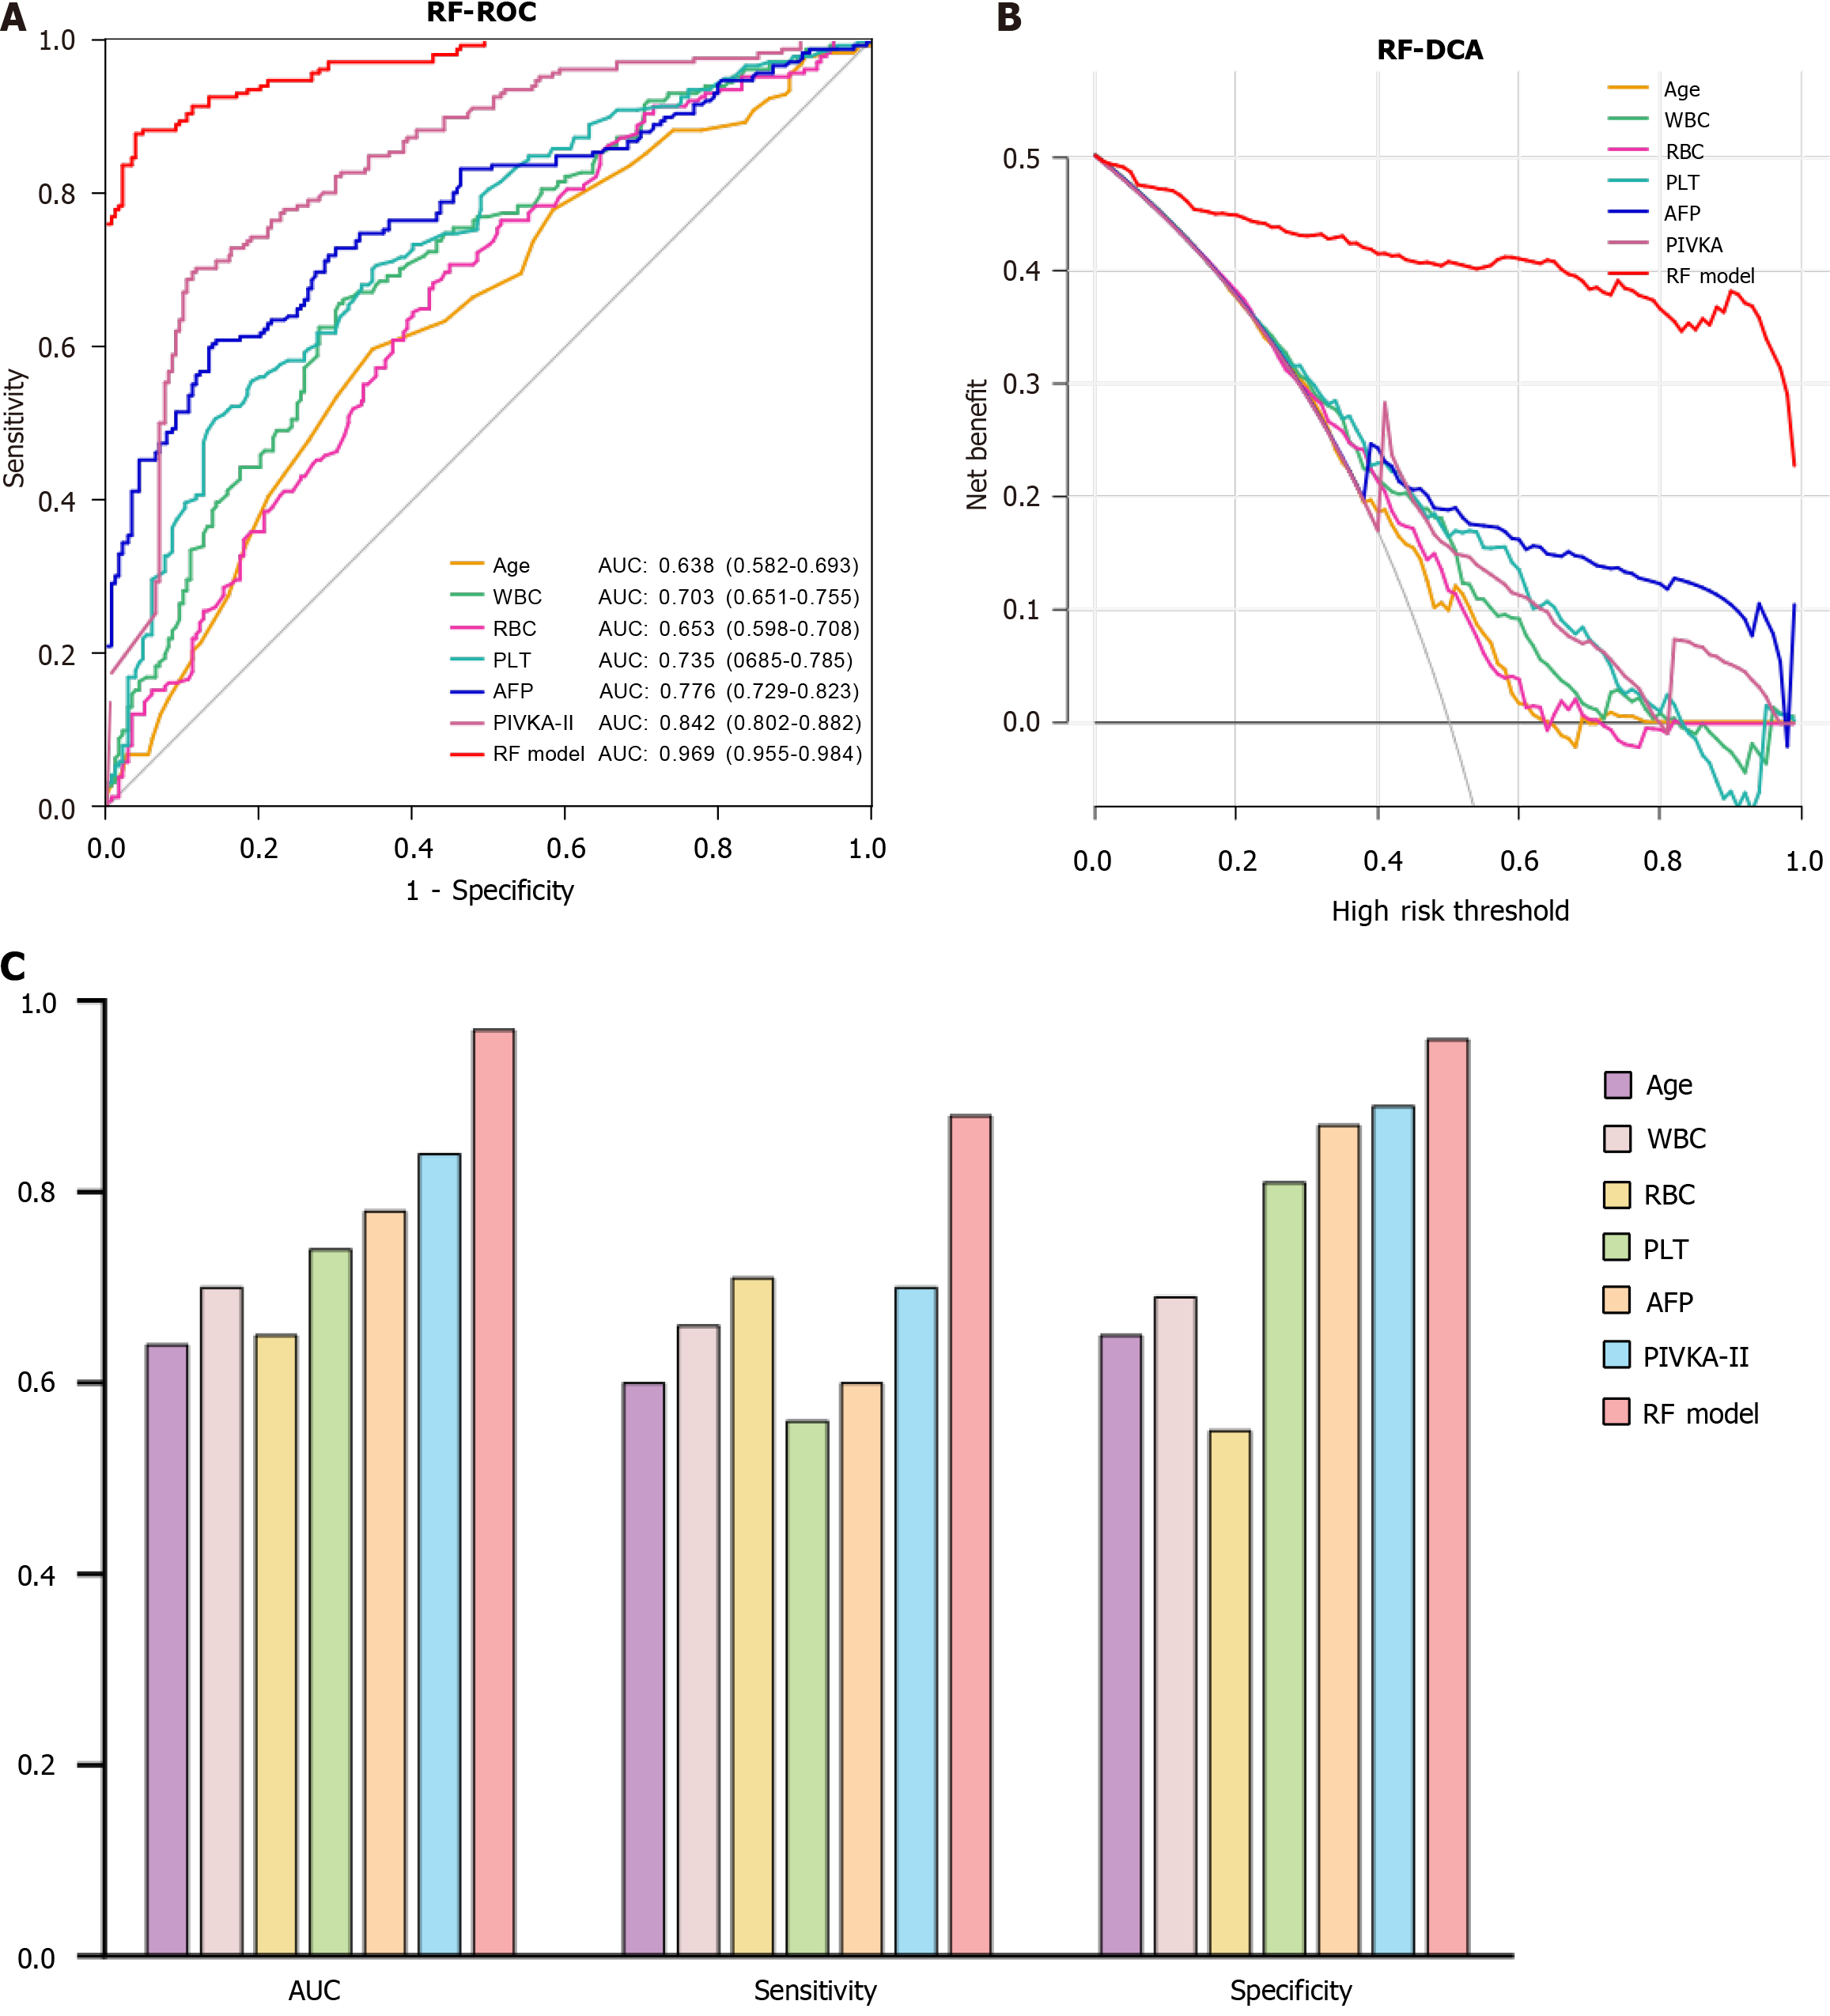
Figure 4 Random forest model validation.
A: The receiver operating characteristic curve curves of the individual variables included in the random forest (RF) model are compared with those of the overall model; B: The decision curve analysis curves for each variable included in the RF model are compared with those of the overall model; C: Comparison of area under the curve, sensitivity, and specificity between the individual variables and RF model. LR: Logistic regression; SVM: Support vector machine; RF: Random forest; LASSO: Least absolute shrinkage and selection operator; AUC: Area under the curve; WBC: White blood cell; RBC: Red blood cell; PLT: Platelet; AFP: Alpha-fetoprotein; PIVKA-II: Protein induced by vitamin K absence or antagonist II.
- Citation: Wang YY, Yang WX, Du QJ, Liu ZH, Lu MH, You CG. Construction and evaluation of a liver cancer risk prediction model based on machine learning. World J Gastrointest Oncol 2024; 16(9): 3839-3850
- URL: https://www.wjgnet.com/1948-5204/full/v16/i9/3839.htm
- DOI: https://dx.doi.org/10.4251/wjgo.v16.i9.3839


