Copyright
©The Author(s) 2024.
World J Gastrointest Oncol. Aug 15, 2024; 16(8): 3732-3737
Published online Aug 15, 2024. doi: 10.4251/wjgo.v16.i8.3732
Published online Aug 15, 2024. doi: 10.4251/wjgo.v16.i8.3732
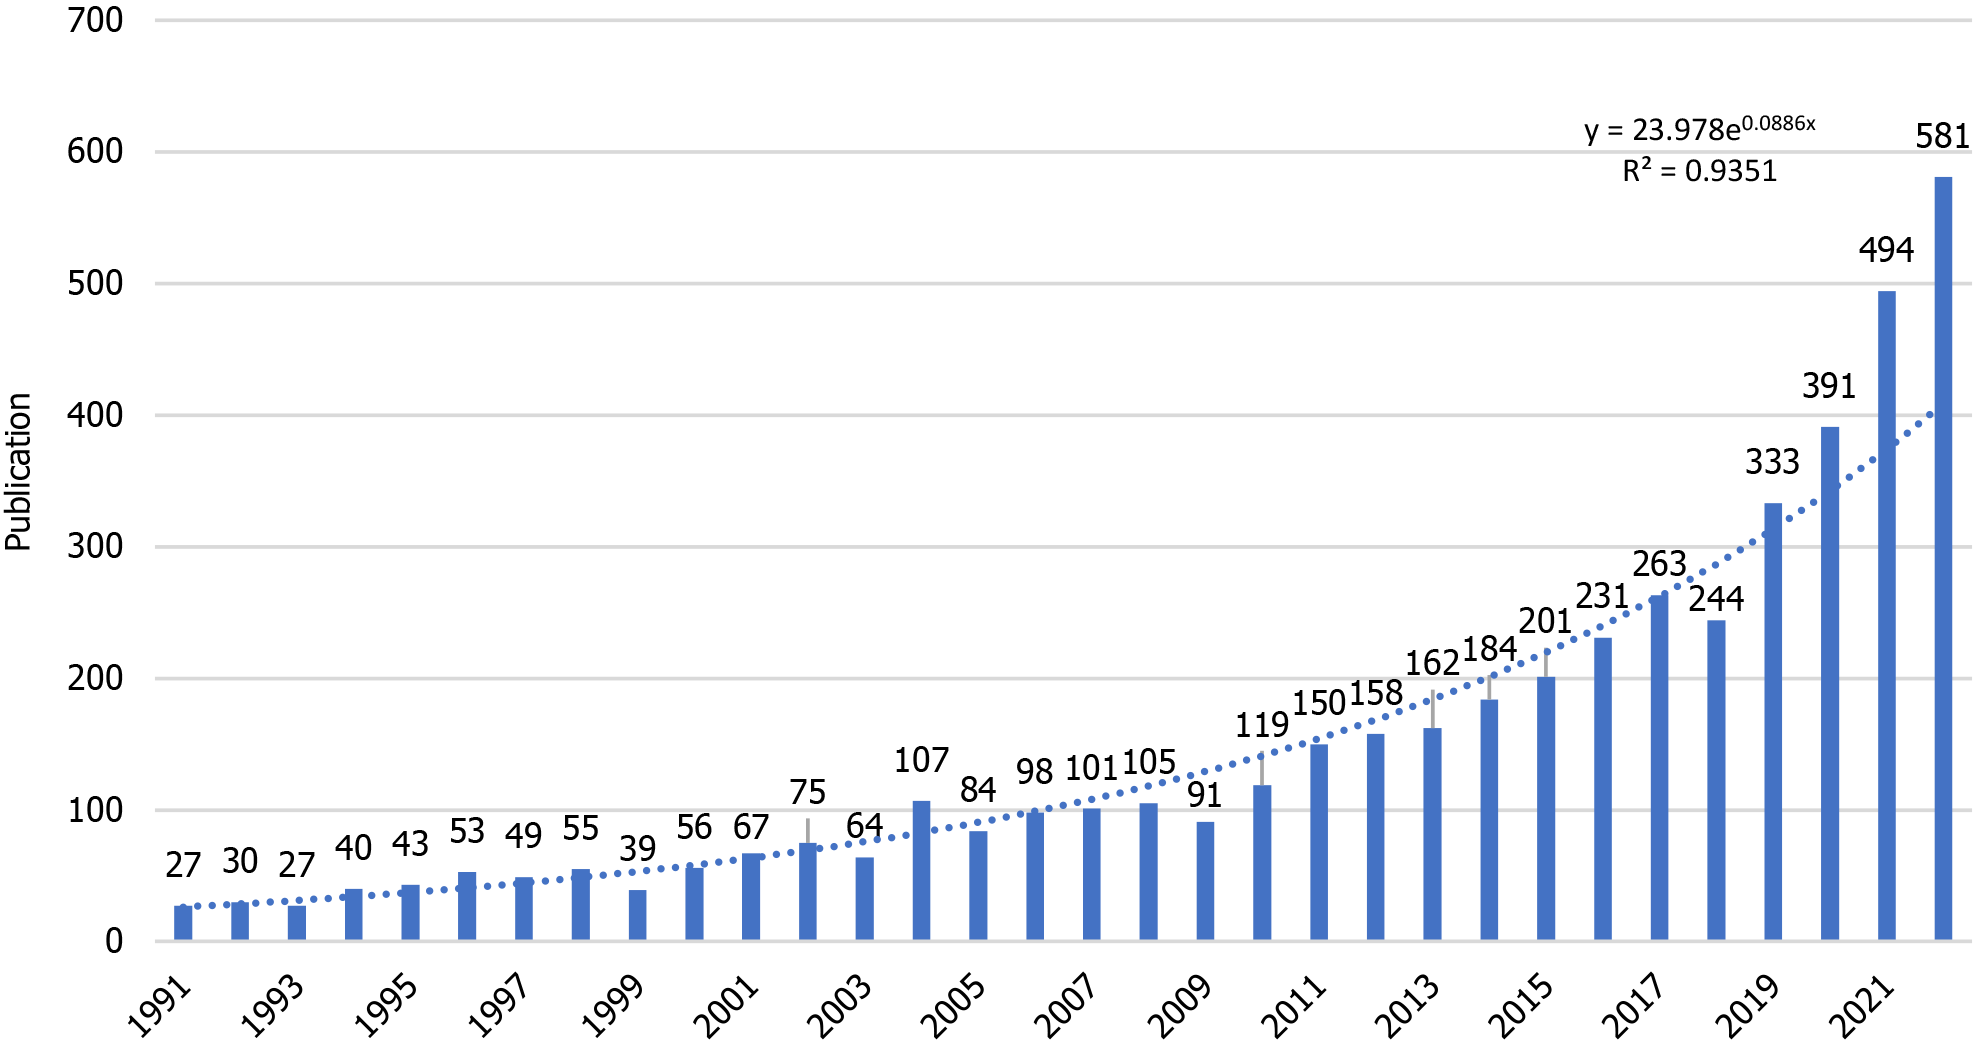
Figure 1 The annual publication trends in cellular metabolism of colorectal cancer.
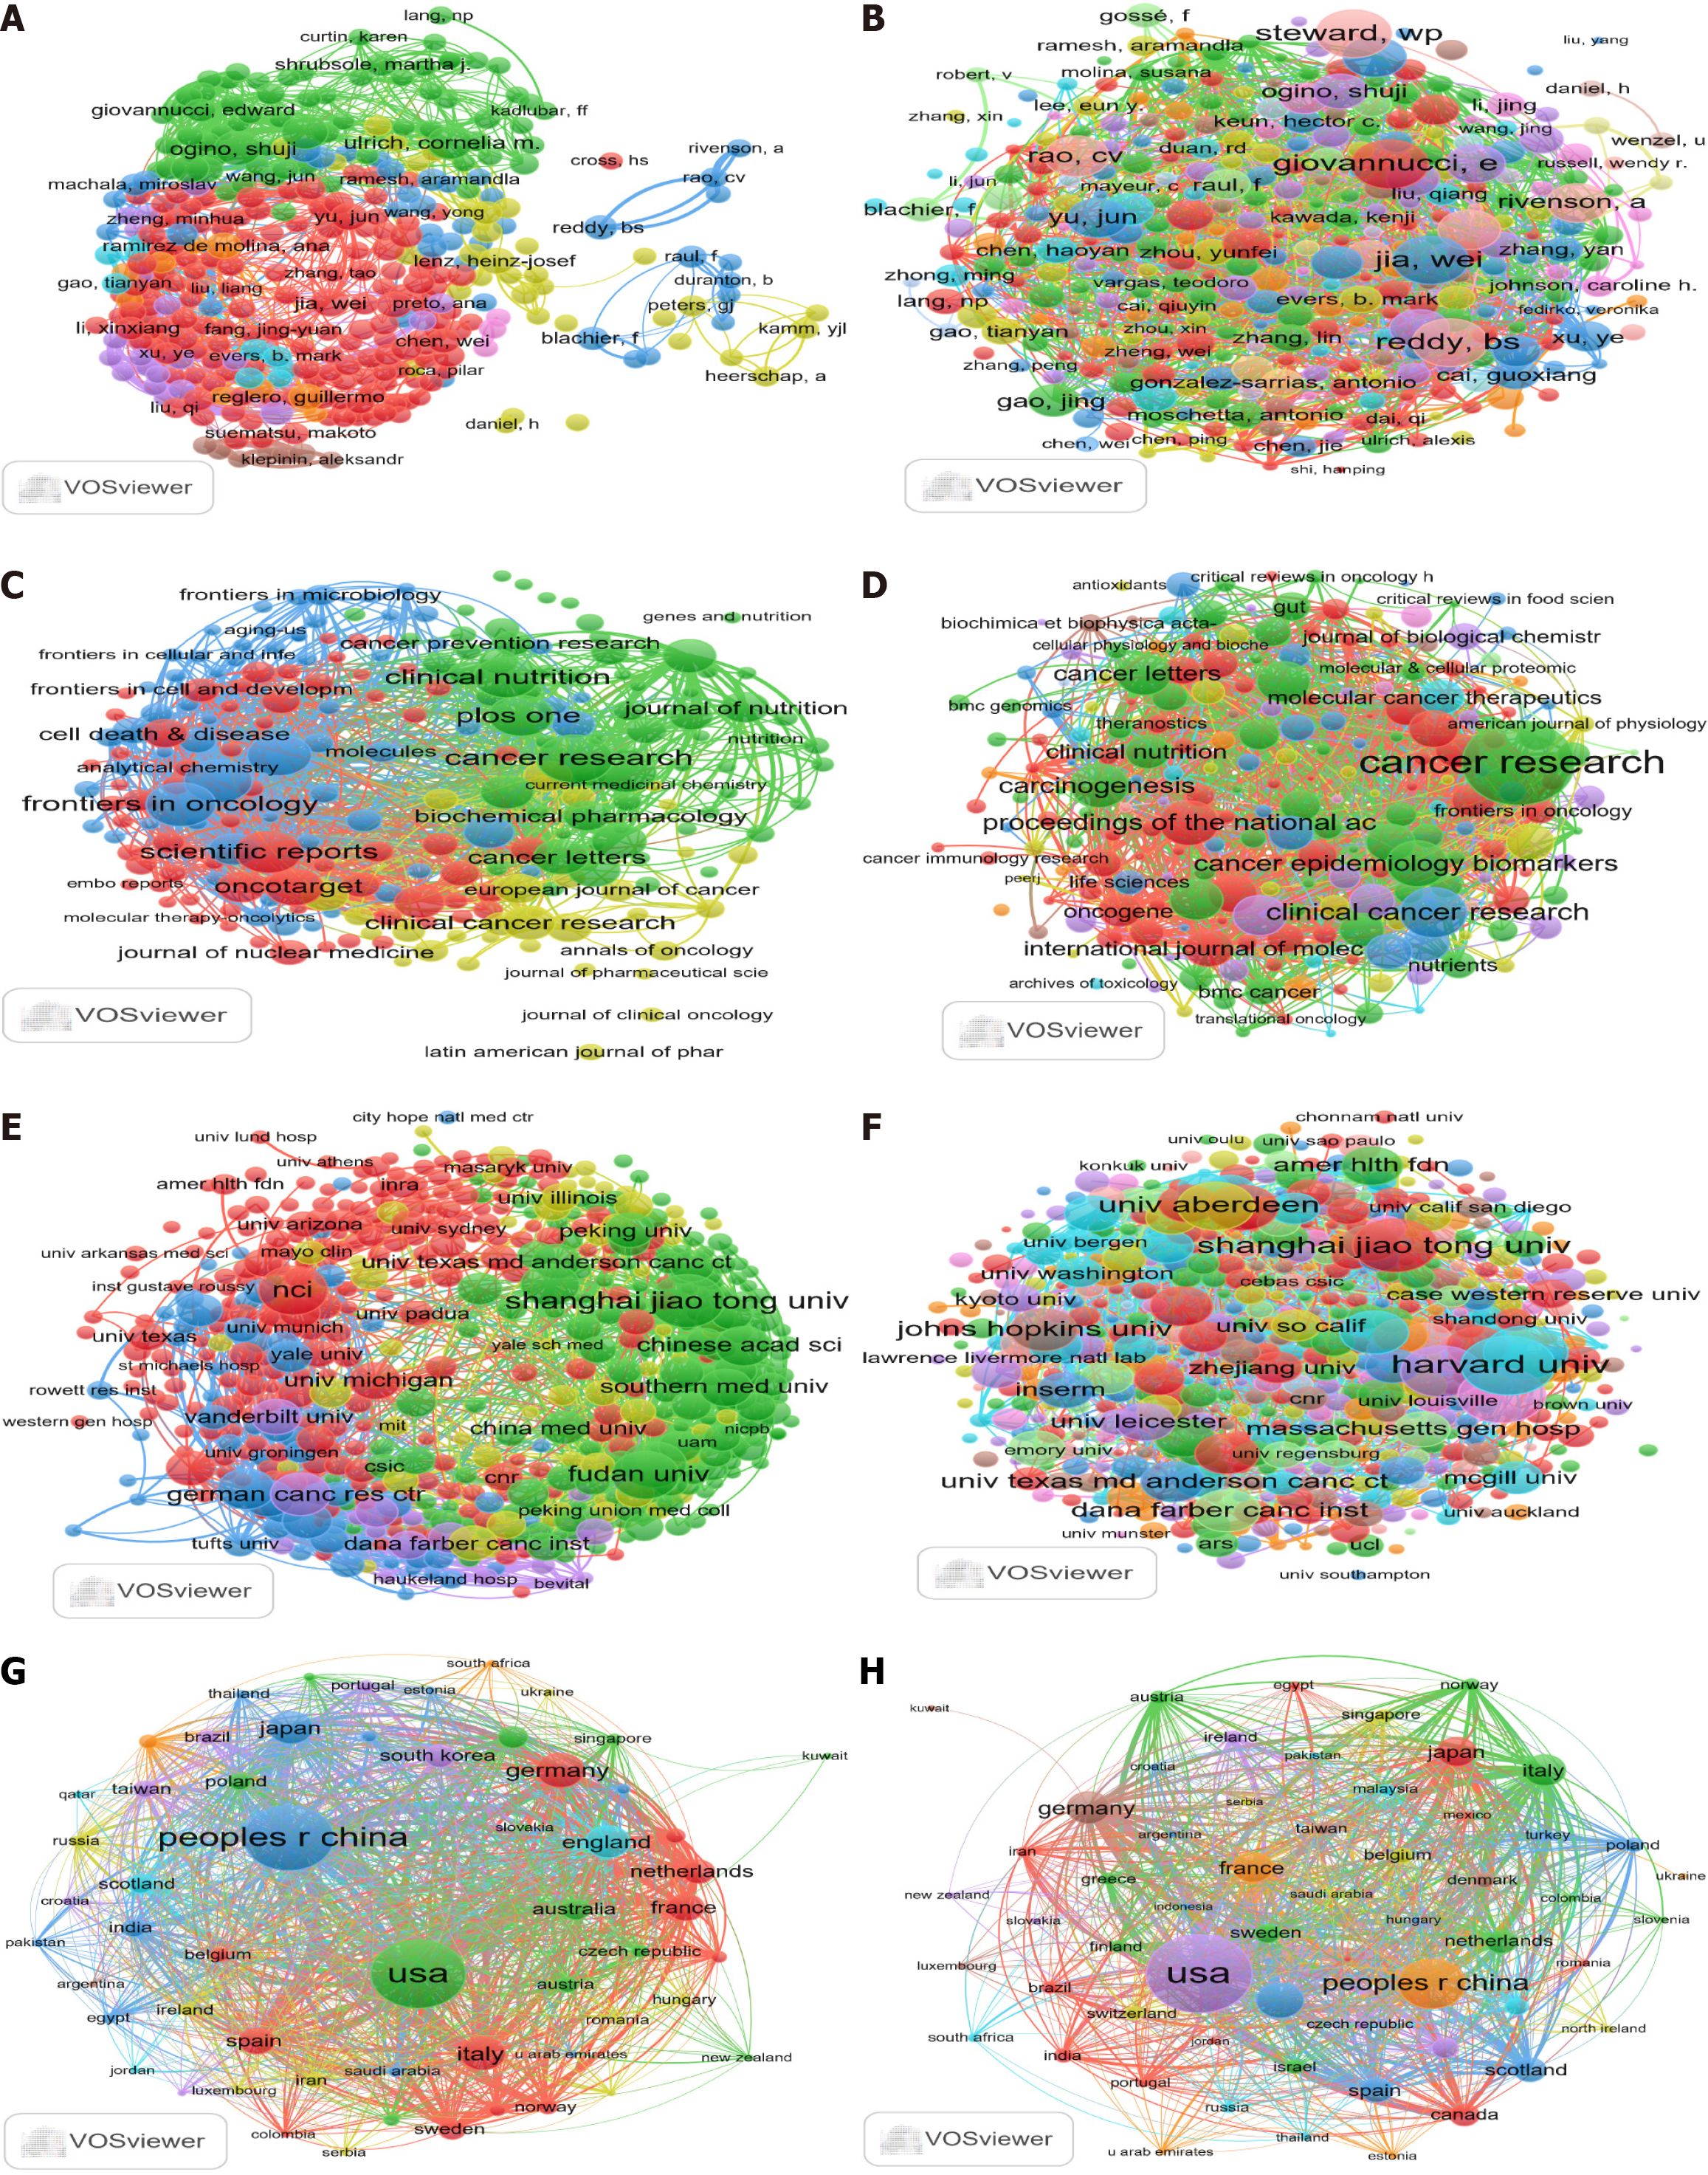
Figure 2 Bibliometric analysis of cellular metabolism of colorectal cancer.
A and B: VOSviewer visualization chart depicting bibliographic coupling of authors’ documents and author citations, providing a detailed representation of prolific authors and their collaborative networks; C and D: VOSviewer visualization chart illustrating bibliographic coupling of sources, presenting an intricate network of inter-journal relationships. Circle size reflects publication volume or citations, with lines indicating collaborative clusters between journals; E and F: Distribution of documents and citations from different institutions, analyzed using bibliographic coupling with VOSviewer (version 1.6.18), revealing collaborative networks among institutions; G: Geographical distribution of scholarly documents originating from various nations, depicted through bibliographic coupling analysis facilitated by VOSviewer (version 1.6.18). Circle size represents the volume of scholarly production, with connecting lines indicating inter-country collaborations; H: Geographical distribution of citations originating from different nations, visualized through bibliographic coupling analysis using VOSviewer (version 1.6.18). Circle size corresponds to the volume of citations received, with connecting lines representing inter-country citation networks.
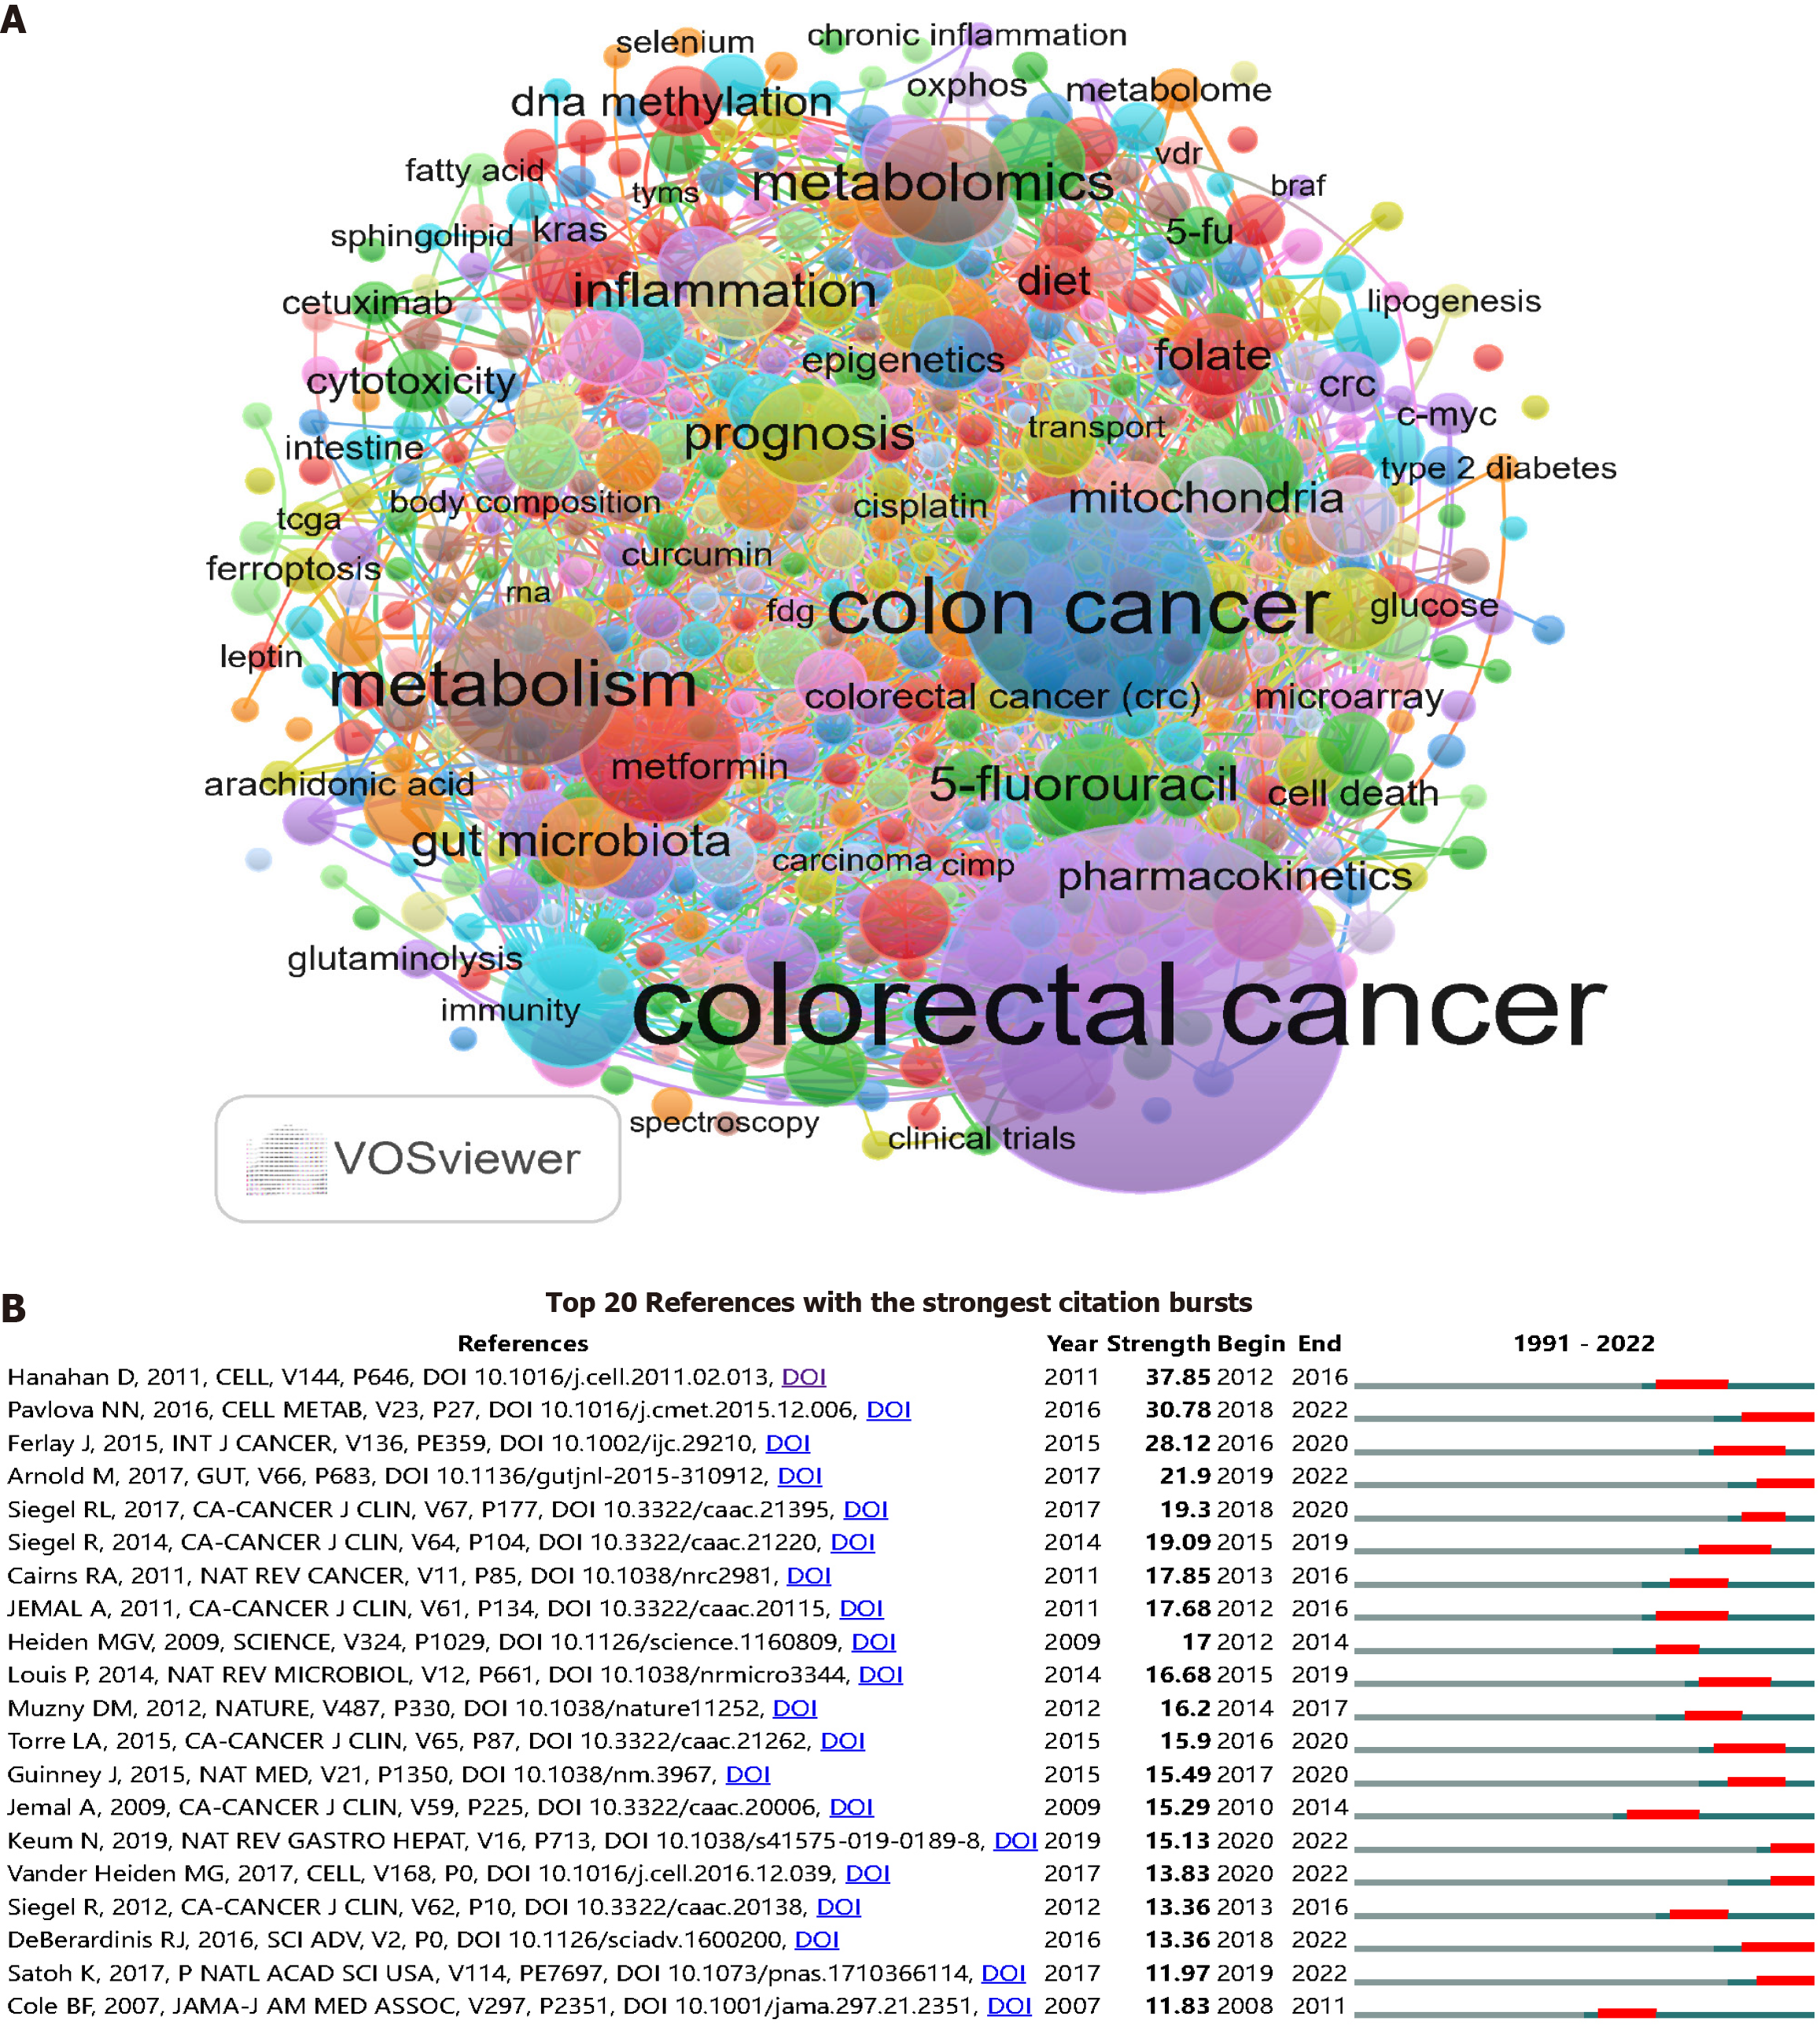
Figure 3 Bibliometric analysis of keywords and top 20 references in the field of cellular metabolism in colorectal cancer.
A: Frequency distribution of top 500 authors’ keywords related to cellular metabolism in colorectal cancer; B: Identification of the top 20 references exhibiting the strongest citation bursts in the field of cellular metabolism in colorectal cancer, analyzed using CiteSpace 61.R6 (64-bit) Basic.
- Citation: Jiang BW, Zhang XH, Ma R, Luan WY, Miao YD. Current and future research directions in cellular metabolism of colorectal cancer: A bibliometric analysis. World J Gastrointest Oncol 2024; 16(8): 3732-3737
- URL: https://www.wjgnet.com/1948-5204/full/v16/i8/3732.htm
- DOI: https://dx.doi.org/10.4251/wjgo.v16.i8.3732


