Copyright
©The Author(s) 2024.
World J Gastrointest Oncol. Aug 15, 2024; 16(8): 3672-3686
Published online Aug 15, 2024. doi: 10.4251/wjgo.v16.i8.3672
Published online Aug 15, 2024. doi: 10.4251/wjgo.v16.i8.3672
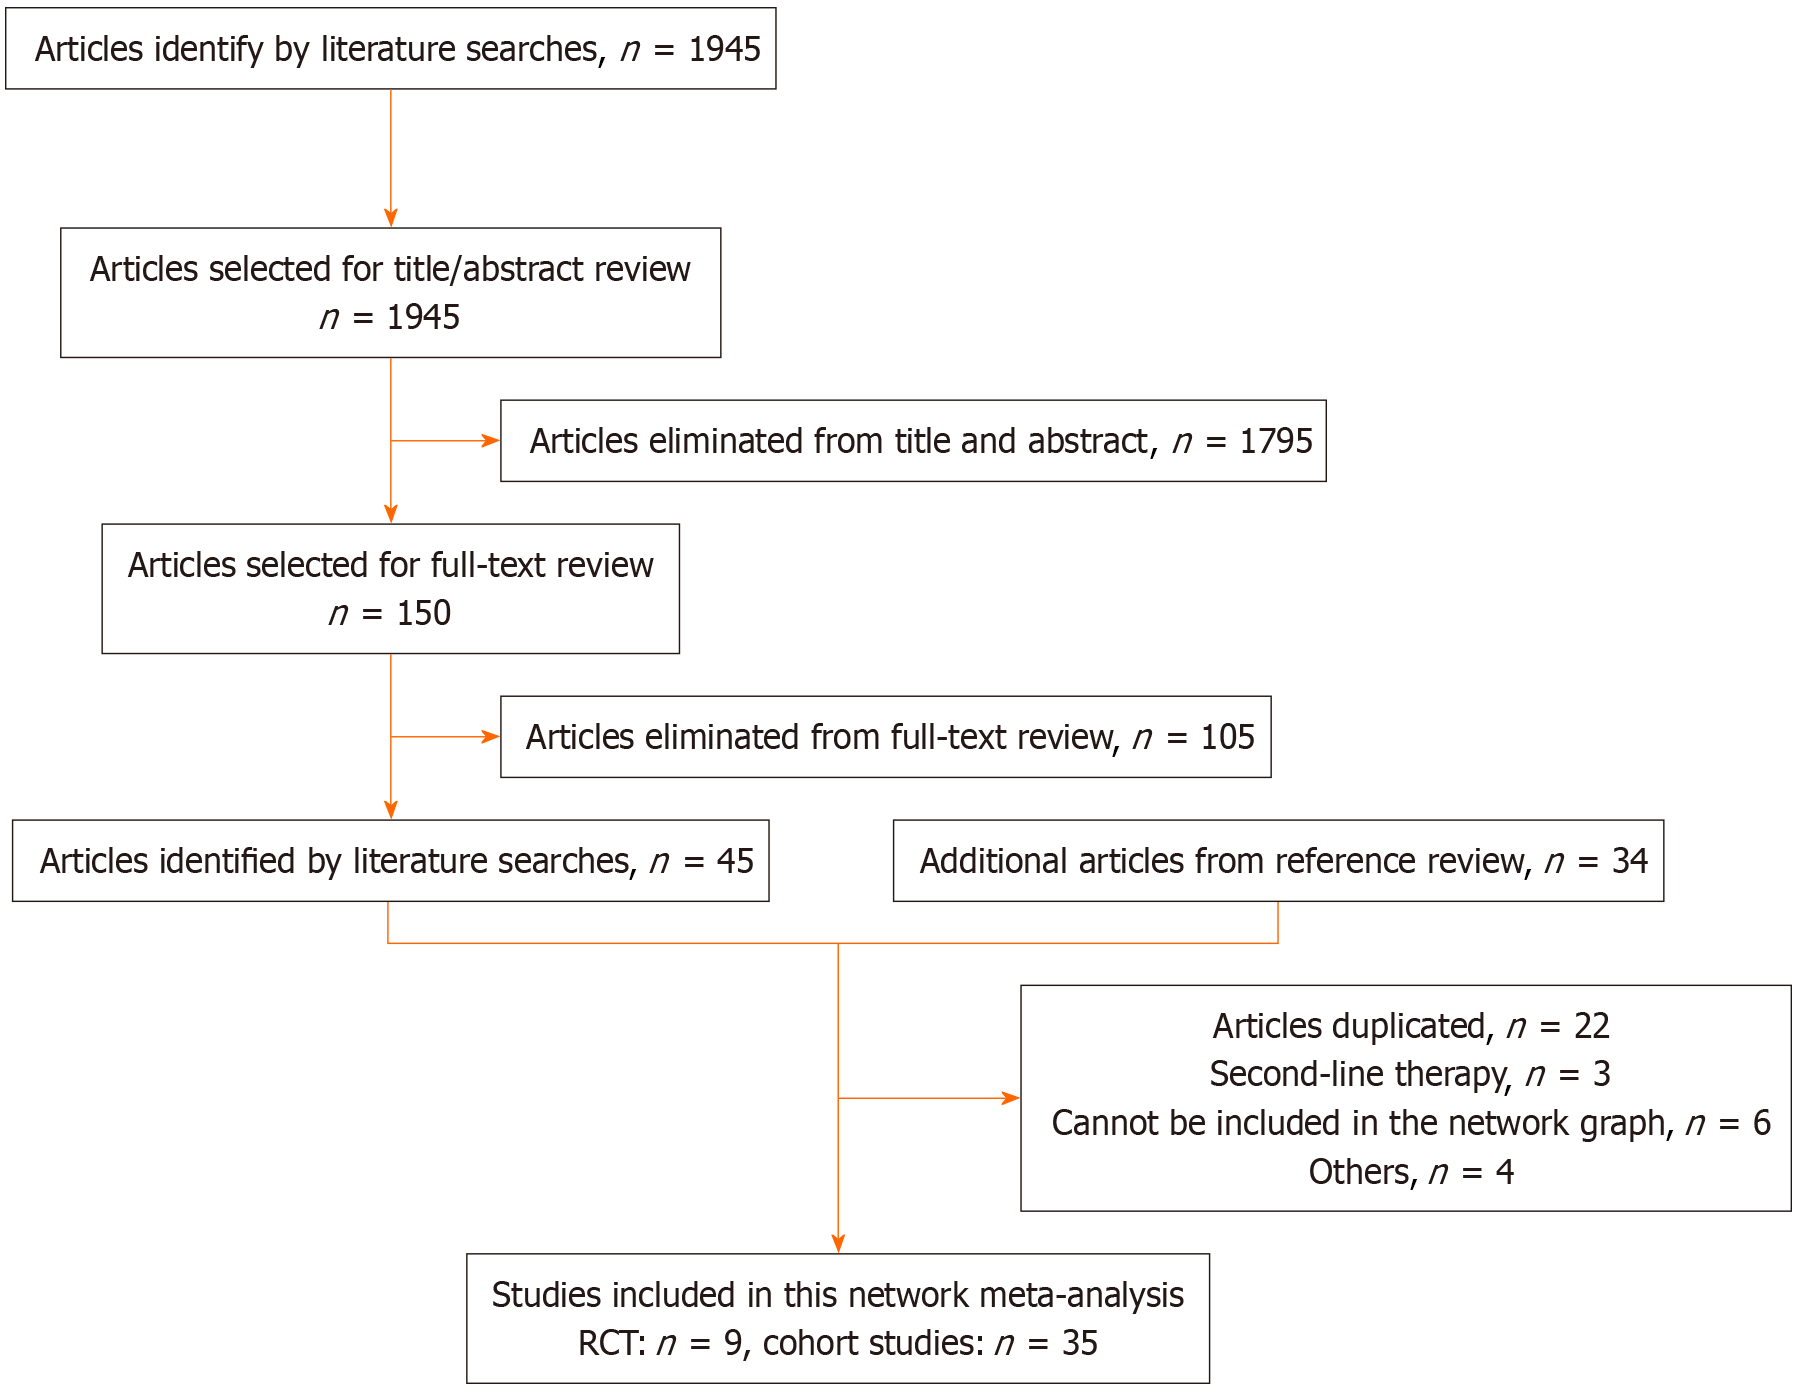
Figure 1 Flow diagram.
RCTs: Randomized controlled trials.
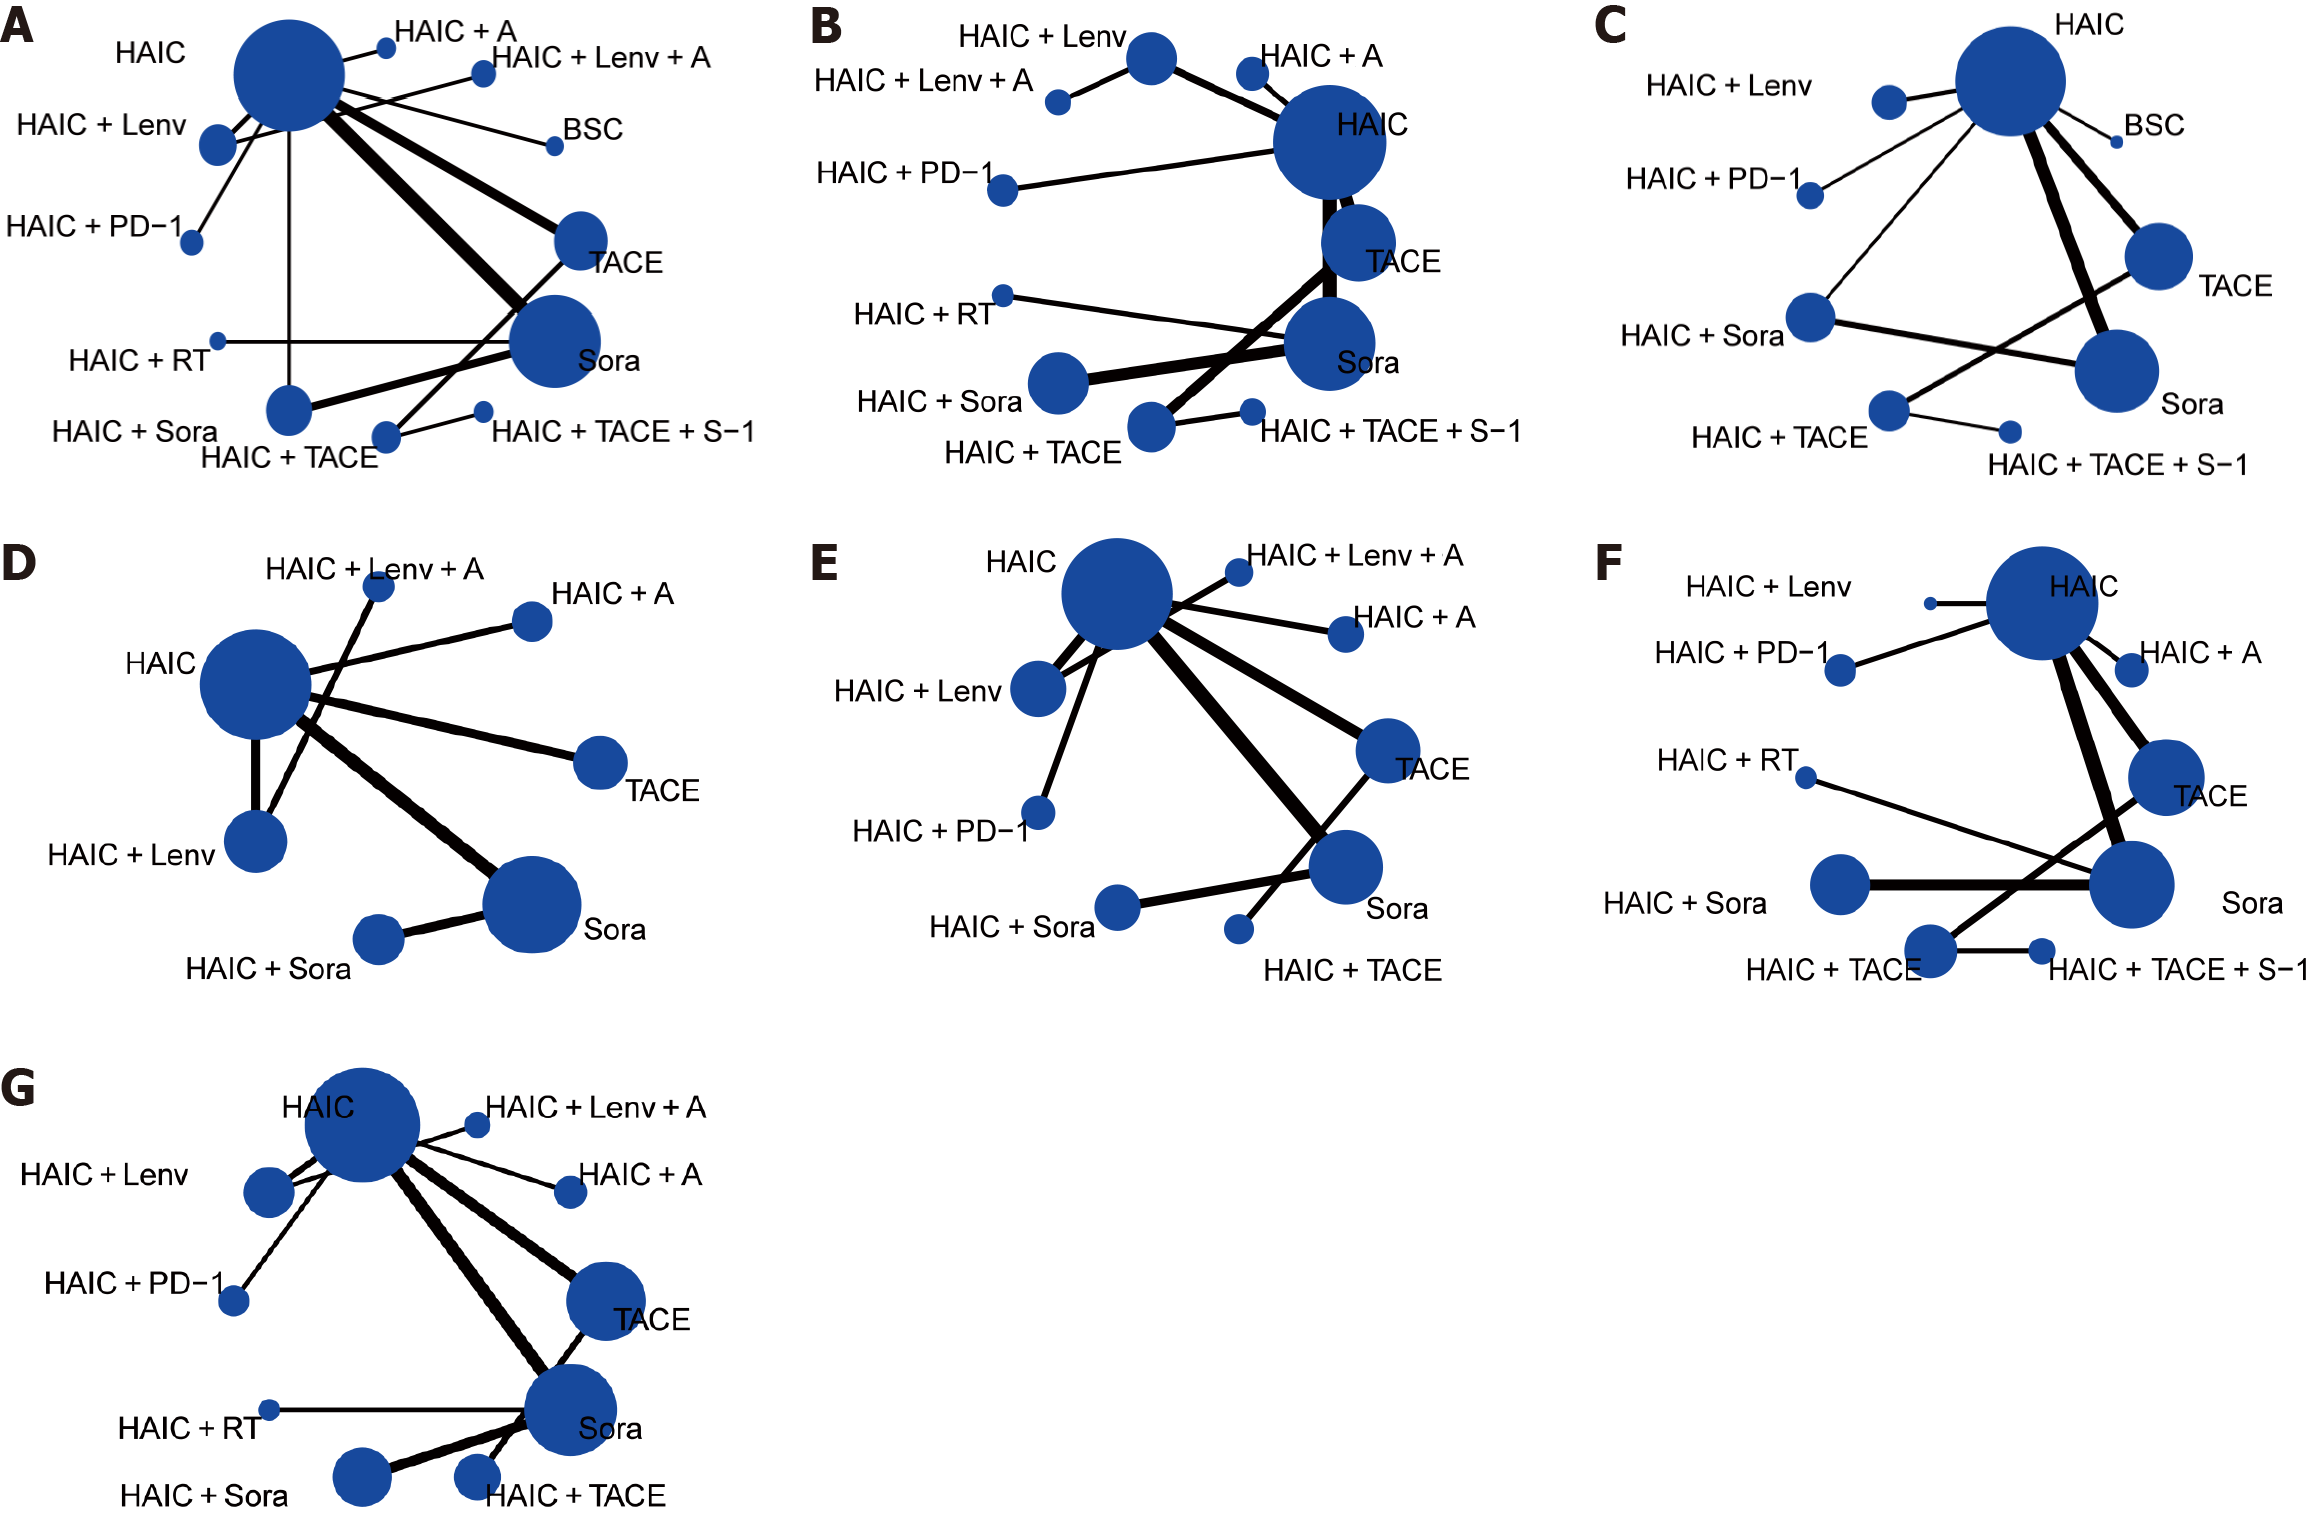
Figure 2 Network graph of the outcomes.
A: Network graph of overall survival; B: Network graph of progression-free survival; C: Network graph of complete response, partial response, objective response rate, and disease control rate; D: Network graph of any grades adverse events (AEs); E: Network graph of 3-4 grades AEs; F: Network graph of 3-4 grades AEs for thrombocytopenia; G: Network graph of 3-4 grades AEs for elevated total bilirubin. HAIC: Hepatic arterial infusion chemotherapy; Sora: Sorafenib; Lenv: Lenvatinib; TACE: Transarterial chemoembolization; RT: Radiotherapy; S-1: A composite preparation of a 5-fluorouracil prodrug; A: Ablation; PD-1: Programmed death 1.
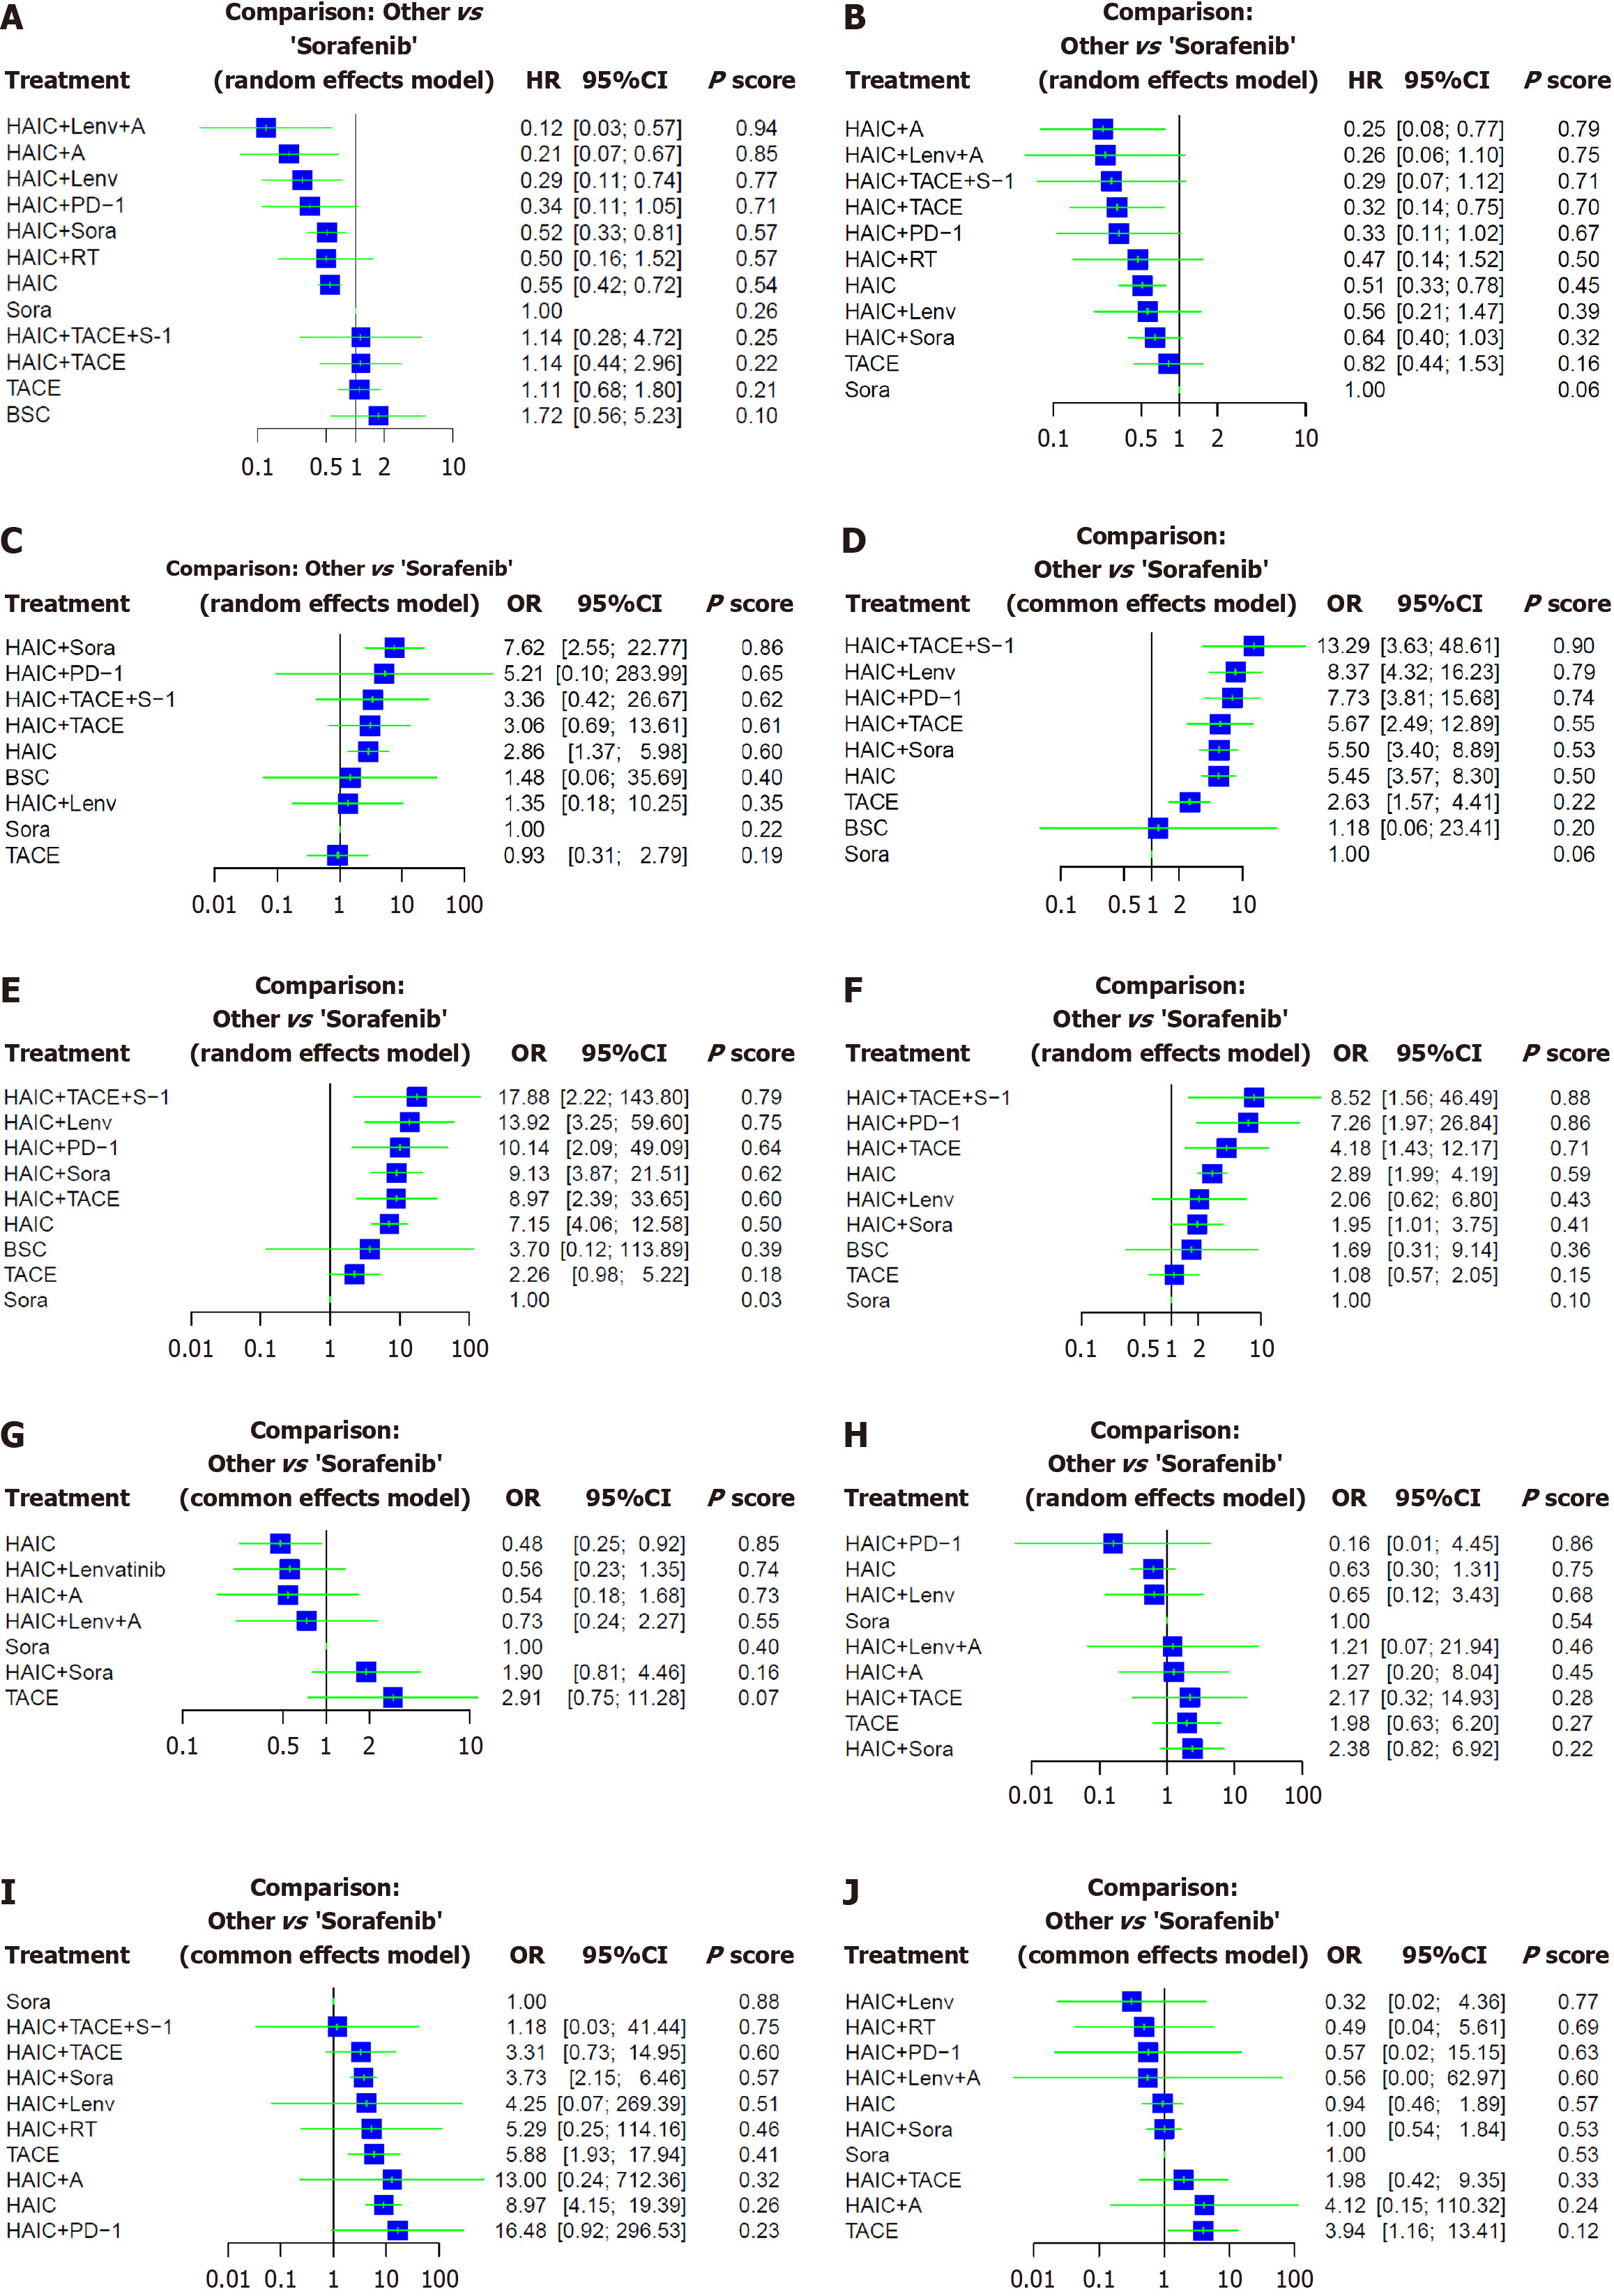
Figure 3 Forest plot of the outcomes and P score for treatment ranking.
A: Forest plot of overall survival; B: Forest plot of progression-free survival; C: Forest plot of complete response; D: Forest plot of partial response; E: Forest plot of objective response rate; F: Forest plot of disease control rate; G: Forest plot of any grades adverse events (AEs); H: Forest plot of 3-4 grades AEs; I: Forest plot of 3-4 grades AEs for thrombocytopenia; J: Forest plot of 3-4 grades AEs for elevated total bilirubin. HAIC: Hepatic arterial infusion chemotherapy; Sora: Sorafenib; Lenv: Lenvatinib; TACE: Transarterial chemoembolization; RT: Radiotherapy; S-1: A composite preparation of a 5-fluorouracil prodrug; A: Ablation; PD-1: Programmed death 1.
- Citation: Zhou SA, Zhou QM, Wu L, Chen ZH, Wu F, Chen ZR, Xu LQ, Gan BL, Jin HS, Shi N. Efficacy of hepatic arterial infusion chemotherapy and its combination strategies for advanced hepatocellular carcinoma: A network meta-analysis. World J Gastrointest Oncol 2024; 16(8): 3672-3686
- URL: https://www.wjgnet.com/1948-5204/full/v16/i8/3672.htm
- DOI: https://dx.doi.org/10.4251/wjgo.v16.i8.3672


