Copyright
©The Author(s) 2024.
World J Gastrointest Oncol. Aug 15, 2024; 16(8): 3651-3671
Published online Aug 15, 2024. doi: 10.4251/wjgo.v16.i8.3651
Published online Aug 15, 2024. doi: 10.4251/wjgo.v16.i8.3651
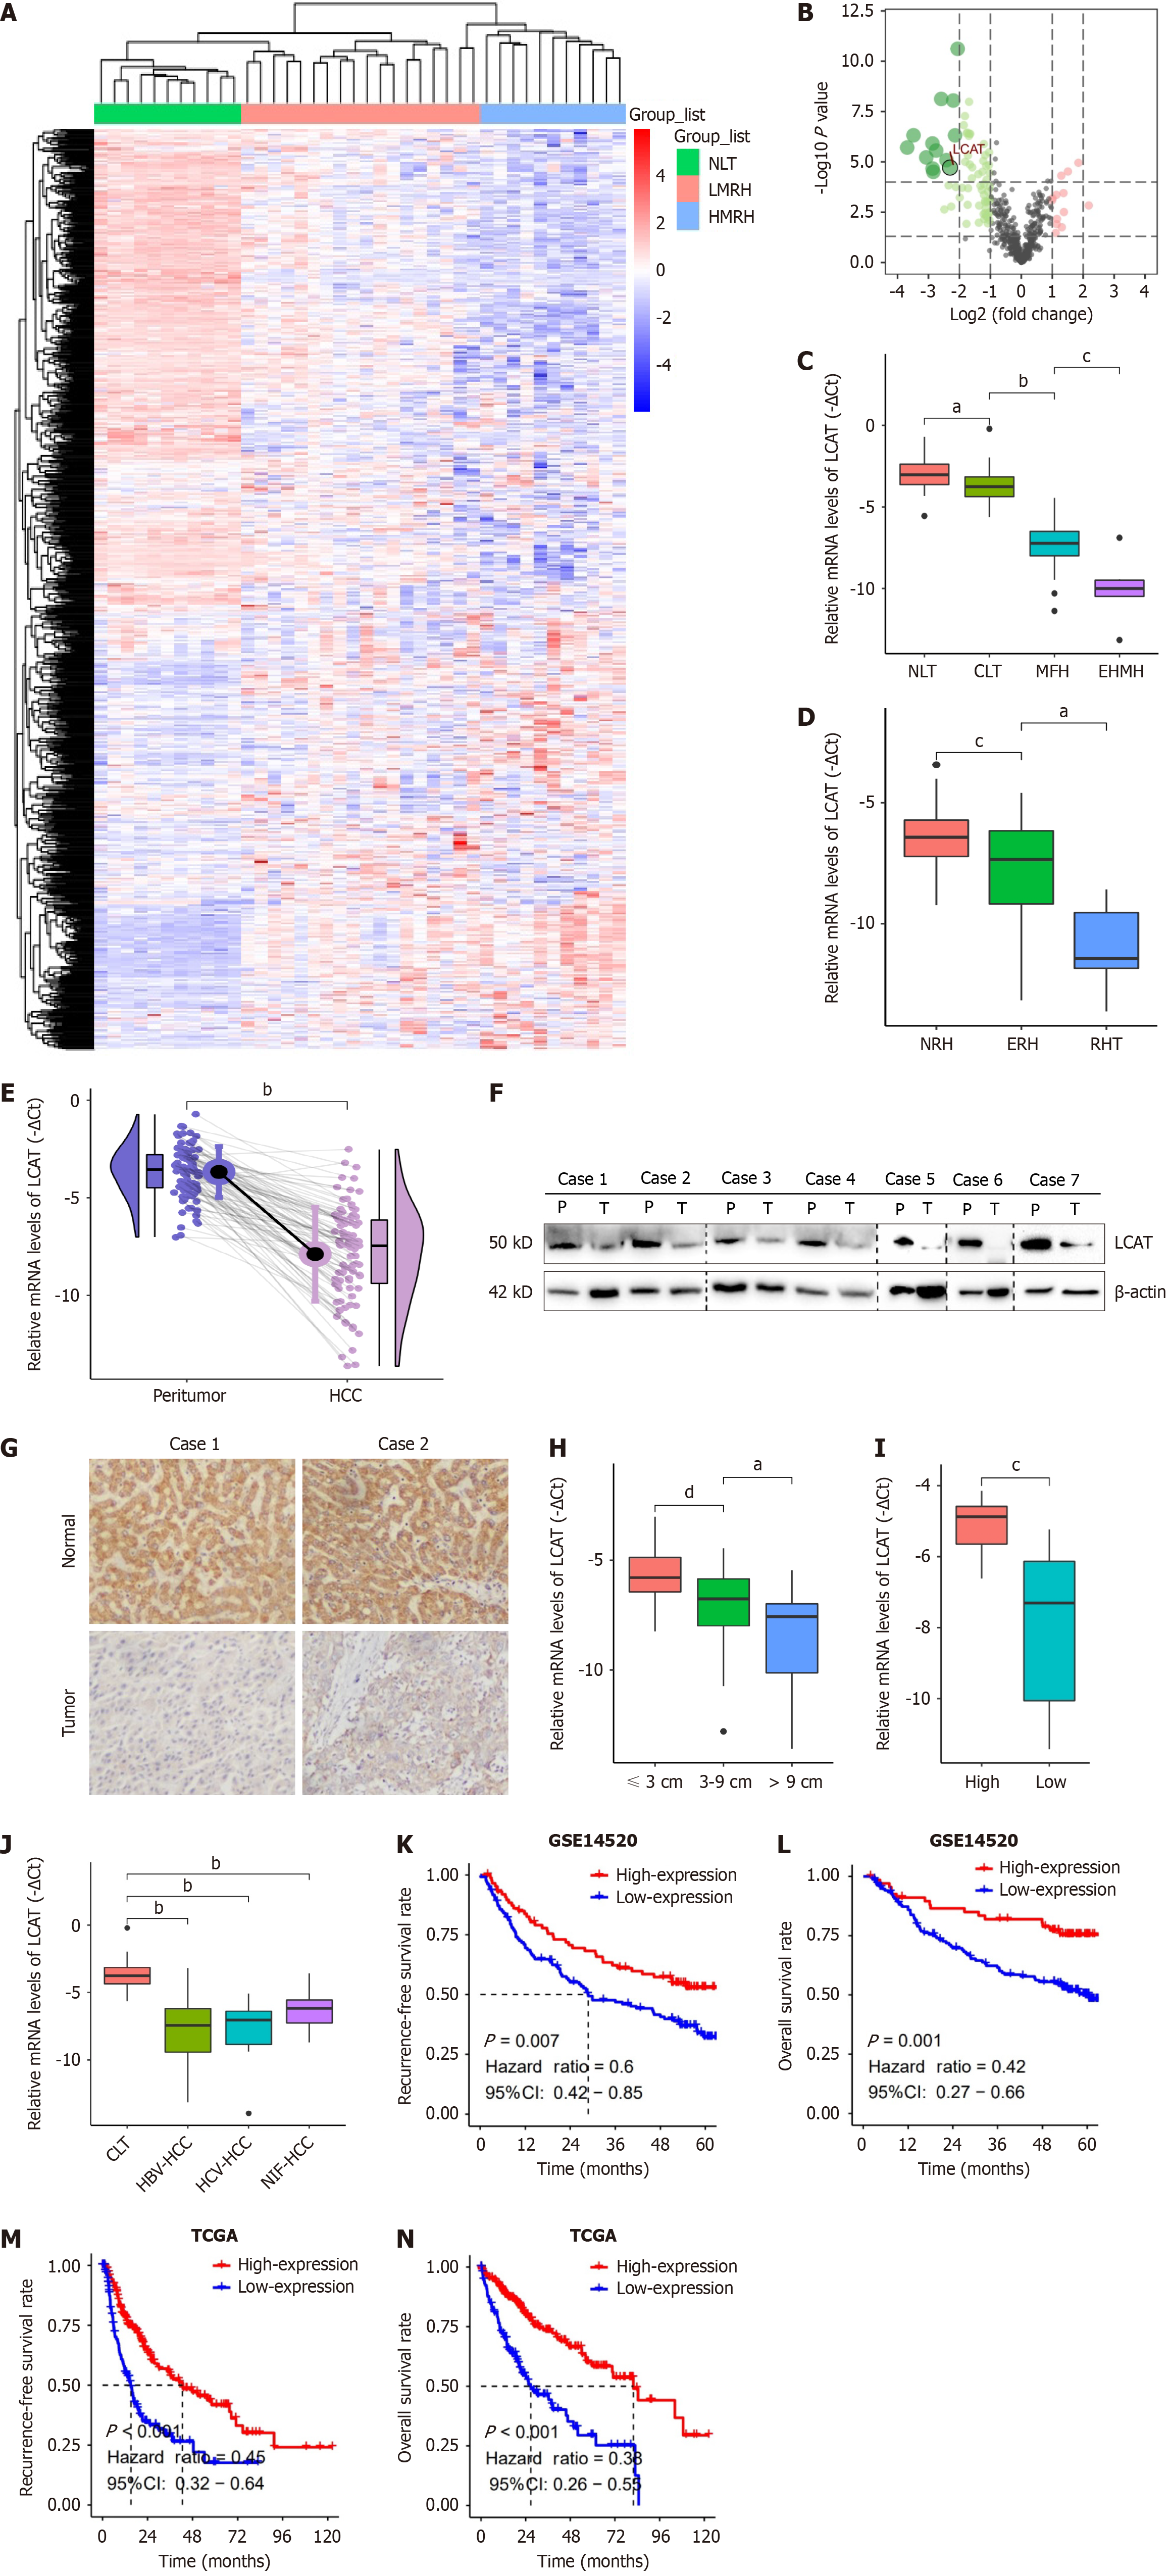
Figure 1 Lecithin-cholesterol acyltransferase expression is decreased in hepatocellular carcinoma and associated with metastasis and poor prognosis.
A: Unsupervised hierarchical clustering using the gene expression profiles of GSE14520 microarray data among high metastasis risk hepatocellular carcinoma (HCC) (HMRH), low metastasis risk HCC (LMRH) and normal liver tissues (NLT); B: Volcano plot illustrated the lipid-metabolism-related gene. Lecithin-cholesterol acyltransferase (LCAT) was significantly downregulated in HMH compared with LMH and NLT; C-E: Quantitative real-time polymerase chain reaction (qRT-PCR) analysis of LCAT mRNA in the NLT (n = 32), cirrhotic liver tissue (CLT, n = 43), metastasis-free HCCs (n = 18), extrahepatic metastatic HCCs (extrahepatic metastasis, n = 6) (C), in the nonrecurrent HCCs (NRH, n = 17), early recurrent HCCs (n = 24), recurrent HCC tissues (n = 7) (D), and in 90 paired HCC samples (E); F: Western blot analysis of LCAT in seven HCCs and matched peritumoral tissues. β-Actin was used as the internal control; G: Immunohistochemical staining of LCAT in paired HCC samples; H-J: qRT-PCR analysis of LCAT mRNA in HCC with different tumor size, grade or etiologies; K-N: Recurrence-free survival and overall survival of HCC patients with low or high LCAT expression in both GSE14520 cohort and The Cancer Genome Atlas HCC cohort. aP < 0.01, bP < 0.0001, cP < 0.05, dP < 0.001. HCC: Hepatocellular carcinoma; LCAT: Lecithin-cholesterol acyltransferase; NLT: Normal liver tissues; CLT: Cirrhotic liver tissue; MFH: Metastasis-free hepatocellular carcinoma; ERH: Early recurrent hepatocellular carcinoma; RHT: Recurrent hepatocellular carcinoma; HBV: Hepatitis B virus; HCV: Hepatitis C virus; TCGA: The Cancer Genome Atlas.
Figure 2 Roles of lecithin-cholesterol acyltransferase in inhibiting hepatocellular carcinoma cells growth and metastasis in vitro.
A and B: Lecithin-cholesterol acyltransferase (LCAT) expression examined by quantitative real-time polymerase chain reaction (qRT-PCR) and western blotting in seven hepatocellular carcinoma (HCC) cell lines; C and D: Confirmation of LCAT knockdown or overexpression in HCC cells by qRT-PCR; E and F: Growth curves of HepG2 and LCAT knocked down HepG2 (E) or Huh7 and LCAT overexpressed Huh7 cells (F); G and H: Colony formation assays of HepG2 and LCAT knocked down HepG2 (G) or Huh7 and LCAT overexpressed Huh7 cells (H). The bar graphs illustrate the quantification of the colony formation assay. Student’s t test was used; I and J: Cell migration and invasion assays of HepG2 and LCAT knocked down HepG2 (I) or Huh7 and LCAT overexpressed Huh7 cells (J). The graphs depict the number of migration and invasive cells. Student’s t test was used; K and L: Soft agar assays for HepG2 and LCAT knocked down HepG2 (K) or Huh7 and LCAT overexpressed Huh7 cells (L). Representative images are shown (left). The numbers of colonies are present in the right panel. aP < 0.01, bP < 0.0001, dP < 0.001. LCAT: Lecithin-cholesterol acyltransferase.
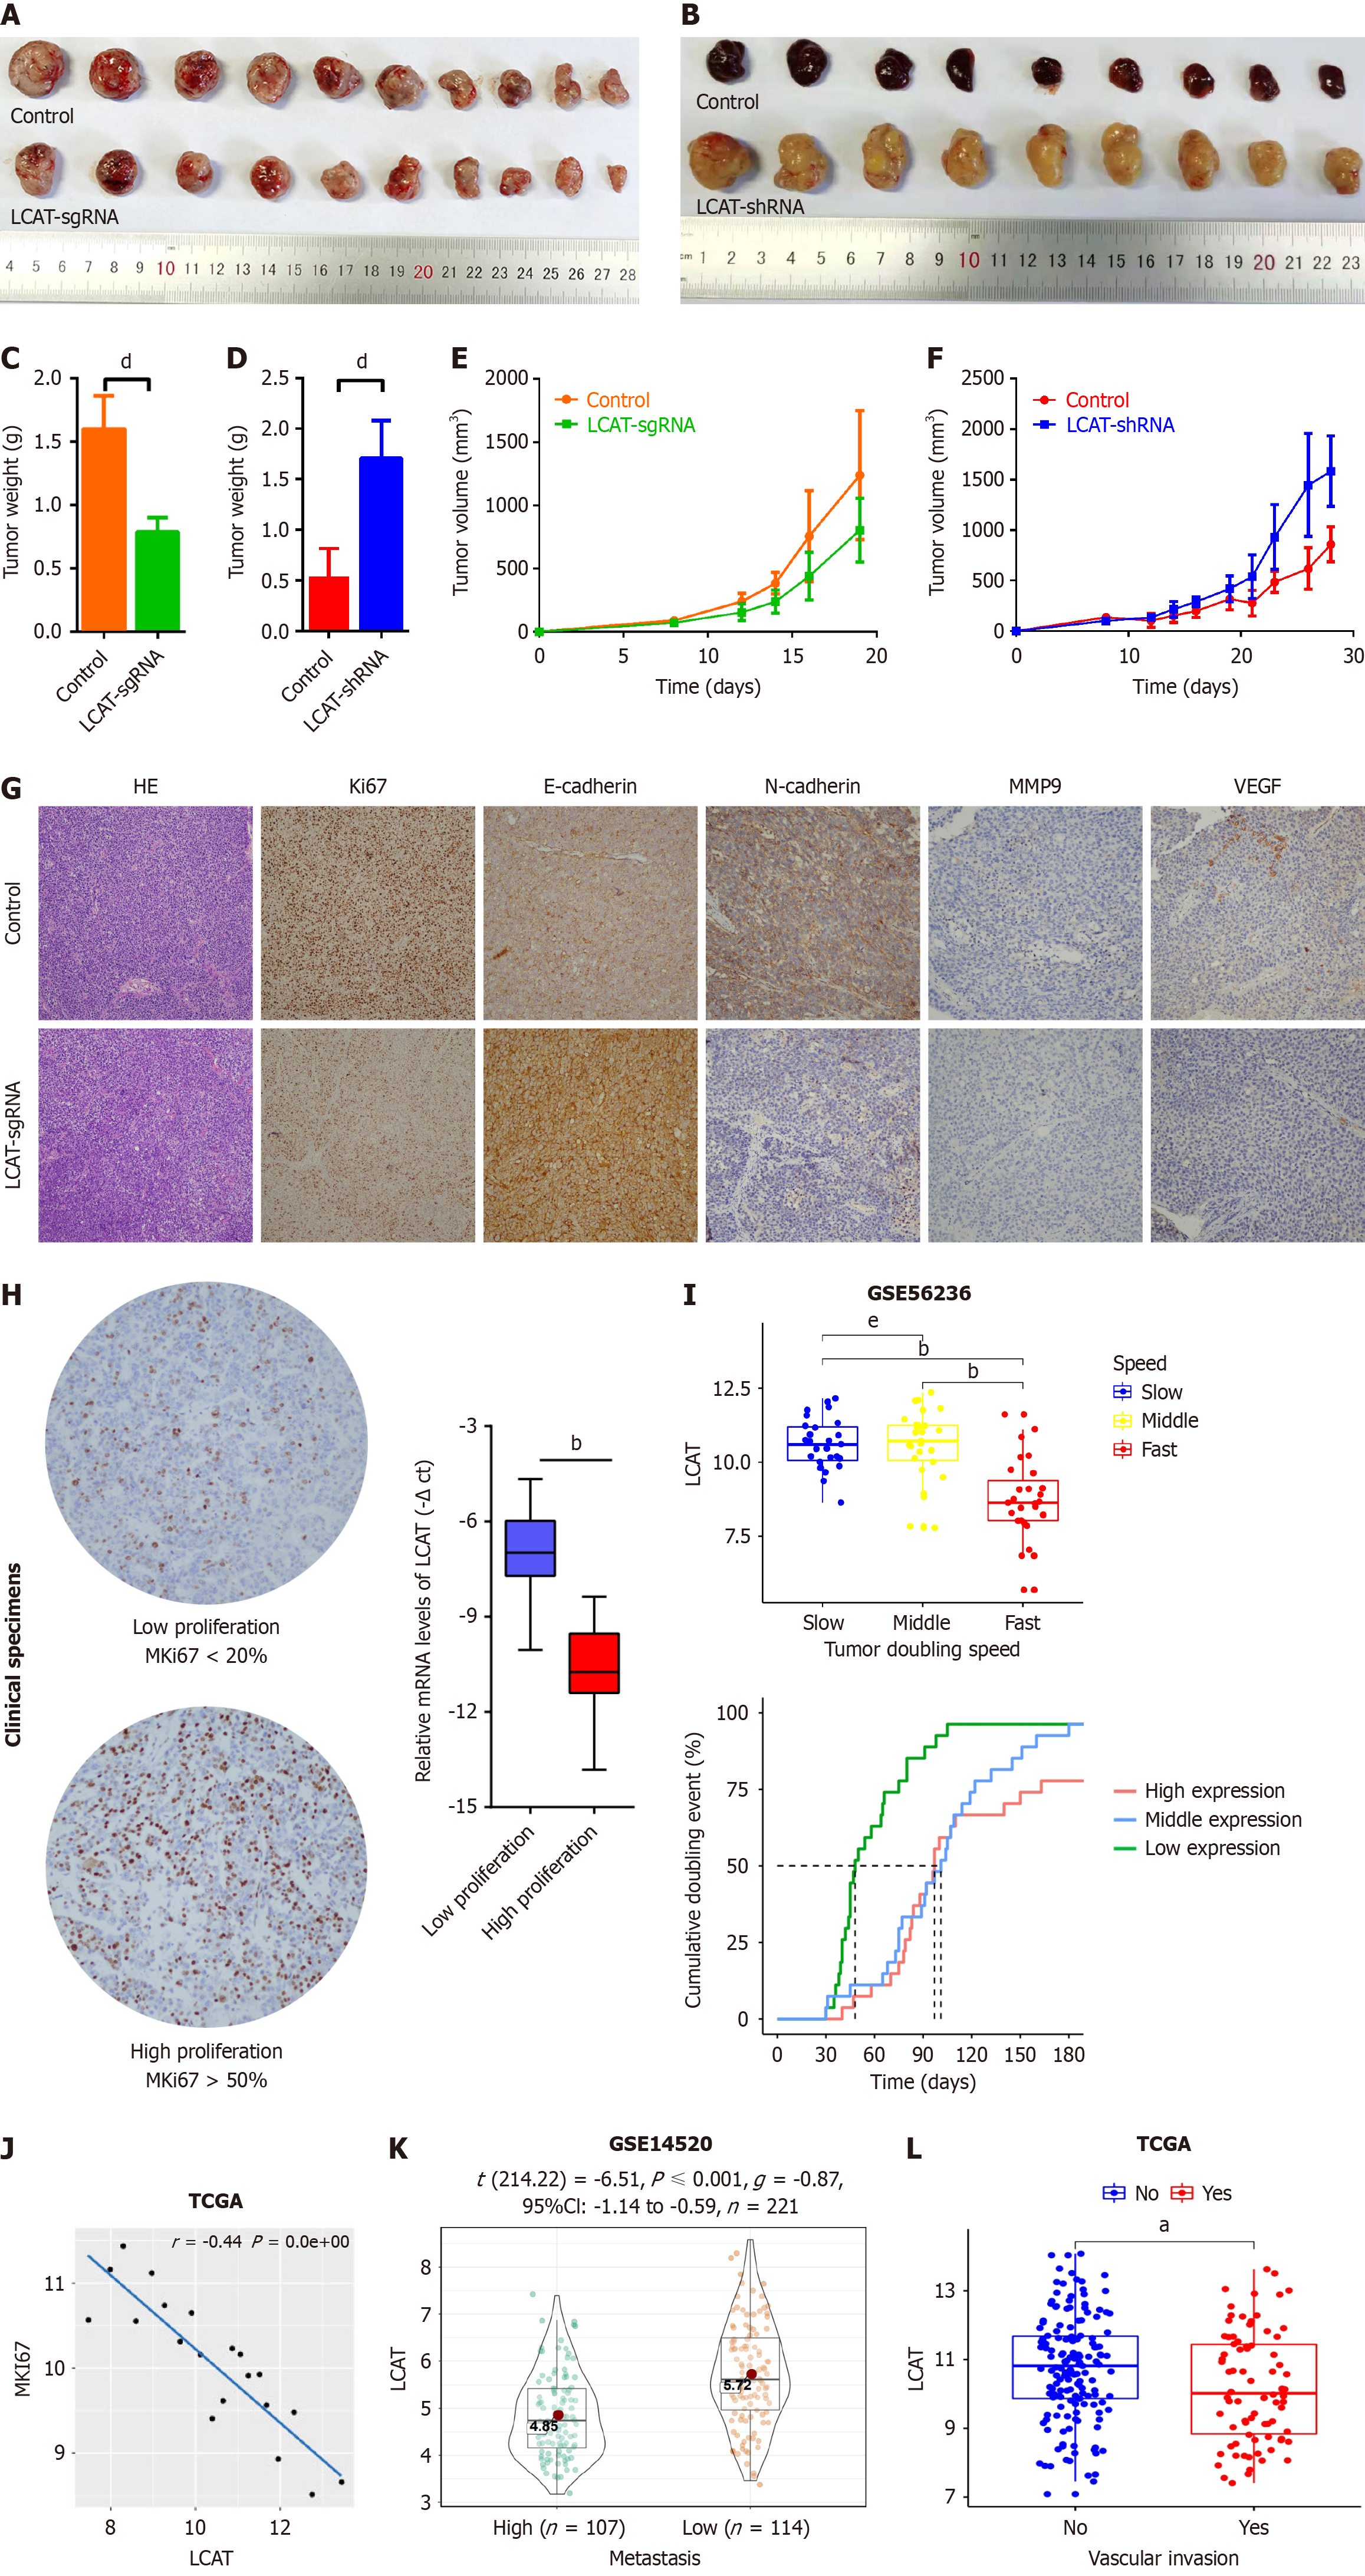
Figure 3 Lecithin-cholesterol acyltransferase inhibits tumor growth and metastasis potential in vivo and is negatively correlated with tumor growth, metastasis and vascular invasion of hepatocellular carcinoma patients.
A-F: Huh7 and lecithin-cholesterol acyltransferase (LCAT) overexpressed Huh7 or HepG2 and LCAT knocked down HepG2 cells were used to perform the tumor formation assay in nude mice. The tumors were dissected out on day 28 (A and B). The volume (C and D) and weight (E and F) of xenograft tumors were measured at indicated time points; G: Sections of xenograft tumors were stained with hematoxylin and eosin, MKI-67, E-cadherin, N-cadherin, matrix metalloproteinase 9 (MMP9), and vascular endothelial growth factor (VEGF); H: The sections of hepatocellular carcinoma (HCC) tissues were stained with MKI67. The high and low proliferative of HCC tissues were defined by MKI67 over 50% and MKI67 lower than 20% respectively (left). The mRNA levels of LCAT in HCC tissues were quantified by quantitative real-time polymerase chain reaction (right); I: Expression levels of LCAT in different growth speeds and the relationship between LCAT expression levels and tumor doubling time in the GSE54236 dataset were analyzed; J: Correlation analysis of LCAT mRNA expression with MKI67 using the The Cancer Genome Atlas (TCGA)-LICH dataset; K: Decreased LCAT exhibited in high metastasis HCC patients according to Wang’s cohort (GSE14520); L: Decreased LCAT exhibited in HCC patients with vascular invasion according to TCGA-LICH cohort. aP < 0.01, bP < 0.0001, dP < 0.001, eNS: Not significant. LCAT: Lecithin-cholesterol acyltransferase; TCGA: The Cancer Genome Atlas.
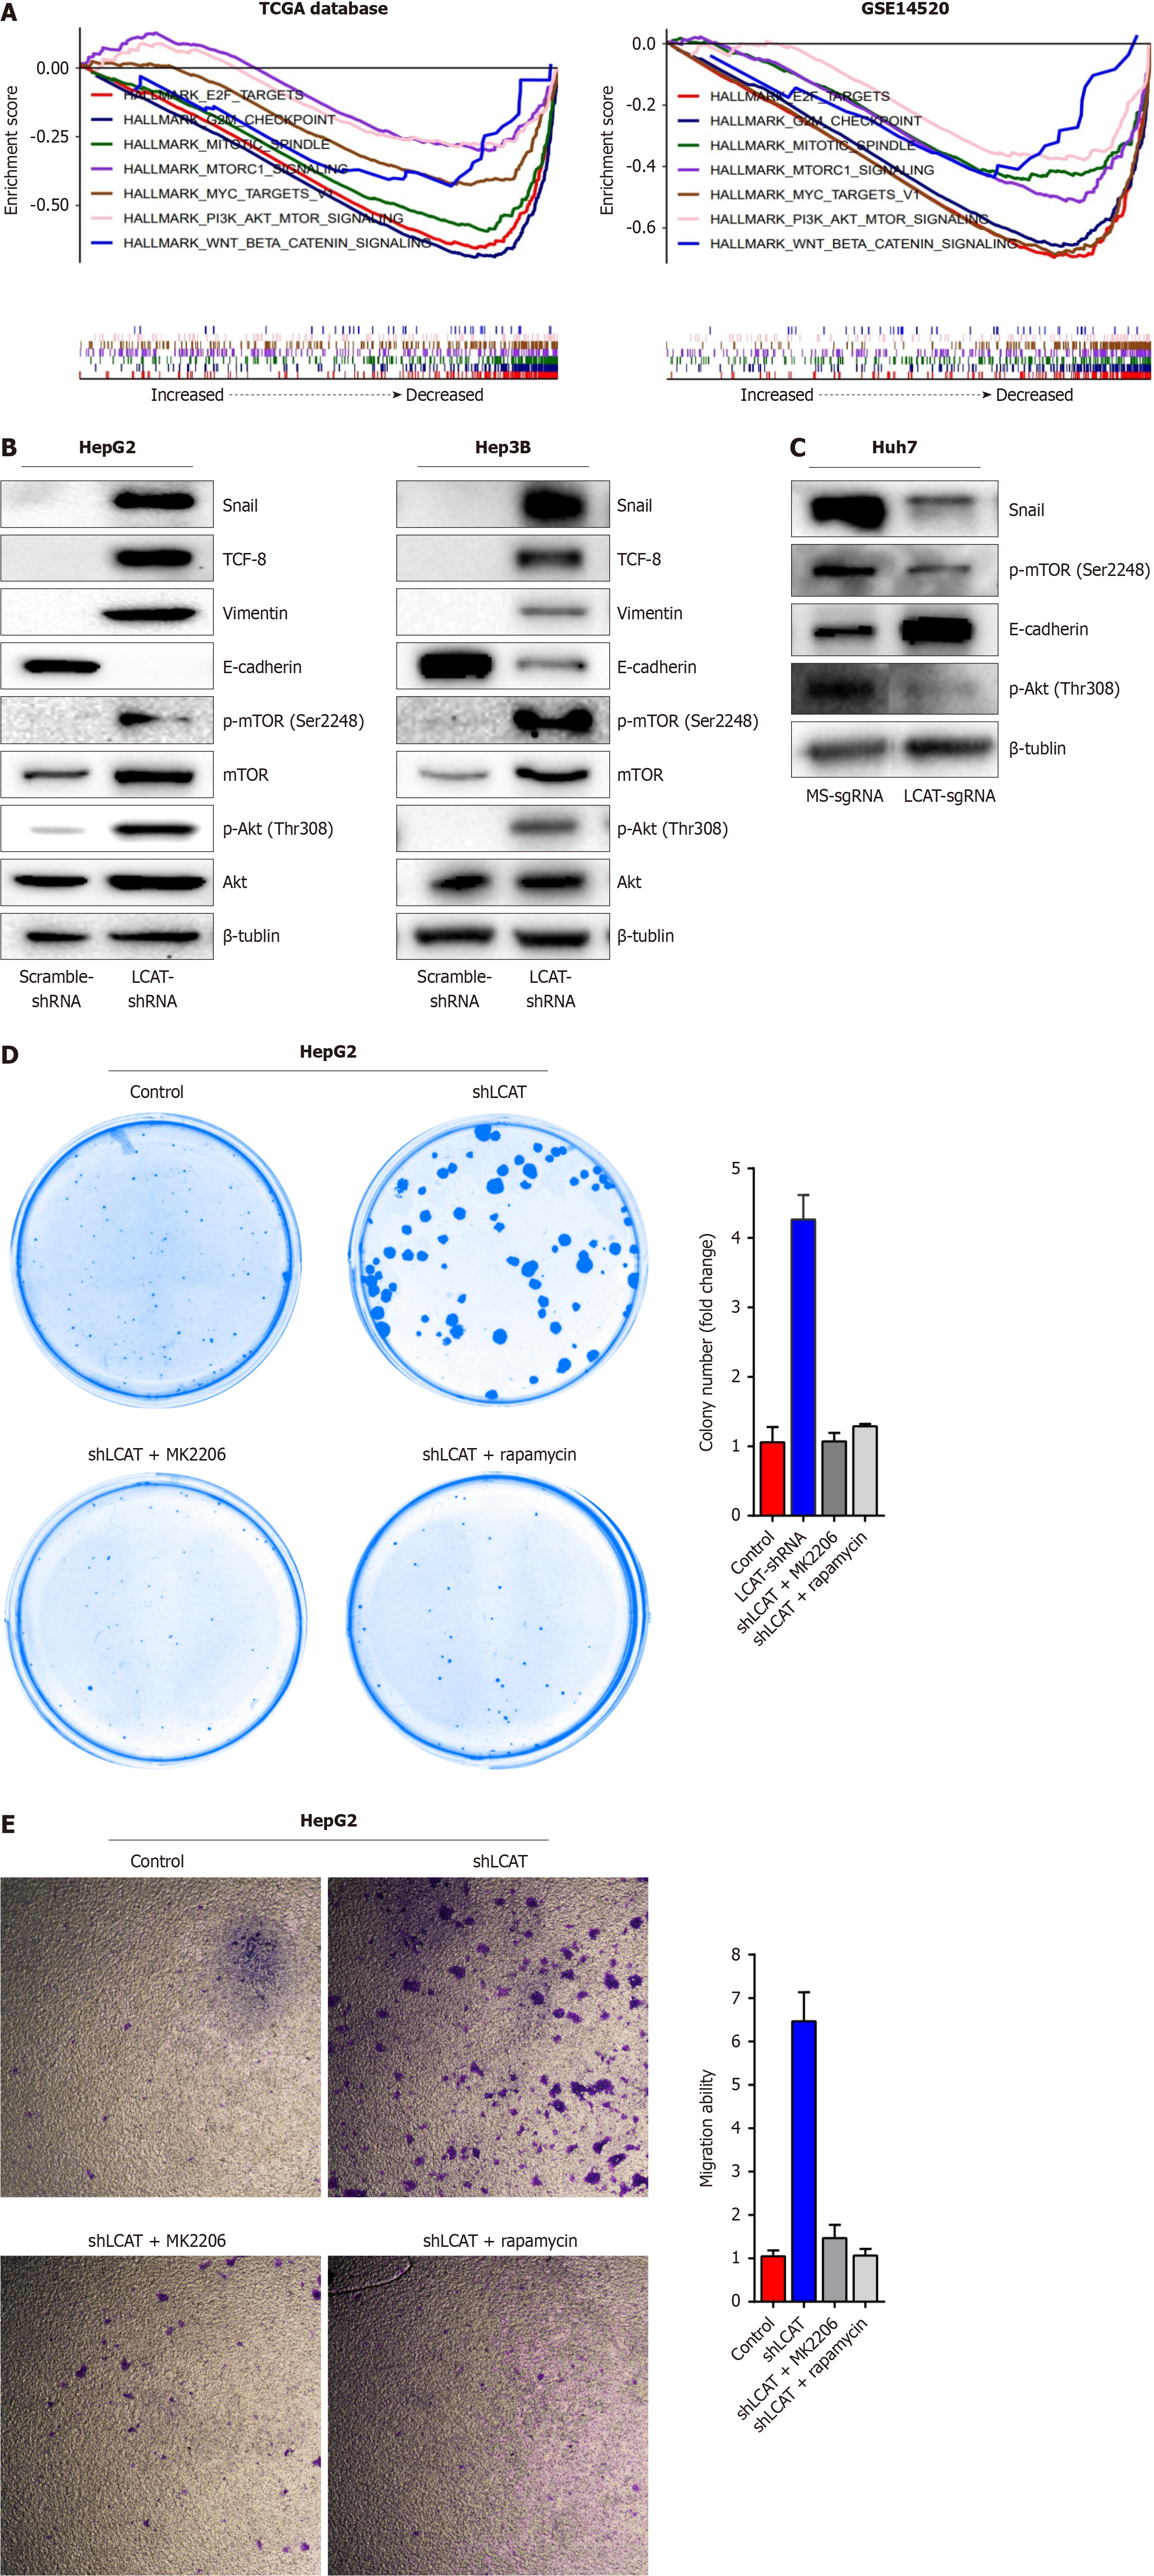
Figure 4 Downregulation of lecithin-cholesterol acyltransferase activates PI3K/AKT/mTOR signaling pathway and epithelial-mesenchy
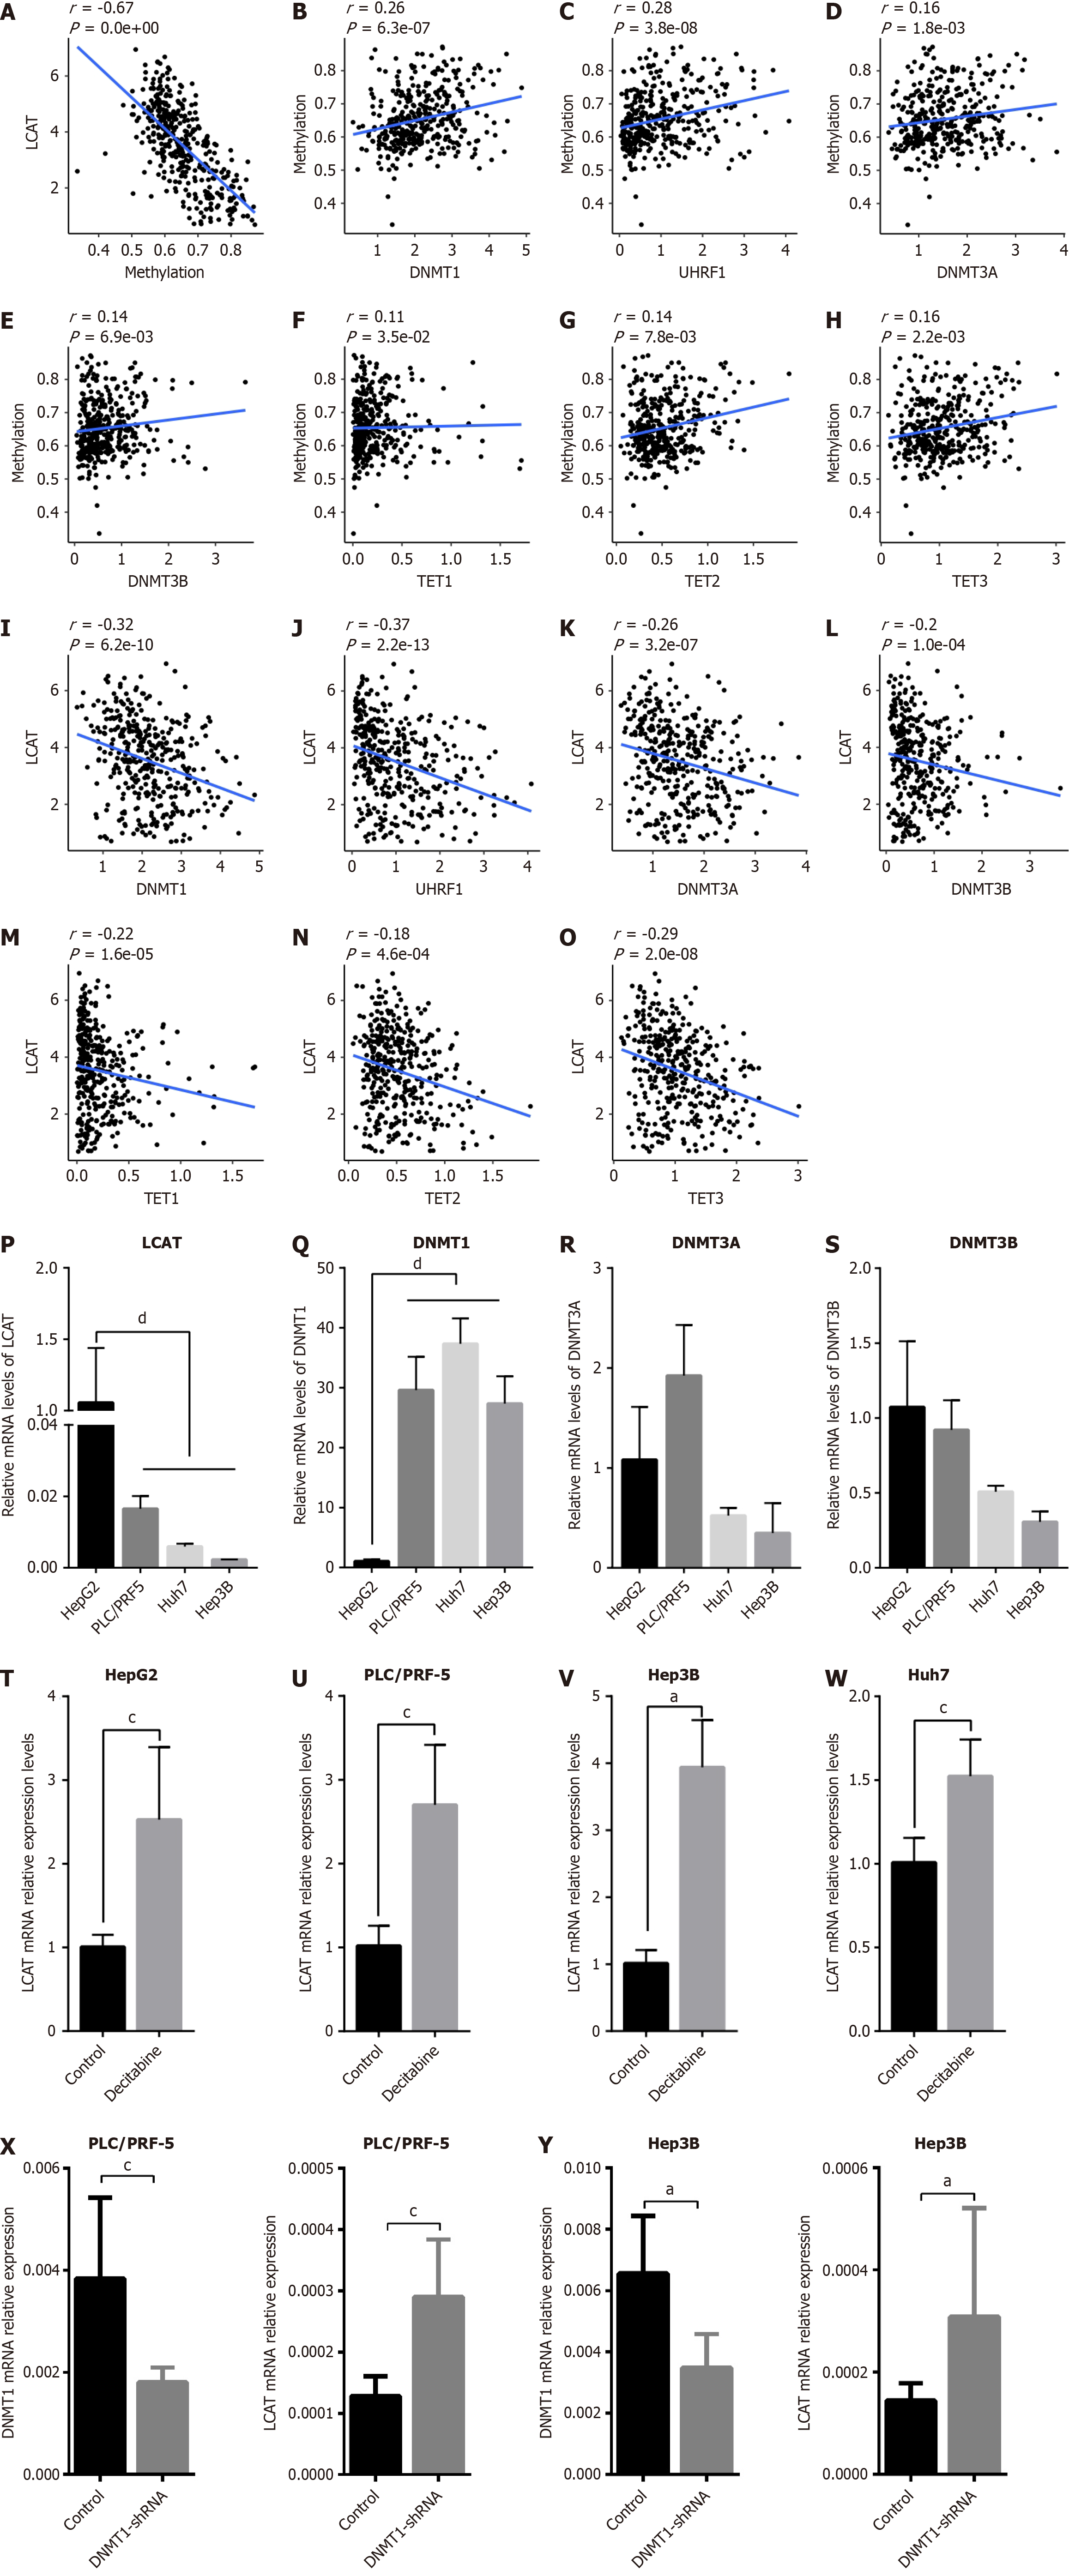
Figure 5 DNA methyltransferase 1 regulates the expression of lecithin-cholesterol acyltransferase via affecting its methylation.
A: Regression analysis between gene expression and DNA methylation of lecithin-cholesterol acyltransferase (LCAT); B-E: Regression analysis between DNA methylation of LCAT and the DNA methyltransferases DNMT1, UHRF1, DNMT3A and DNMT3B; F-H: Regression analysis between DNA methylation of LCAT and the DNA demethyltransferases TET1, TET2 and TET3; I-O: Regression analysis between DNA methyltransferases or demethyltransferases and LCAT; P-S: Quantitative real-time polymerase chain reaction (qRT-PCR) analysis of mRNA expression levels of LCAT, DNMT1, DNMT3A and DNMT3B in HepG2, PLC/PRF5, Hep3B, and Huh7 cells; T-W: qRT-PCR analysis of LCAT mRNA after treatment with decitabine for 72 h in different HCC lines; X and Y: qRT-PCR analysis of mRNA expression levels of LCAT and DNMT1 in PLC/PRF5 and Hep3B. aP < 0.01, cP < 0.05, dP < 0.001. LCAT: Lecithin-cholesterol acyltransferase.
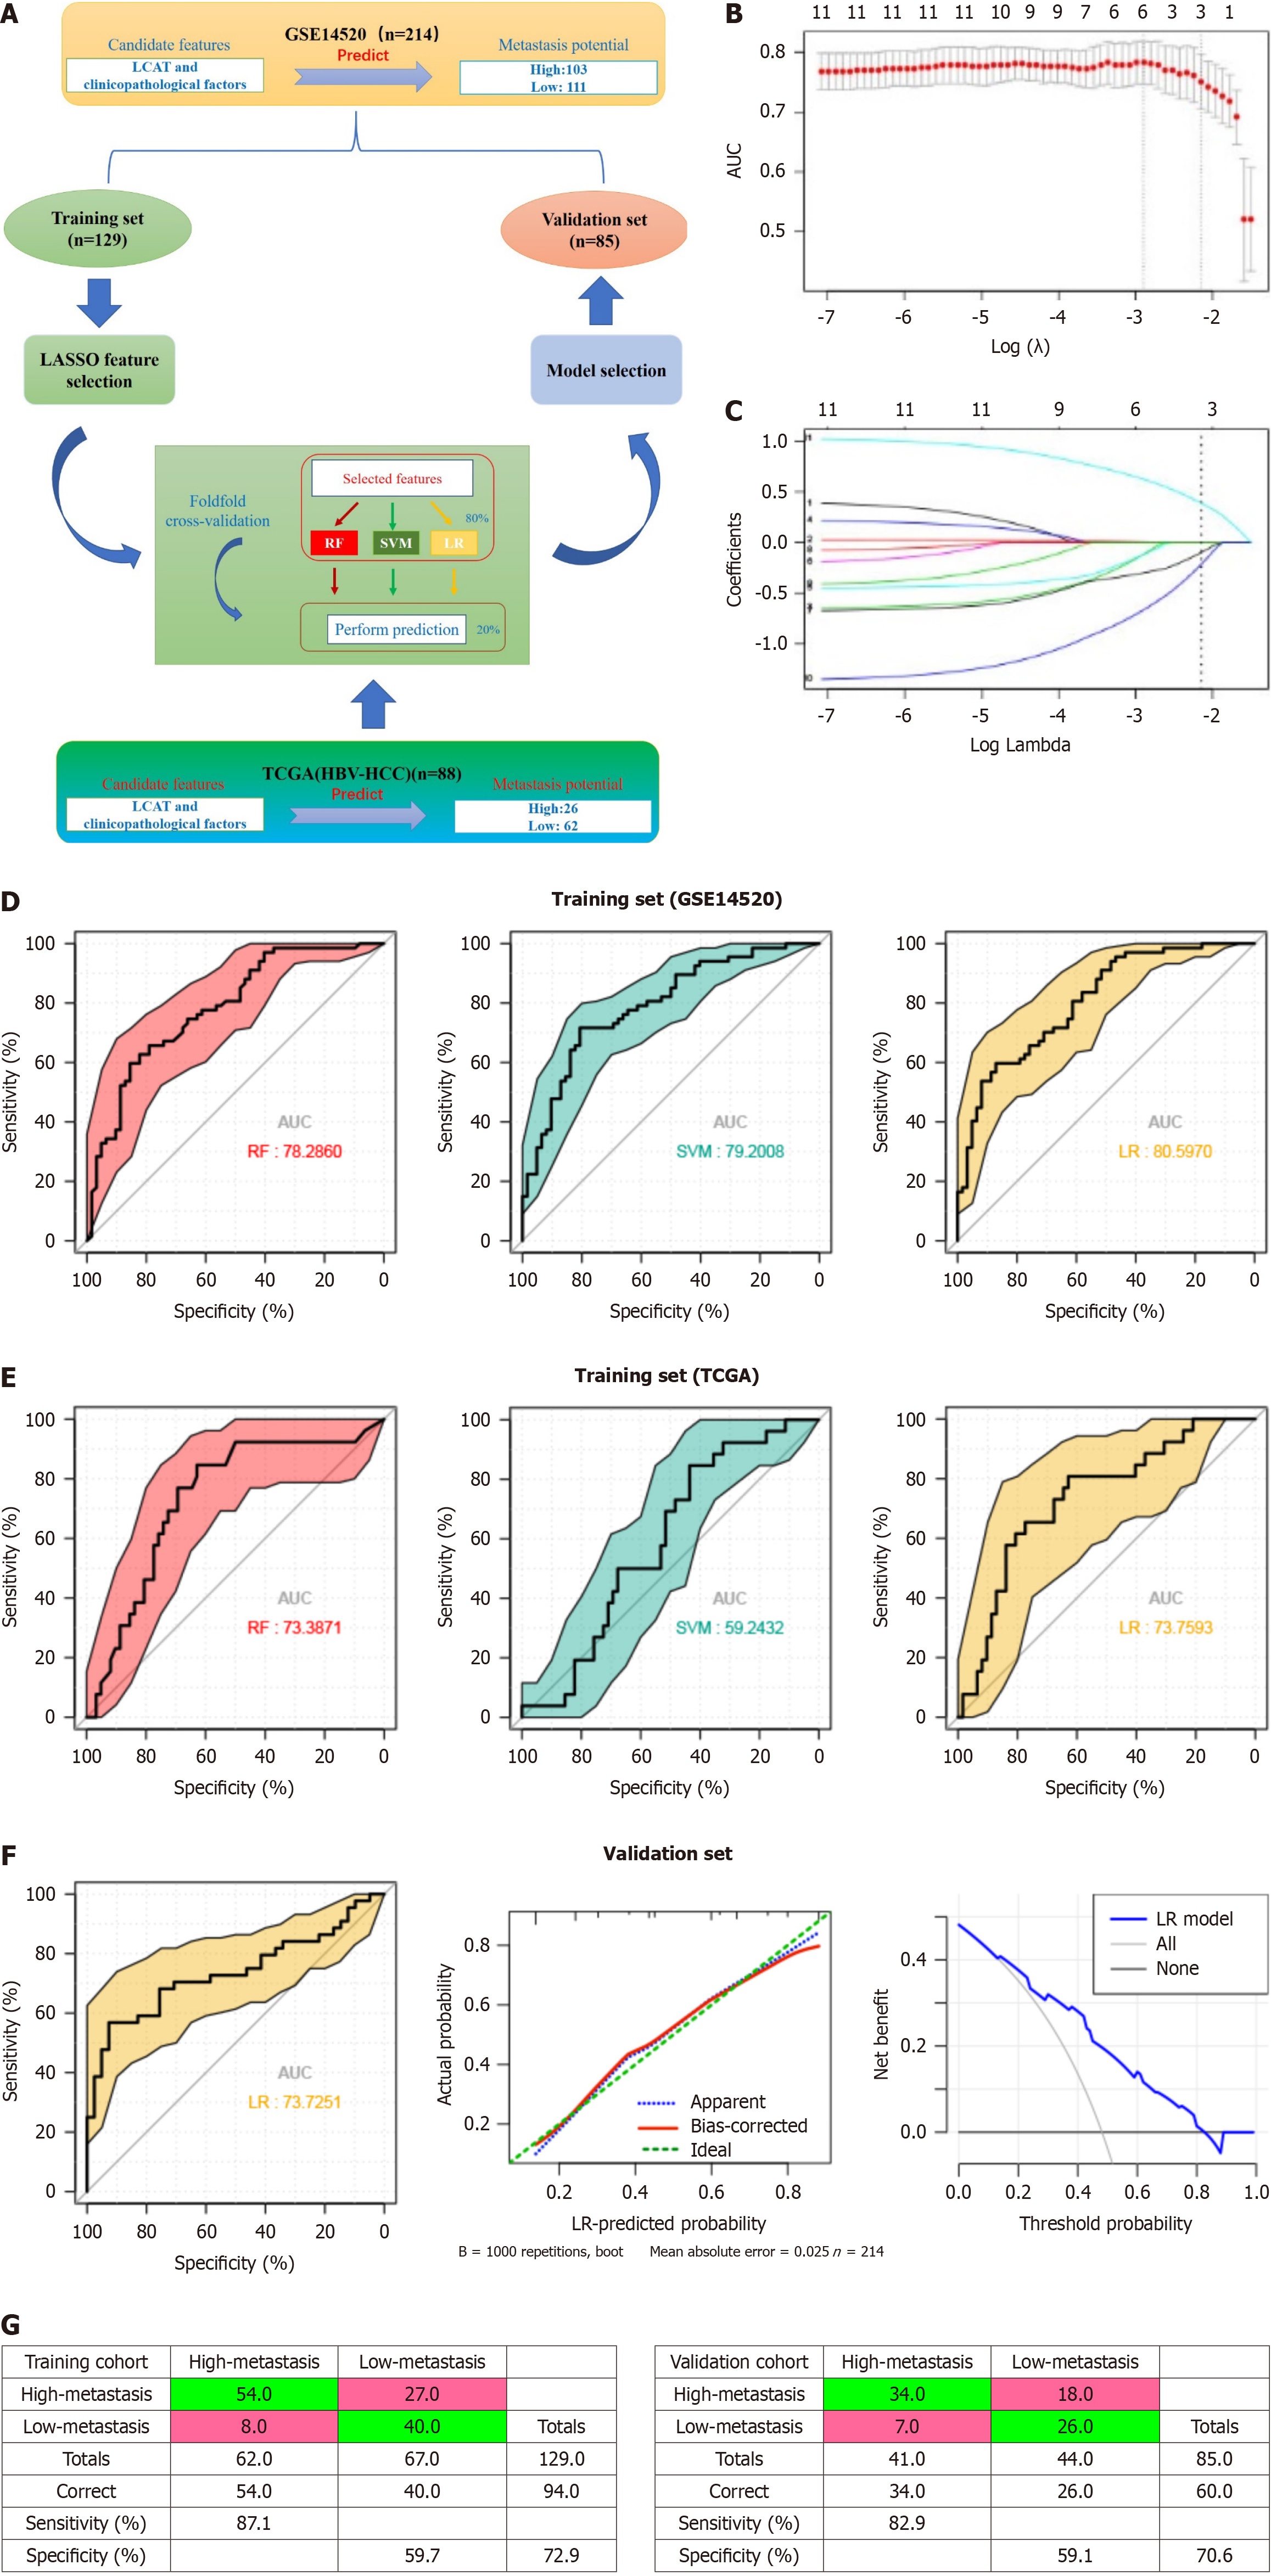
Figure 6 Predictive power of the models based on lecithin-cholesterol acyltransferase and clinicopathological characteristics in classification of metastasis subtypes.
A: Schematic representation of feature selection and classifiers building. The hepatocellular carcinoma (HCC) dataset (n = 214) was split into training (n = 129) and validation (n = 85) sets and feature selection was performed and classifiers were built through fivefold cross-validation within the training set and a dataset (n = 85) from The Cancer Genome Atlas (TCGA) database to select an optimal model. The best-performing model built from the whole training set was applied to the validation set; B and C: least absolute shrinkage and selection operator was performed to select the optimal features; D: Receiver operating characteristic (ROC) curves of the three classifiers based on the cross-validation within the training set (from GSE14520); E: ROC curves of the three classifiers based on the cross-validation within the training set from TCGA; F: ROC curve from applying the best-performing classifier (logistic regression, LR) built from the whole training set (from GSE14520) to the validation set, the calibration curve and decision curve for LR model in the validation set; G: Confusion tables of binary results of the HCC metastasis prediction model in the training and validation data sets. HCC: Hepatocellular carcinoma; HBV: Hepatitis B virus; TCGA: The Cancer Genome Atlas; LASSO: Least Absolute Shrinkage and Selection Operator; LR: Logistic regression.
- Citation: Li Y, Jiang LN, Zhao BK, Li ML, Jiang YY, Liu YS, Liu SH, Zhu L, Ye X, Zhao JM. Lecithin-cholesterol acyltransferase is a potential tumor suppressor and predictive marker for hepatocellular carcinoma metastasis. World J Gastrointest Oncol 2024; 16(8): 3651-3671
- URL: https://www.wjgnet.com/1948-5204/full/v16/i8/3651.htm
- DOI: https://dx.doi.org/10.4251/wjgo.v16.i8.3651


