Copyright
©The Author(s) 2024.
World J Gastrointest Oncol. Aug 15, 2024; 16(8): 3585-3599
Published online Aug 15, 2024. doi: 10.4251/wjgo.v16.i8.3585
Published online Aug 15, 2024. doi: 10.4251/wjgo.v16.i8.3585
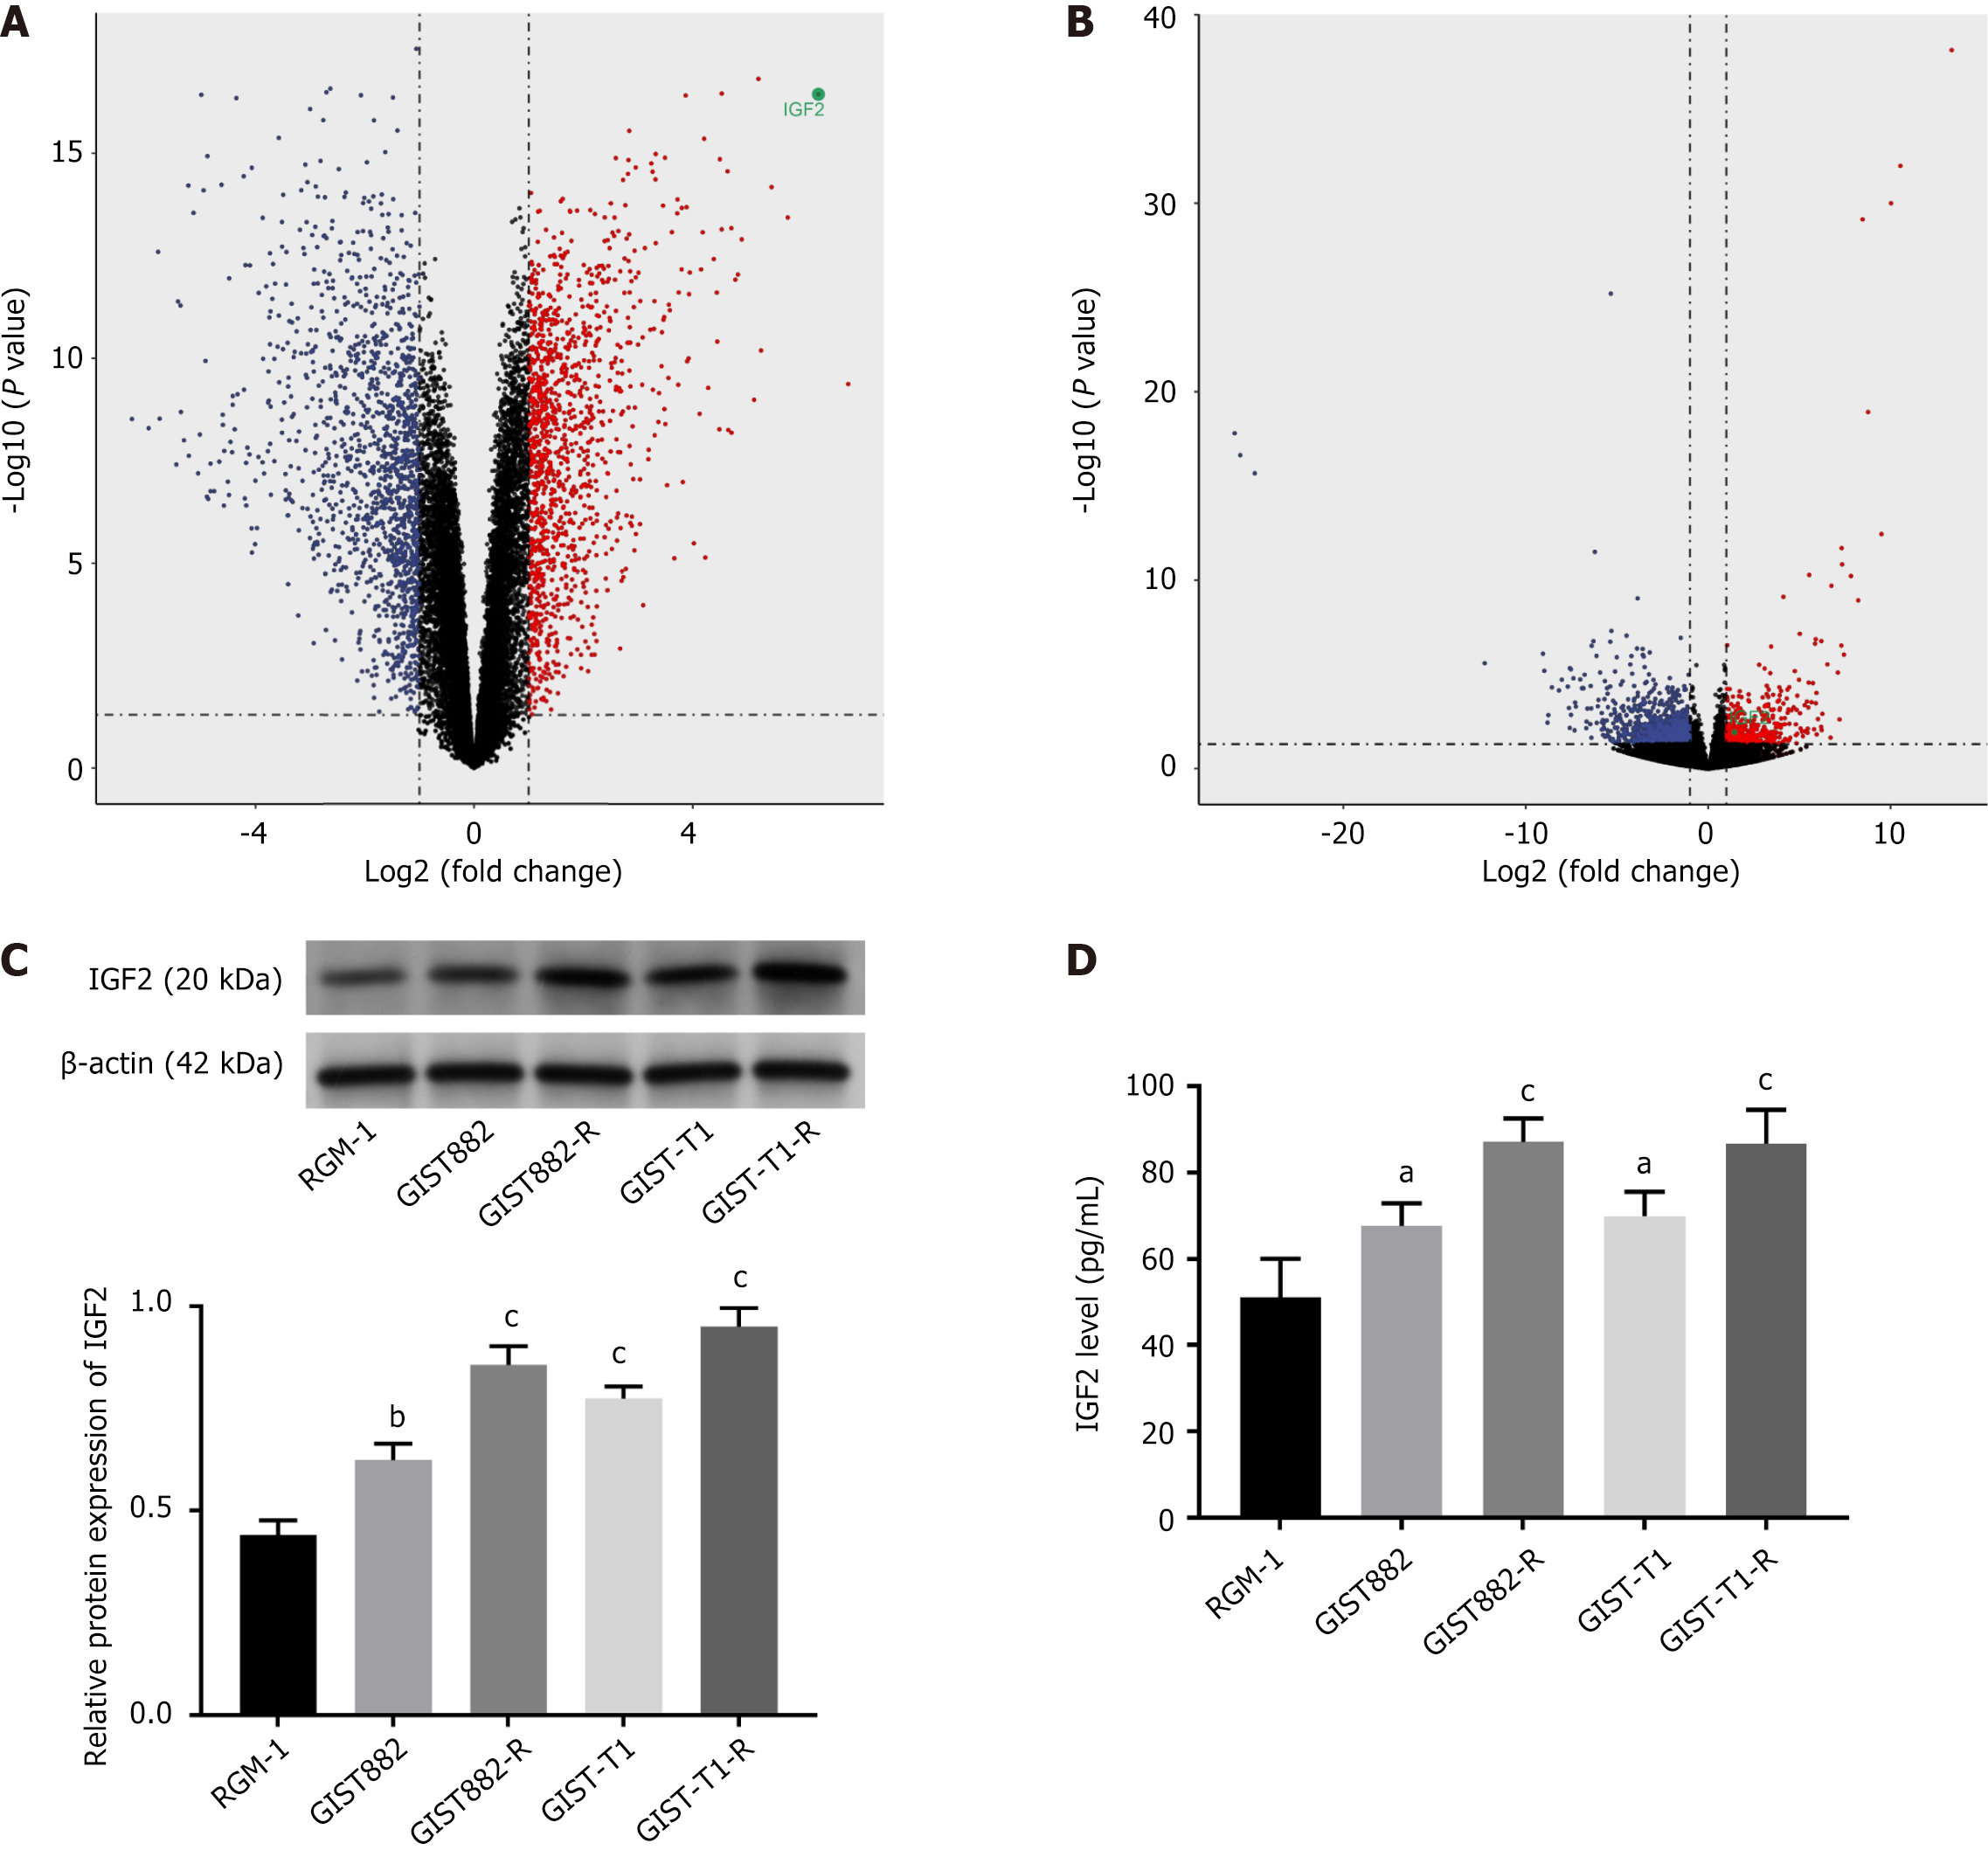
Figure 1 High expression of insulin-like growth factor 2 in gastrointestinal stromal tumors with liver metastasis and closely related to drug resistance.
A: Differentially expressed genes in gastrointestinal stromal tumors (GIST) with liver metastasis tissues and normal gastric tissues (|log2FC| > 1; P < 0.05); B: Differentially expressed genes in imatinib sensitive and in seven Imatinib-resistant GIST patients (|log2FC| > 1; P < 0.05); C: Western blot assay of insulin-like growth factor 2 (IGF2) protein expression in GIST cell lines (GIST882, GIST882-R, GIST-T1, GIST-T1-R); D: ELISA of IGF2 expression in GIST cell lines (GIST882, GIST882-R, GIST-T1, GIST-T1-R). Data are mean ± standard deviation. aP < 0.05; bP < 0.01; cP < 0.001.
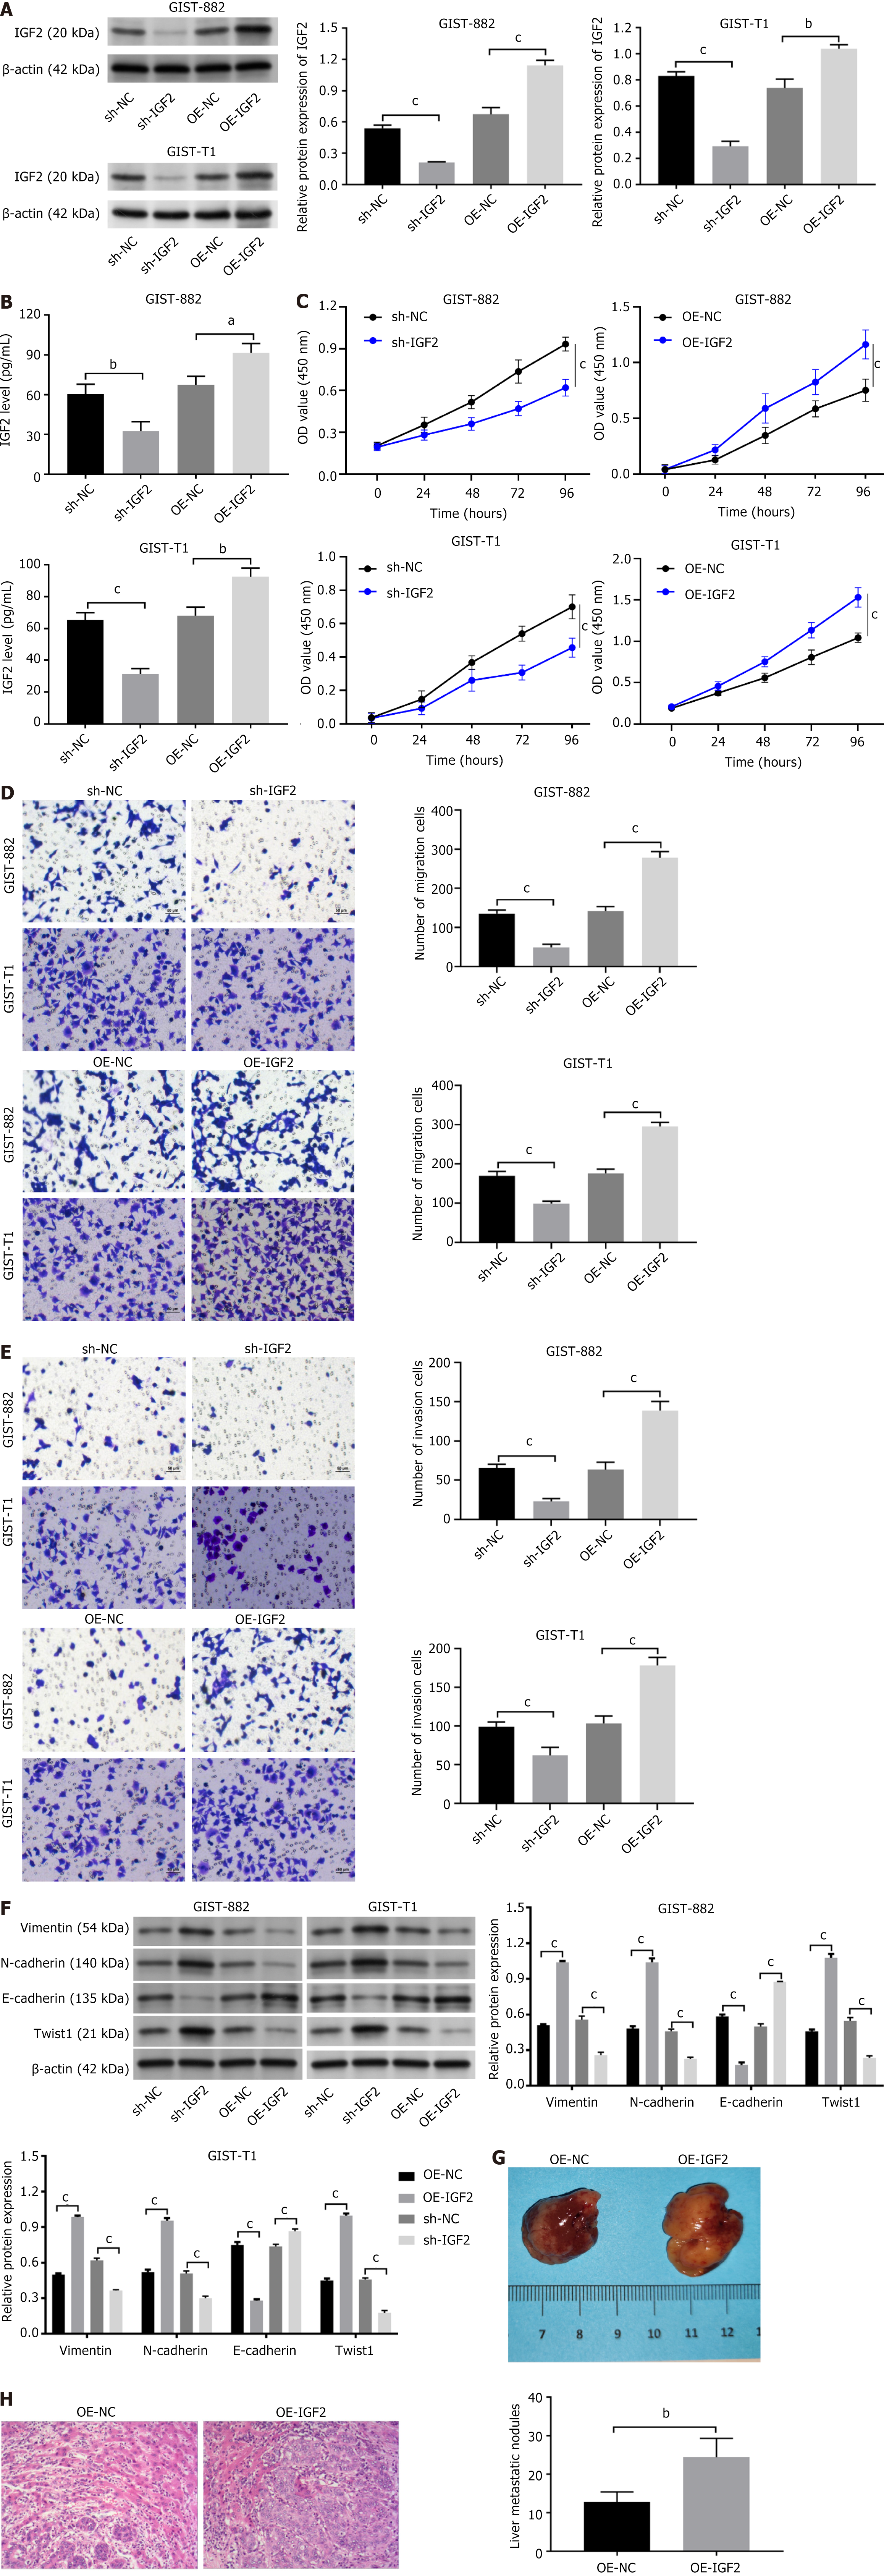
Figure 2 Insulin-like growth factor 2 promotes malignant characteristics and metastasis of gastrointestinal stromal tumors.
A: Western blot measured the transfection efficiency of OE-insulin-like growth factor 2 (IGF2) or sh-IGF2 in gastrointestinal stromal tumors (GIST) 882 and GIST-T1 cells; B: ELISA of IGF2 expression in OE-IGF2 or sh-IGF2 transfected GIST882 and GIST-T1 cells; C: Cell counting kit-8 assay assessed cell viability in GIST882 and GIST-T1 cells; D: Transwell assay evaluated the migration of OE-IGF2- or sh-IGF2-transfected cells (scar bar = 50 μm); E: Transwell assays of the invasiveness of OE-IGF2 or sh-IGF2 transfected cells. (scar bar = 50 μm); F: Detection of proteins involved in epithelial-mesenchymal transition (vimentin, N-cadherin, E-cadherin, Twist1) in OE-IGF2 or sh-IGF2 transfected cells; G: Liver tissue from tumor xenografts in nude mice injected withOE-IGF2 transfected GIST-T1 cells; H: Liver metastasis determined by hematoxylin-eosin staining. Data are mean ± standard deviation. aP < 0.05; bP < 0.01; cP < 0.001.
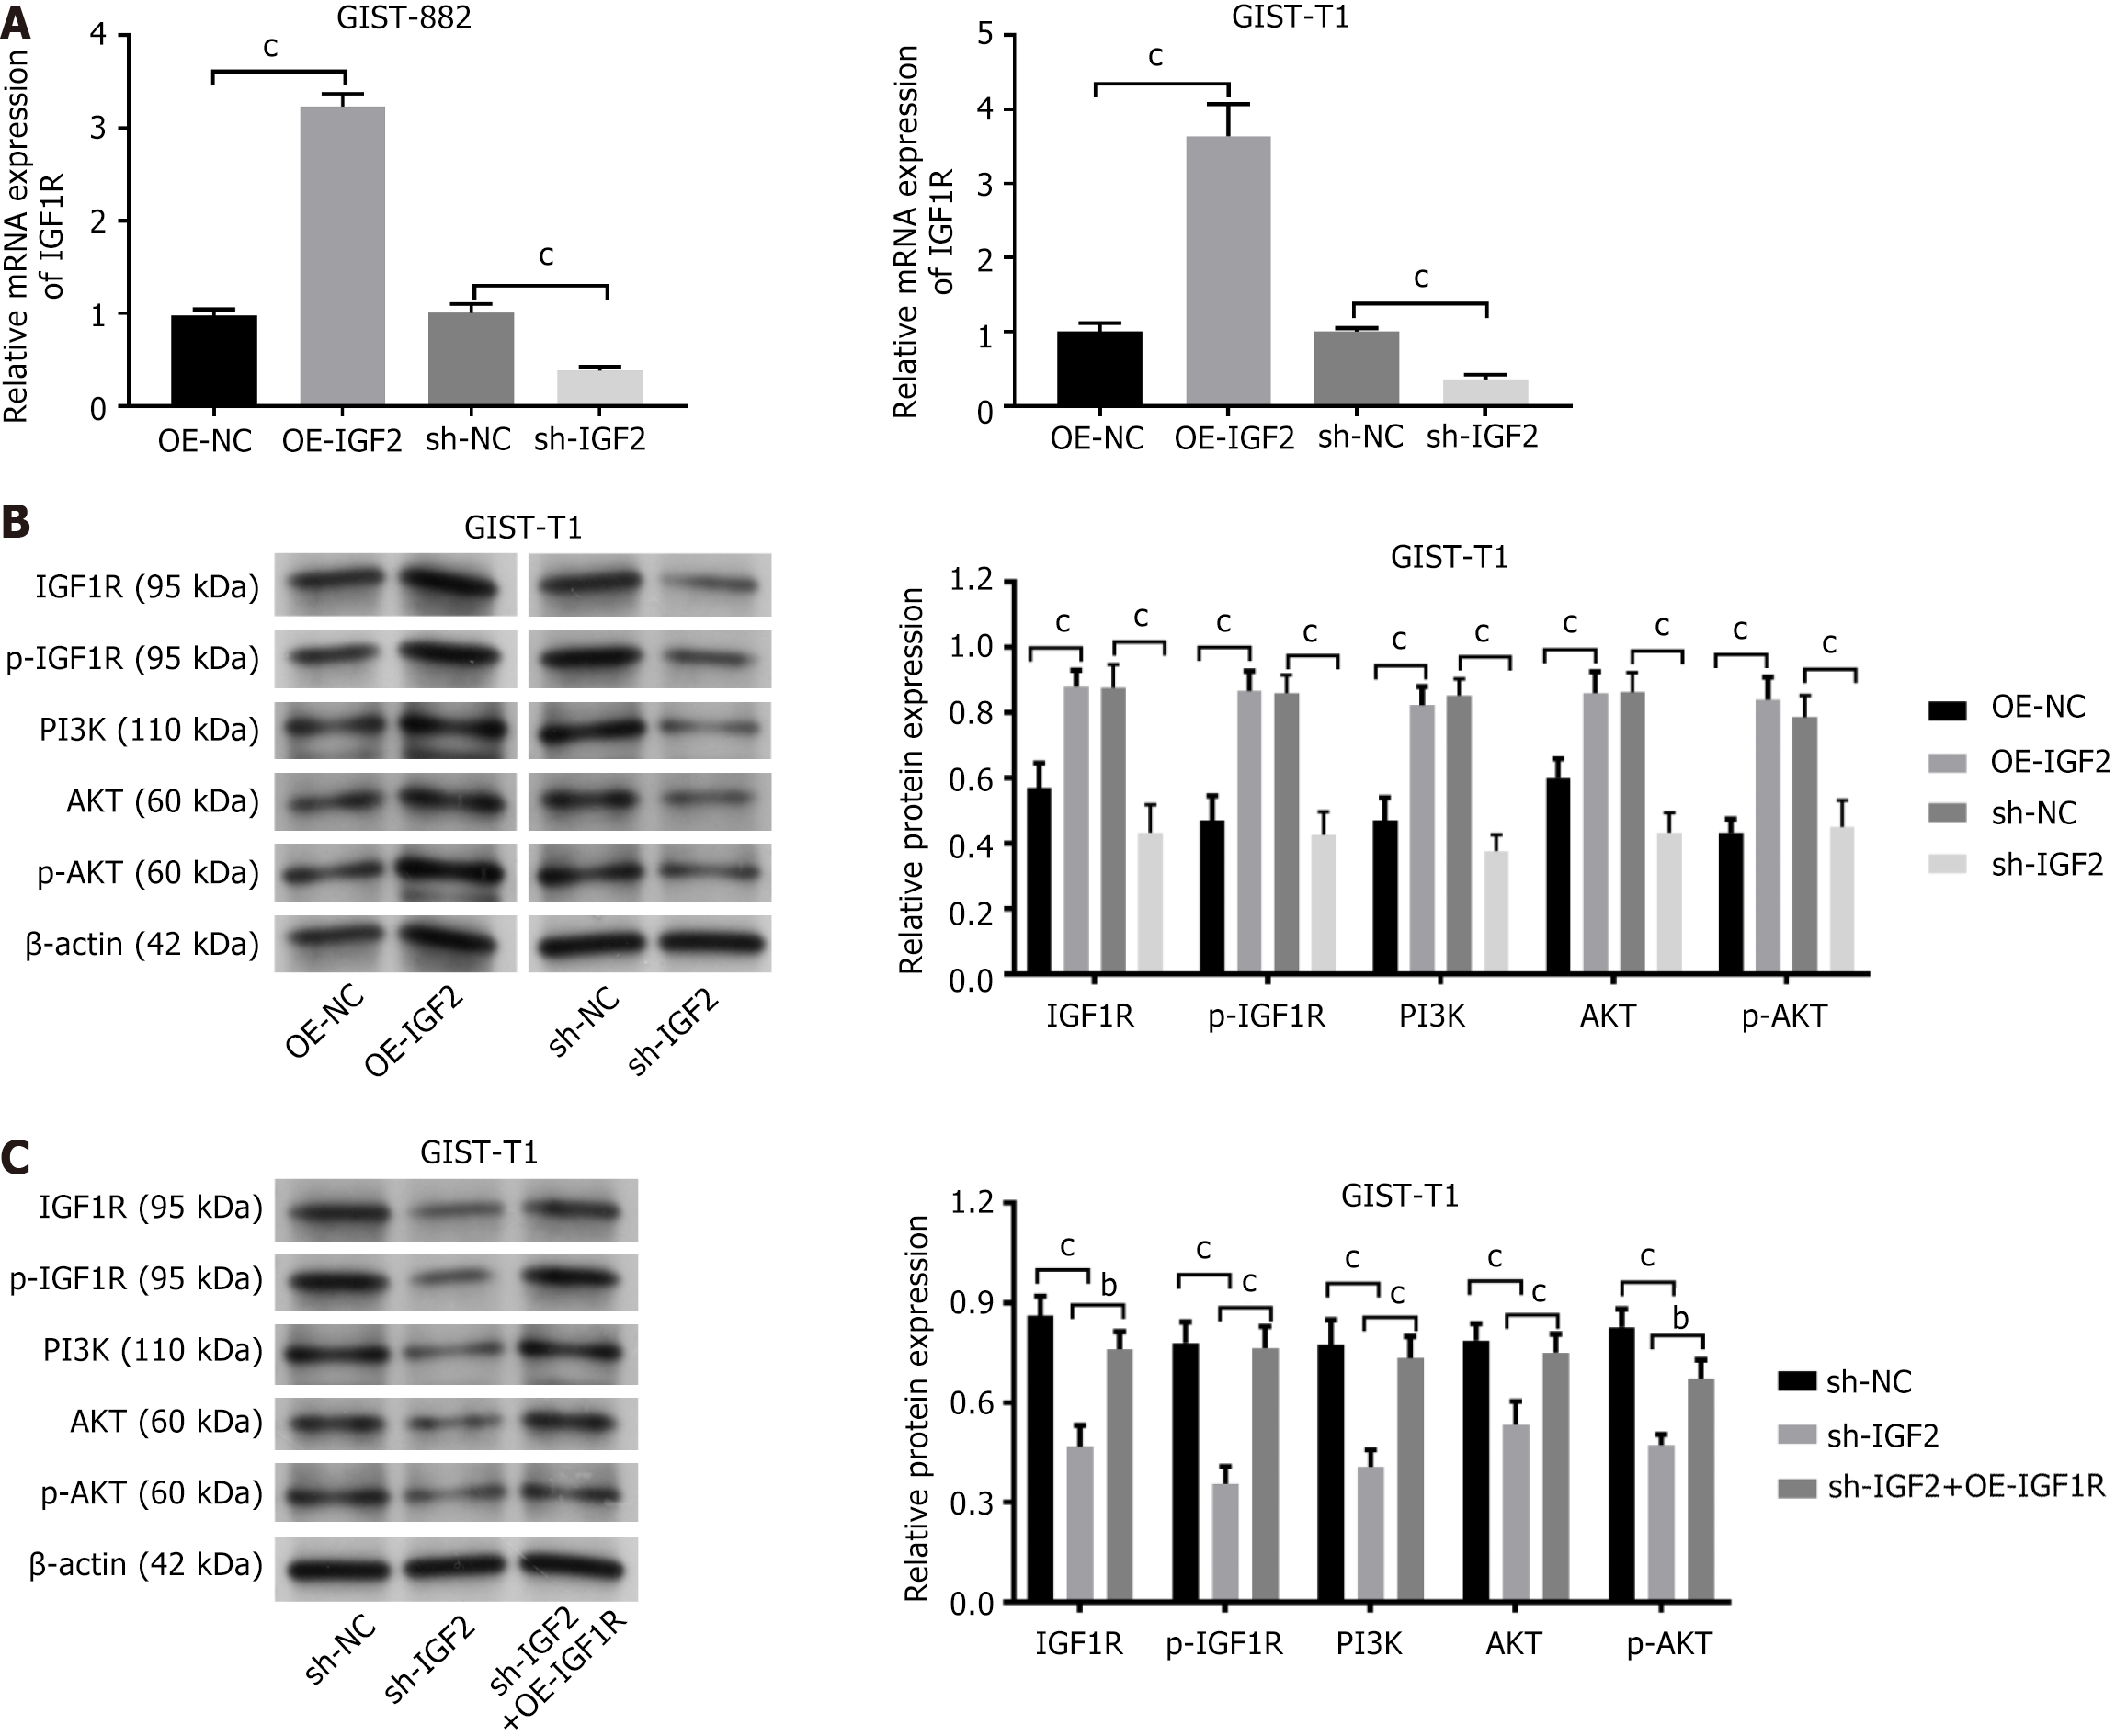
Figure 3 Insulin-like growth factor 2 activated the IGF1R signaling in gastrointestinal stromal tumors cells.
A: Quantitative reverse transcriptase PCR assay of IGF1R mRNA expression in gastrointestinal stromal tumors (GIST) 882 and GIST-T1 cells after OE-insulin-like growth factor 2 (IGF2) or sh-IGF2 transfection; B: Detection of protein levels (IGF1R, p-IGF1R, PI3K, AKT, and p-AKT) involved in the PI3K/AKT in OE-IGF2 or sh-IGF2 transfected-GIST-T1 cells by western blot assay; C: Detection of protein levels (IGF1R, p-IGF1R, PI3K, AKT, and p-AKT) involved in the PI3K/AKT in GIST-T1 cells after sh-IGF2 and OE-IGF2R transfection by western blot assay. bP < 0.01; cP < 0.001.
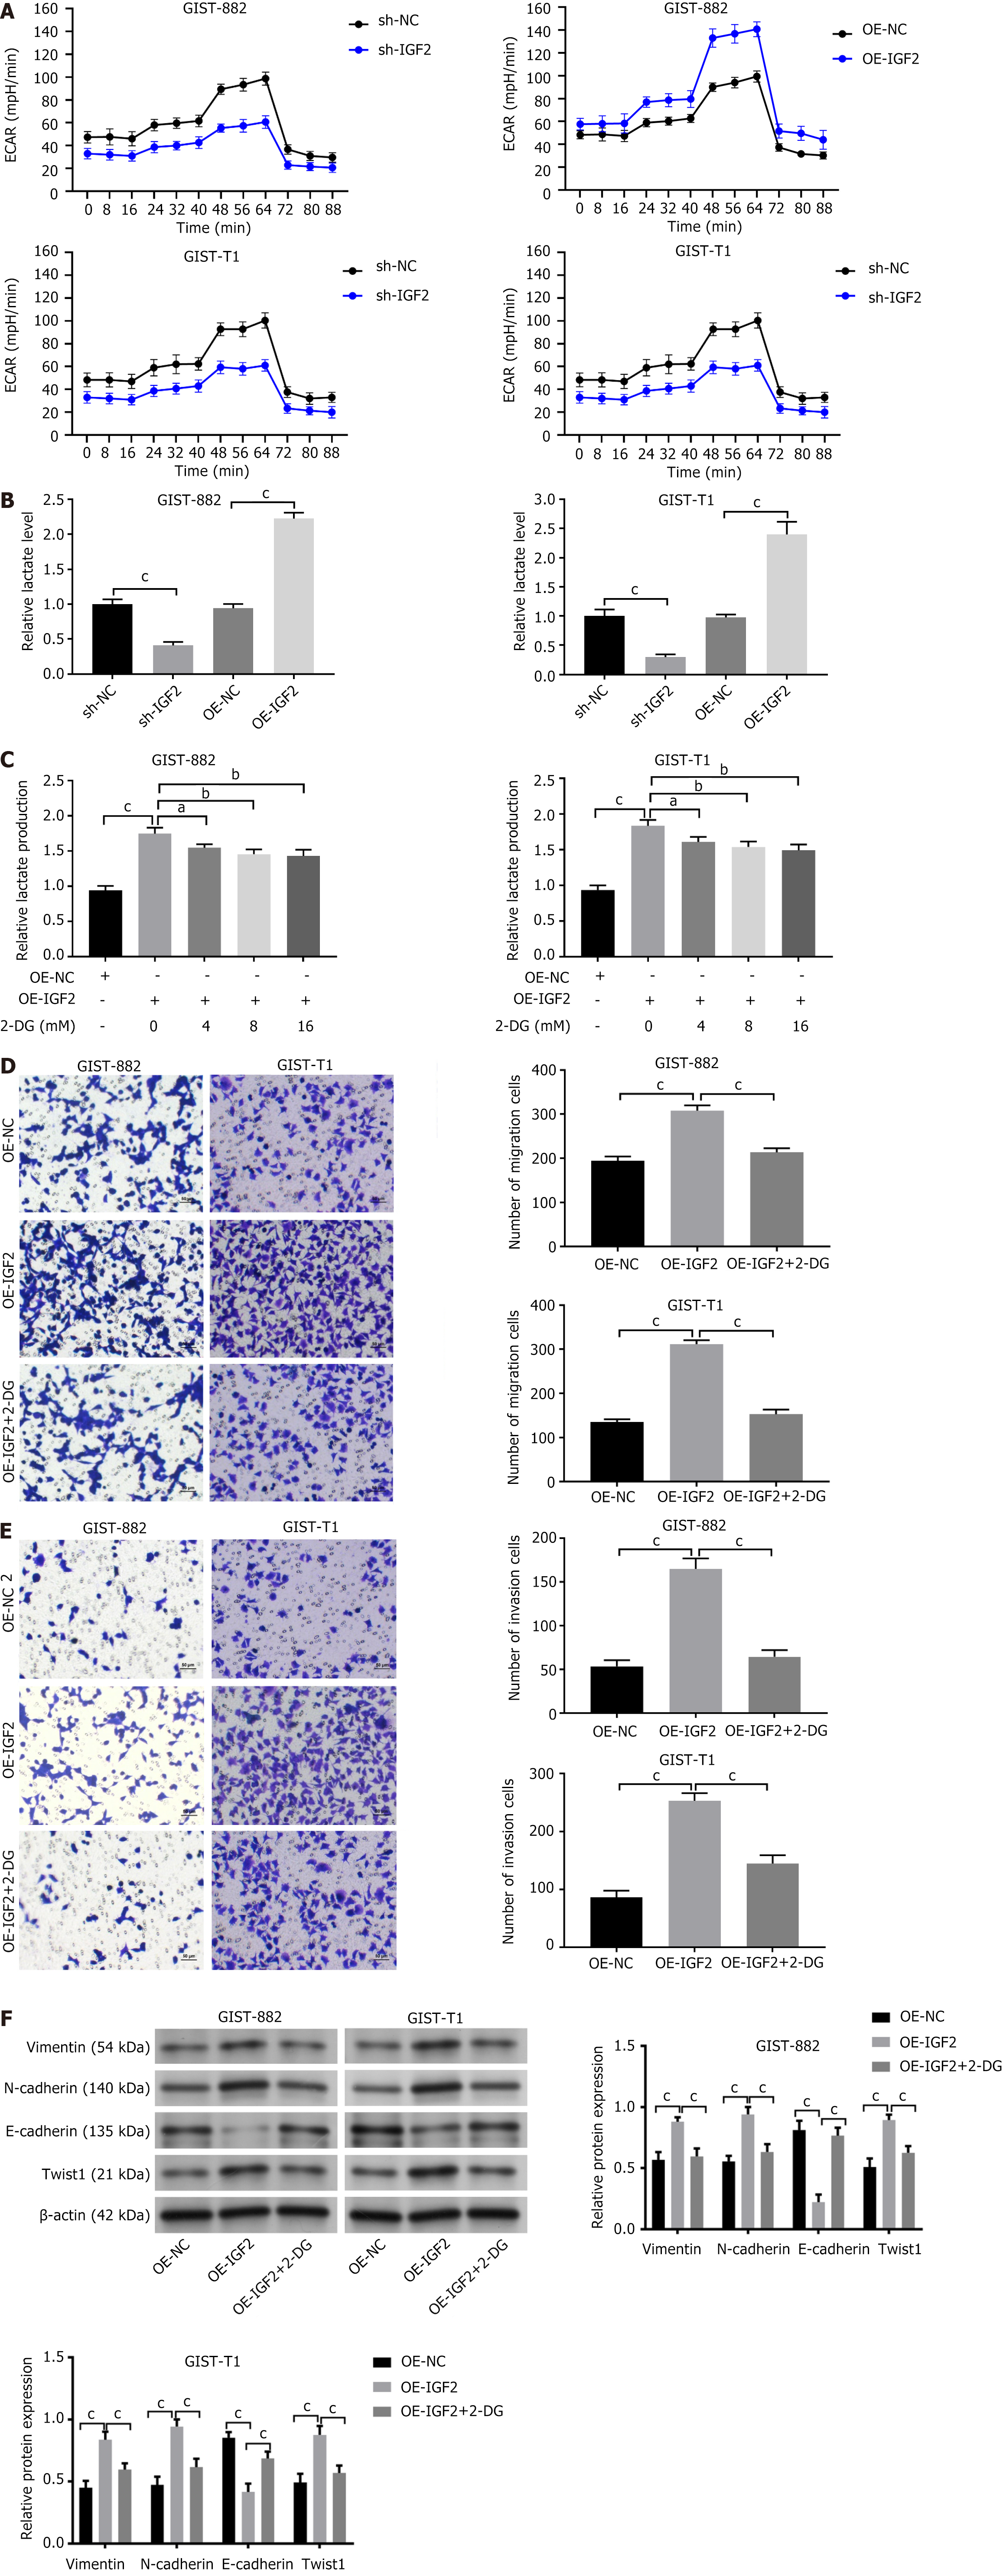
Figure 4 Insulin-like growth factor 2/IGF1R-mediatedglycolysisis required for gastrointestinal stromal tumors with liver metastasis.
A: Extracellular acidification rate was measured; B: Lactate production in gastrointestinal stromal tumors (GIST) 882 and GIST-T1 cells transfected with sh-insulin-like growth factor 2 (IGF2) or OE-IGF2 were measured; C: Lactate production in OE-IGF2-GIST882 and GIST-T1 cells cotreated with 2-deoxy-D-glucose (2-DG) (0, 4, 8, and 16 mmol/L); D: Transwell assay of the migration ability of the OE-IGF2-cells cotreated with 2-DG (scar bar = 50 μm); E: Transwell assay of the invasiveness of OE-IGF2-cells cotreated with 2-DG (scar bar = 50 μm); F: Assay of proteins involved in epithelial-mesenchymal transition (vimentin, N-cadherin, E-cadherin, Twist1) in OE-IGF2-cells cotreated with 2-DG. Data are mean ± standard deviation. aP < 0.05; bP < 0.01; cP < 0.001.
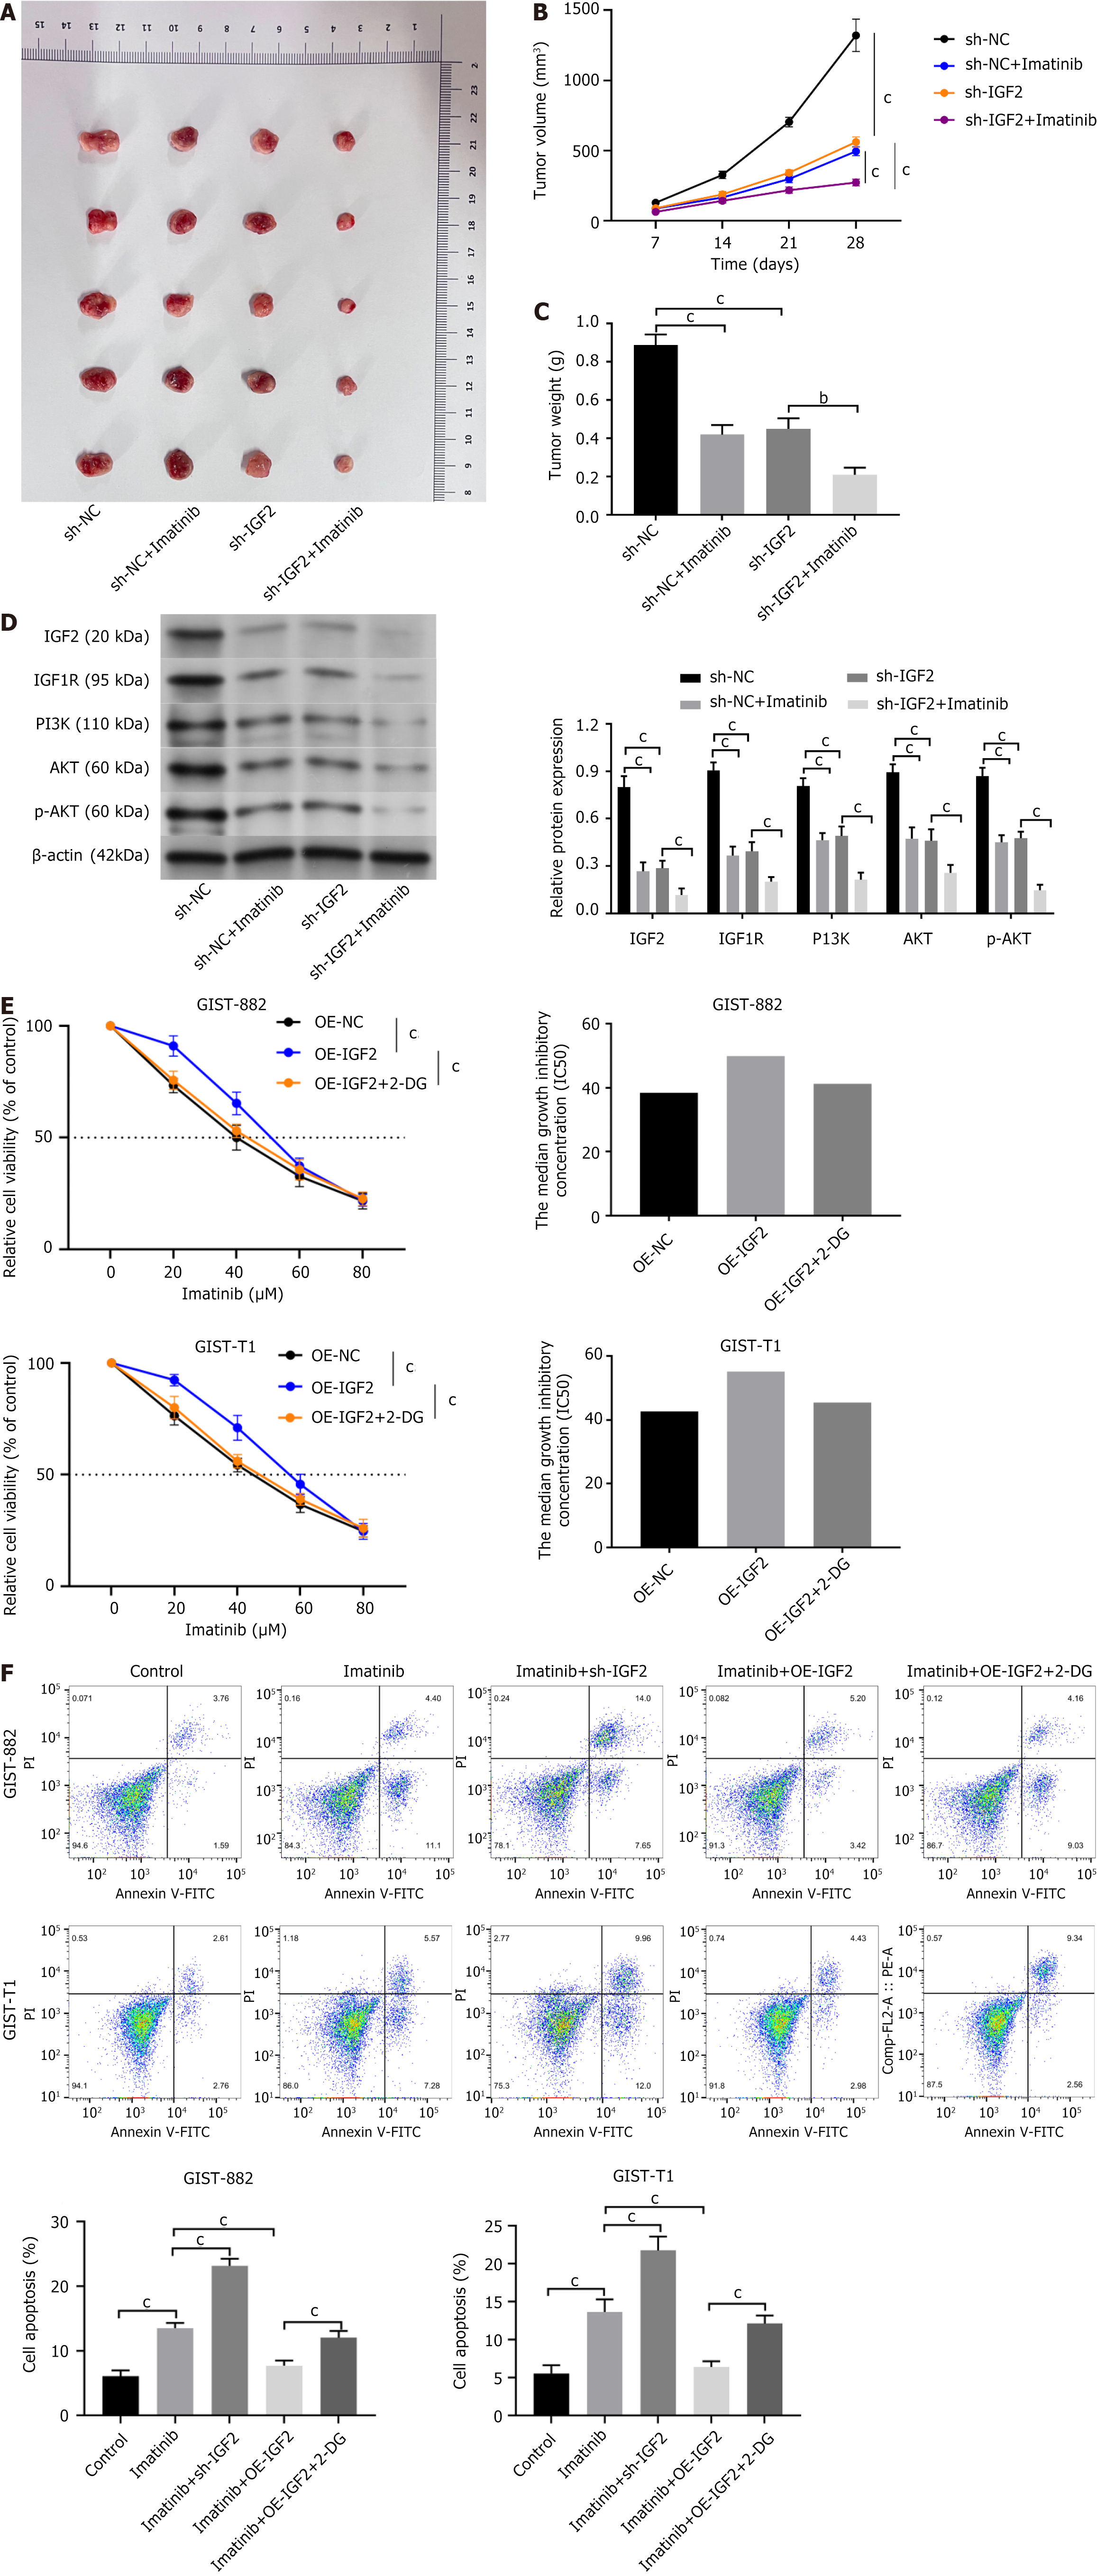
Figure 5 Insulin-like growth factor 2/IGF1R regulates imatinib resistance of gastrointestinal stromal tumors by regulating glycolysis.
A: Tumor growth in xenografted nude mice; B: Tumor volumes in sh-insulin-like growth factor 2 (IGF2)-gastrointestinal stromal tumors (GIST)-T1 mouse xenograft models treated with imatinib; C: After 35 d, the mice were killed and the tumors were weighed; D: Assay of IGF1R, p-IGF1R, PI3K, AKT, and p-AKT in tumor tissue by western blotting; E: Assay of drug sensitivity in OE-IGF2-GIST882 and GIST-T1 cells treated with 2-deoxy-D-glucose (2-DG); F: Flow cytometry assay of apoptosis of OE-IGF2-GIST882 and GIST-T1 cells treated with 2-DG. Data are mean ± standard deviation. aP < 0.05; bP < 0.01; cP < 0.001.
- Citation: Li DG, Jiang JP, Chen FY, Wu W, Fu J, Wang GH, Li YB. Insulin-like growth factor 2 targets IGF1R signaling transduction to facilitate metastasis and imatinib resistance in gastrointestinal stromal tumors. World J Gastrointest Oncol 2024; 16(8): 3585-3599
- URL: https://www.wjgnet.com/1948-5204/full/v16/i8/3585.htm
- DOI: https://dx.doi.org/10.4251/wjgo.v16.i8.3585


